Free Statistics
of Irreproducible Research!
Description of Statistical Computation | |||||||||||||||||||||||||||||||||||||||||
|---|---|---|---|---|---|---|---|---|---|---|---|---|---|---|---|---|---|---|---|---|---|---|---|---|---|---|---|---|---|---|---|---|---|---|---|---|---|---|---|---|---|
| Author's title | |||||||||||||||||||||||||||||||||||||||||
| Author | *The author of this computation has been verified* | ||||||||||||||||||||||||||||||||||||||||
| R Software Module | rwasp_univariatedataseries.wasp | ||||||||||||||||||||||||||||||||||||||||
| Title produced by software | Univariate Data Series | ||||||||||||||||||||||||||||||||||||||||
| Date of computation | Fri, 18 Dec 2009 07:51:37 -0700 | ||||||||||||||||||||||||||||||||||||||||
| Cite this page as follows | Statistical Computations at FreeStatistics.org, Office for Research Development and Education, URL https://freestatistics.org/blog/index.php?v=date/2009/Dec/18/t1261147955mn60hotvf9p296j.htm/, Retrieved Sat, 27 Apr 2024 09:47:40 +0000 | ||||||||||||||||||||||||||||||||||||||||
| Statistical Computations at FreeStatistics.org, Office for Research Development and Education, URL https://freestatistics.org/blog/index.php?pk=69384, Retrieved Sat, 27 Apr 2024 09:47:40 +0000 | |||||||||||||||||||||||||||||||||||||||||
| QR Codes: | |||||||||||||||||||||||||||||||||||||||||
|
| |||||||||||||||||||||||||||||||||||||||||
| Original text written by user: | |||||||||||||||||||||||||||||||||||||||||
| IsPrivate? | No (this computation is public) | ||||||||||||||||||||||||||||||||||||||||
| User-defined keywords | |||||||||||||||||||||||||||||||||||||||||
| Estimated Impact | 101 | ||||||||||||||||||||||||||||||||||||||||
Tree of Dependent Computations | |||||||||||||||||||||||||||||||||||||||||
| Family? (F = Feedback message, R = changed R code, M = changed R Module, P = changed Parameters, D = changed Data) | |||||||||||||||||||||||||||||||||||||||||
| - [Univariate Data Series] [] [2009-12-18 14:51:37] [2b679e8ec54382eeb0ec0b6bb527570a] [Current] | |||||||||||||||||||||||||||||||||||||||||
| Feedback Forum | |||||||||||||||||||||||||||||||||||||||||
Post a new message | |||||||||||||||||||||||||||||||||||||||||
Dataset | |||||||||||||||||||||||||||||||||||||||||
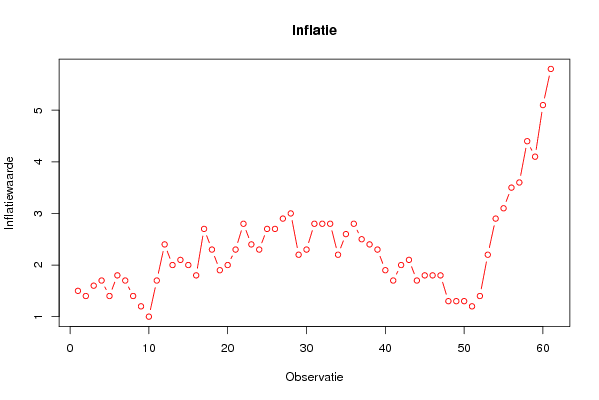
| Dataseries X: | |||||||||||||||||||||||||||||||||||||||||
1.5 1.4 1.6 1.7 1.4 1.8 1.7 1.4 1.2 1 1.7 2.4 2 2.1 2 1.8 2.7 2.3 1.9 2 2.3 2.8 2.4 2.3 2.7 2.7 2.9 3 2.2 2.3 2.8 2.8 2.8 2.2 2.6 2.8 2.5 2.4 2.3 1.9 1.7 2 2.1 1.7 1.8 1.8 1.8 1.3 1.3 1.3 1.2 1.4 2.2 2.9 3.1 3.5 3.6 4.4 4.1 5.1 5.8 | |||||||||||||||||||||||||||||||||||||||||
Tables (Output of Computation) | |||||||||||||||||||||||||||||||||||||||||
| |||||||||||||||||||||||||||||||||||||||||
Figures (Output of Computation) | |||||||||||||||||||||||||||||||||||||||||
Input Parameters & R Code | |||||||||||||||||||||||||||||||||||||||||
| Parameters (Session): | |||||||||||||||||||||||||||||||||||||||||
| par1 = Inflatie ; par2 = http://www.nbb.be/belgostat/PresentationLinker?TableId=607000039&Lang=N ; par3 = Geharmonisserde consumptieprijsindex (veranderingspercentages t.o.v. de overeenstemmende periode van het voorgaande jaar) ~ inflatie ; | |||||||||||||||||||||||||||||||||||||||||
| Parameters (R input): | |||||||||||||||||||||||||||||||||||||||||
| par1 = Inflatie ; par2 = http://www.nbb.be/belgostat/PresentationLinker?TableId=607000039&Lang=N ; par3 = Geharmonisserde consumptieprijsindex (veranderingspercentages t.o.v. de overeenstemmende periode van het voorgaande jaar) ~ inflatie ; | |||||||||||||||||||||||||||||||||||||||||
| R code (references can be found in the software module): | |||||||||||||||||||||||||||||||||||||||||
bitmap(file='test1.png') | |||||||||||||||||||||||||||||||||||||||||