Free Statistics

of Irreproducible Research!

Author's title

Author*The author of this computation has been verified*
R Software Modulerwasp_multipleregression.wasp
Title produced by softwareMultiple Regression
Date of computationFri, 18 Dec 2009 10:09:32 -0700
Cite this page as followsStatistical Computations at FreeStatistics.org, Office for Research Development and Education, URL https://freestatistics.org/blog/index.php?v=date/2009/Dec/18/t1261156382a7axw5tg41lzq41.htm/, Retrieved Sat, 27 Apr 2024 08:58:03 +0000
Statistical Computations at FreeStatistics.org, Office for Research Development and Education, URL https://freestatistics.org/blog/index.php?pk=69433, Retrieved Sat, 27 Apr 2024 08:58:03 +0000
QR Codes:

Original text written by user:
IsPrivate?No (this computation is public)
User-defined keywords
Estimated Impact117
Family? (F = Feedback message, R = changed R code, M = changed R Module, P = changed Parameters, D = changed Data)
-     [Multiple Regression] [Q1 The Seatbeltlaw] [2007-11-14 19:27:43] [8cd6641b921d30ebe00b648d1481bba0]
- RMPD  [Multiple Regression] [Seatbelt] [2009-11-12 14:03:14] [b98453cac15ba1066b407e146608df68]
-    D    [Multiple Regression] [WS7] [2009-11-20 16:30:09] [5c968c05ca472afa314d272082b56b09]
-    D        [Multiple Regression] [Multiple Regressi...] [2009-12-18 17:09:32] [91df150cd527c563f0151b3a845ecd72] [Current]
Feedback Forum

Post a new message
Dataseries X:
113	14,3
110	14,2
107	15,9
103	15,3
98	15,5
98	15,1
137	15
148	12,1
147	15,8
139	16,9
130	15,1
128	13,7
127	14,8
123	14,7
118	16
114	15,4
108	15
111	15,5
151	15,1
159	11,7
158	16,3
148	16,7
138	15
137	14,9
136	14,6
133	15,3
126	17,9
120	16,4
114	15,4
116	17,9
153	15,9
162	13,9
161	17,8
149	17,9
139	17,4
135	16,7
130	16
127	16,6
122	19,1
117	17,8
112	17,2
113	18,6
149	16,3
157	15,1
157	19,2
147	17,7
137	19,1
132	18
125	17,5
123	17,8
117	21,1
114	17,2
111	19,4
112	19,8
144	17,6
150	16,2
149	19,5
134	19,9
123	20
116	17,3


Summary of computational transaction
Raw Inputview raw input (R code)
Raw Outputview raw output of R engine
Computing time4 seconds
R Server'Gwilym Jenkins' @ 72.249.127.135

\begin{tabular}{lllllllll}
\hline
Summary of computational transaction \tabularnewline
Raw Input & view raw input (R code)  \tabularnewline
Raw Output & view raw output of R engine  \tabularnewline
Computing time & 4 seconds \tabularnewline
R Server & 'Gwilym Jenkins' @ 72.249.127.135 \tabularnewline
\hline
\end{tabular}
%Source: https://freestatistics.org/blog/index.php?pk=69433&T=0

[TABLE]
[ROW][C]Summary of computational transaction[/C][/ROW]
[ROW][C]Raw Input[/C][C]view raw input (R code) [/C][/ROW]
[ROW][C]Raw Output[/C][C]view raw output of R engine [/C][/ROW]
[ROW][C]Computing time[/C][C]4 seconds[/C][/ROW]
[ROW][C]R Server[/C][C]'Gwilym Jenkins' @ 72.249.127.135[/C][/ROW]
[/TABLE]
Source: https://freestatistics.org/blog/index.php?pk=69433&T=0

Globally Unique Identifier (entire table): ba.freestatistics.org/blog/index.php?pk=69433&T=0

As an alternative you can also use a QR Code:  

The GUIDs for individual cells are displayed in the table below:

Summary of computational transaction
Raw Inputview raw input (R code)
Raw Outputview raw output of R engine
Computing time4 seconds
R Server'Gwilym Jenkins' @ 72.249.127.135


Multiple Linear Regression - Estimated Regression Equation
WK<25j[t] = + 122.790035587189 + 0.422454368040411ExpBE[t] -3.11273102973248M1[t] -6.23101825278383M2[t] -12.3942142119160M3[t] -16.1267363104121M4[t] -21.1605326598553M5[t] -20.1322925037309M6[t] + 17.2591436115257M7[t] + 26.5800941338538M8[t] + 24.1240730111353M9[t] + 13.0818275743313M10[t] + 3.29305475835152M11[t] + e[t]

\begin{tabular}{lllllllll}
\hline
Multiple Linear Regression - Estimated Regression Equation \tabularnewline
WK<25j[t] =  +  122.790035587189 +  0.422454368040411ExpBE[t] -3.11273102973248M1[t] -6.23101825278383M2[t] -12.3942142119160M3[t] -16.1267363104121M4[t] -21.1605326598553M5[t] -20.1322925037309M6[t] +  17.2591436115257M7[t] +  26.5800941338538M8[t] +  24.1240730111353M9[t] +  13.0818275743313M10[t] +  3.29305475835152M11[t]  + e[t] \tabularnewline
\hline
\end{tabular}
%Source: https://freestatistics.org/blog/index.php?pk=69433&T=1

[TABLE]
[ROW][C]Multiple Linear Regression - Estimated Regression Equation[/C][/ROW]
[ROW][C]WK<25j[t] =  +  122.790035587189 +  0.422454368040411ExpBE[t] -3.11273102973248M1[t] -6.23101825278383M2[t] -12.3942142119160M3[t] -16.1267363104121M4[t] -21.1605326598553M5[t] -20.1322925037309M6[t] +  17.2591436115257M7[t] +  26.5800941338538M8[t] +  24.1240730111353M9[t] +  13.0818275743313M10[t] +  3.29305475835152M11[t]  + e[t][/C][/ROW]
[/TABLE]
Source: https://freestatistics.org/blog/index.php?pk=69433&T=1

Globally Unique Identifier (entire table): ba.freestatistics.org/blog/index.php?pk=69433&T=1

As an alternative you can also use a QR Code:  

The GUIDs for individual cells are displayed in the table below:

Multiple Linear Regression - Estimated Regression Equation
WK<25j[t] = + 122.790035587189 + 0.422454368040411ExpBE[t] -3.11273102973248M1[t] -6.23101825278383M2[t] -12.3942142119160M3[t] -16.1267363104121M4[t] -21.1605326598553M5[t] -20.1322925037309M6[t] + 17.2591436115257M7[t] + 26.5800941338538M8[t] + 24.1240730111353M9[t] + 13.0818275743313M10[t] + 3.29305475835152M11[t] + e[t]


Multiple Linear Regression - Ordinary Least Squares
VariableParameterS.D.T-STATH0: parameter = 02-tail p-value1-tail p-value
(Intercept)122.79003558718910.17601112.066600
ExpBE0.4224543680404110.5999090.70420.4847840.242392
M1-3.112731029732484.497829-0.69210.492310.246155
M2-6.231018252783834.485714-1.38910.1713550.085678
M3-12.39421421191604.619096-2.68330.0100340.005017
M4-16.12673631041214.482905-3.59740.000770.000385
M5-21.16053265985534.485088-4.7182.2e-051.1e-05
M6-20.13229250373094.542622-4.43195.6e-052.8e-05
M717.25914361152574.4800793.85240.0003530.000177
M826.58009413385384.6905365.66681e-060
M924.12407301113534.5809795.26613e-062e-06
M1013.08182757433134.5939242.84760.0065130.003256
M113.293054758351524.5367710.72590.4715250.235762

\begin{tabular}{lllllllll}
\hline
Multiple Linear Regression - Ordinary Least Squares \tabularnewline
Variable & Parameter & S.D. & T-STATH0: parameter = 0 & 2-tail p-value & 1-tail p-value \tabularnewline
(Intercept) & 122.790035587189 & 10.176011 & 12.0666 & 0 & 0 \tabularnewline
ExpBE & 0.422454368040411 & 0.599909 & 0.7042 & 0.484784 & 0.242392 \tabularnewline
M1 & -3.11273102973248 & 4.497829 & -0.6921 & 0.49231 & 0.246155 \tabularnewline
M2 & -6.23101825278383 & 4.485714 & -1.3891 & 0.171355 & 0.085678 \tabularnewline
M3 & -12.3942142119160 & 4.619096 & -2.6833 & 0.010034 & 0.005017 \tabularnewline
M4 & -16.1267363104121 & 4.482905 & -3.5974 & 0.00077 & 0.000385 \tabularnewline
M5 & -21.1605326598553 & 4.485088 & -4.718 & 2.2e-05 & 1.1e-05 \tabularnewline
M6 & -20.1322925037309 & 4.542622 & -4.4319 & 5.6e-05 & 2.8e-05 \tabularnewline
M7 & 17.2591436115257 & 4.480079 & 3.8524 & 0.000353 & 0.000177 \tabularnewline
M8 & 26.5800941338538 & 4.690536 & 5.6668 & 1e-06 & 0 \tabularnewline
M9 & 24.1240730111353 & 4.580979 & 5.2661 & 3e-06 & 2e-06 \tabularnewline
M10 & 13.0818275743313 & 4.593924 & 2.8476 & 0.006513 & 0.003256 \tabularnewline
M11 & 3.29305475835152 & 4.536771 & 0.7259 & 0.471525 & 0.235762 \tabularnewline
\hline
\end{tabular}
%Source: https://freestatistics.org/blog/index.php?pk=69433&T=2

[TABLE]
[ROW][C]Multiple Linear Regression - Ordinary Least Squares[/C][/ROW]
[ROW][C]Variable[/C][C]Parameter[/C][C]S.D.[/C][C]T-STATH0: parameter = 0[/C][C]2-tail p-value[/C][C]1-tail p-value[/C][/ROW]
[ROW][C](Intercept)[/C][C]122.790035587189[/C][C]10.176011[/C][C]12.0666[/C][C]0[/C][C]0[/C][/ROW]
[ROW][C]ExpBE[/C][C]0.422454368040411[/C][C]0.599909[/C][C]0.7042[/C][C]0.484784[/C][C]0.242392[/C][/ROW]
[ROW][C]M1[/C][C]-3.11273102973248[/C][C]4.497829[/C][C]-0.6921[/C][C]0.49231[/C][C]0.246155[/C][/ROW]
[ROW][C]M2[/C][C]-6.23101825278383[/C][C]4.485714[/C][C]-1.3891[/C][C]0.171355[/C][C]0.085678[/C][/ROW]
[ROW][C]M3[/C][C]-12.3942142119160[/C][C]4.619096[/C][C]-2.6833[/C][C]0.010034[/C][C]0.005017[/C][/ROW]
[ROW][C]M4[/C][C]-16.1267363104121[/C][C]4.482905[/C][C]-3.5974[/C][C]0.00077[/C][C]0.000385[/C][/ROW]
[ROW][C]M5[/C][C]-21.1605326598553[/C][C]4.485088[/C][C]-4.718[/C][C]2.2e-05[/C][C]1.1e-05[/C][/ROW]
[ROW][C]M6[/C][C]-20.1322925037309[/C][C]4.542622[/C][C]-4.4319[/C][C]5.6e-05[/C][C]2.8e-05[/C][/ROW]
[ROW][C]M7[/C][C]17.2591436115257[/C][C]4.480079[/C][C]3.8524[/C][C]0.000353[/C][C]0.000177[/C][/ROW]
[ROW][C]M8[/C][C]26.5800941338538[/C][C]4.690536[/C][C]5.6668[/C][C]1e-06[/C][C]0[/C][/ROW]
[ROW][C]M9[/C][C]24.1240730111353[/C][C]4.580979[/C][C]5.2661[/C][C]3e-06[/C][C]2e-06[/C][/ROW]
[ROW][C]M10[/C][C]13.0818275743313[/C][C]4.593924[/C][C]2.8476[/C][C]0.006513[/C][C]0.003256[/C][/ROW]
[ROW][C]M11[/C][C]3.29305475835152[/C][C]4.536771[/C][C]0.7259[/C][C]0.471525[/C][C]0.235762[/C][/ROW]
[/TABLE]
Source: https://freestatistics.org/blog/index.php?pk=69433&T=2

Globally Unique Identifier (entire table): ba.freestatistics.org/blog/index.php?pk=69433&T=2

As an alternative you can also use a QR Code:  

The GUIDs for individual cells are displayed in the table below:

Multiple Linear Regression - Ordinary Least Squares
VariableParameterS.D.T-STATH0: parameter = 02-tail p-value1-tail p-value
(Intercept)122.79003558718910.17601112.066600
ExpBE0.4224543680404110.5999090.70420.4847840.242392
M1-3.112731029732484.497829-0.69210.492310.246155
M2-6.231018252783834.485714-1.38910.1713550.085678
M3-12.39421421191604.619096-2.68330.0100340.005017
M4-16.12673631041214.482905-3.59740.000770.000385
M5-21.16053265985534.485088-4.7182.2e-051.1e-05
M6-20.13229250373094.542622-4.43195.6e-052.8e-05
M717.25914361152574.4800793.85240.0003530.000177
M826.58009413385384.6905365.66681e-060
M924.12407301113534.5809795.26613e-062e-06
M1013.08182757433134.5939242.84760.0065130.003256
M113.293054758351524.5367710.72590.4715250.235762


Multiple Linear Regression - Regression Statistics
Multiple R0.930444080910634
R-squared0.865726187701635
Adjusted R-squared0.831443512221201
F-TEST (value)25.2525853239119
F-TEST (DF numerator)12
F-TEST (DF denominator)47
p-value2.22044604925031e-16
Multiple Linear Regression - Residual Statistics
Residual Standard Deviation7.08238132631051
Sum Squared Residuals2357.52588680978

\begin{tabular}{lllllllll}
\hline
Multiple Linear Regression - Regression Statistics \tabularnewline
Multiple R & 0.930444080910634 \tabularnewline
R-squared & 0.865726187701635 \tabularnewline
Adjusted R-squared & 0.831443512221201 \tabularnewline
F-TEST (value) & 25.2525853239119 \tabularnewline
F-TEST (DF numerator) & 12 \tabularnewline
F-TEST (DF denominator) & 47 \tabularnewline
p-value & 2.22044604925031e-16 \tabularnewline
Multiple Linear Regression - Residual Statistics \tabularnewline
Residual Standard Deviation & 7.08238132631051 \tabularnewline
Sum Squared Residuals & 2357.52588680978 \tabularnewline
\hline
\end{tabular}
%Source: https://freestatistics.org/blog/index.php?pk=69433&T=3

[TABLE]
[ROW][C]Multiple Linear Regression - Regression Statistics[/C][/ROW]
[ROW][C]Multiple R[/C][C]0.930444080910634[/C][/ROW]
[ROW][C]R-squared[/C][C]0.865726187701635[/C][/ROW]
[ROW][C]Adjusted R-squared[/C][C]0.831443512221201[/C][/ROW]
[ROW][C]F-TEST (value)[/C][C]25.2525853239119[/C][/ROW]
[ROW][C]F-TEST (DF numerator)[/C][C]12[/C][/ROW]
[ROW][C]F-TEST (DF denominator)[/C][C]47[/C][/ROW]
[ROW][C]p-value[/C][C]2.22044604925031e-16[/C][/ROW]
[ROW][C]Multiple Linear Regression - Residual Statistics[/C][/ROW]
[ROW][C]Residual Standard Deviation[/C][C]7.08238132631051[/C][/ROW]
[ROW][C]Sum Squared Residuals[/C][C]2357.52588680978[/C][/ROW]
[/TABLE]
Source: https://freestatistics.org/blog/index.php?pk=69433&T=3

Globally Unique Identifier (entire table): ba.freestatistics.org/blog/index.php?pk=69433&T=3

As an alternative you can also use a QR Code:  

The GUIDs for individual cells are displayed in the table below:

Multiple Linear Regression - Regression Statistics
Multiple R0.930444080910634
R-squared0.865726187701635
Adjusted R-squared0.831443512221201
F-TEST (value)25.2525853239119
F-TEST (DF numerator)12
F-TEST (DF denominator)47
p-value2.22044604925031e-16
Multiple Linear Regression - Residual Statistics
Residual Standard Deviation7.08238132631051
Sum Squared Residuals2357.52588680978


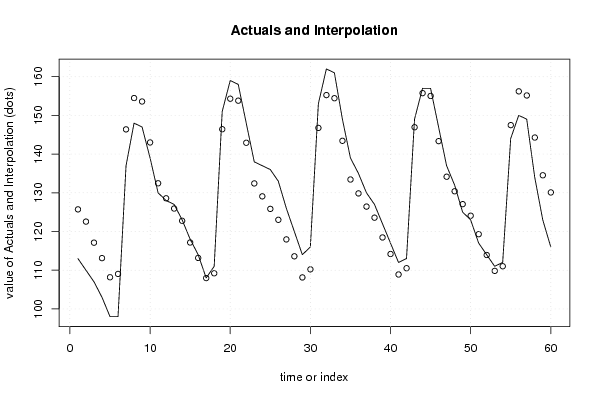
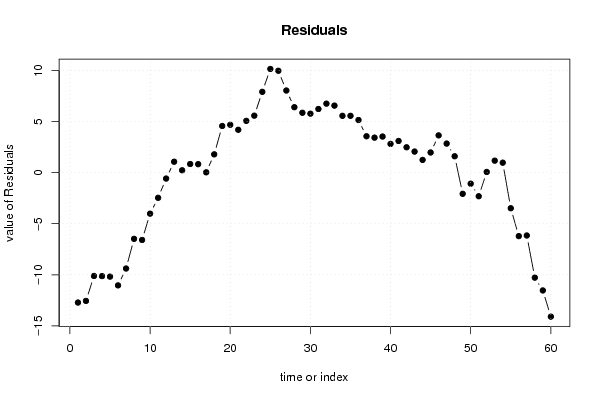
Multiple Linear Regression - Actuals, Interpolation, and Residuals
Time or IndexActualsInterpolationForecastResidualsPrediction Error
1113125.718402020434-12.7184020204338
2110122.557869360579-12.5578693605786
3107117.112845827115-10.1128458271151
4103113.126851107795-10.1268511077947
598108.177545631960-10.1775456319596
698109.036804040868-11.0368040408679
7137146.385994719320-9.38599471932042
8148154.481827574331-6.48182757433128
9147153.588887613362-6.58888761336242
10139143.011341981403-4.01134198140281
11130132.462151302950-2.46215130295027
12128128.577660429342-0.577660429342202
13127125.9296292044541.07037079554582
14123122.7690965445990.230903455401219
15118117.1550912639190.84490873608082
16114113.1690965445990.830903455401216
17108107.9663184479390.0336815520606157
18111109.2057857880841.79421421191598
19151146.4282401561244.57175984387558
20159154.3128458271154.68715417288485
21158153.8001147973834.19988520261738
22148142.9268511077955.07314889220525
23138132.4199058661465.58009413385374
24137129.0846056709917.91539432900931
25136125.84513833084610.1548616691539
26133123.0225691654239.97743083457697
27126117.9577545631968.04224543680404
28120113.5915509126396.40844908736081
29114108.1353001951565.86469980484445
30116110.2196762713815.78032372861898
31153146.7662036505576.23379634944324
32162155.2422454368046.75775456319595
33161154.4337963494436.56620365055677
34149143.4337963494435.56620365055676
35139133.4337963494435.56620365055676
36135129.8450235334635.15497646653657
37130126.4365744461033.56342555389733
38127123.5717598438763.42824015612443
39122118.4646998048443.53530019515554
40117114.1829870278962.81701297210423
41112108.8957180576283.10428194237171
42113110.5153943290092.4846056709907
43149146.9351853977732.06481460222707
44157155.7491906784531.25080932154746
45157155.0252324647001.97476753530019
46147143.3493054758353.65069452416485
47137134.1519687751122.84803122488806
48132130.3942142119161.60578578808403
49125127.070255998163-2.07025599816329
50123124.078705085524-1.07870508552406
51117119.309608540925-2.30960854092527
52114113.9295144070720.0704855929284804
53111109.8251176673171.17488233268281
54112111.0223395706580.9776604293422
55144147.484376076225-3.48437607622546
56150156.213890483297-6.21389048329699
57149155.151968775112-6.15196877511193
58134144.278705085524-10.2787050855241
59123134.532177706348-11.5321777063483
60116130.098496154288-14.0984961542877

\begin{tabular}{lllllllll}
\hline
Multiple Linear Regression - Actuals, Interpolation, and Residuals \tabularnewline
Time or Index & Actuals & InterpolationForecast & ResidualsPrediction Error \tabularnewline
1 & 113 & 125.718402020434 & -12.7184020204338 \tabularnewline
2 & 110 & 122.557869360579 & -12.5578693605786 \tabularnewline
3 & 107 & 117.112845827115 & -10.1128458271151 \tabularnewline
4 & 103 & 113.126851107795 & -10.1268511077947 \tabularnewline
5 & 98 & 108.177545631960 & -10.1775456319596 \tabularnewline
6 & 98 & 109.036804040868 & -11.0368040408679 \tabularnewline
7 & 137 & 146.385994719320 & -9.38599471932042 \tabularnewline
8 & 148 & 154.481827574331 & -6.48182757433128 \tabularnewline
9 & 147 & 153.588887613362 & -6.58888761336242 \tabularnewline
10 & 139 & 143.011341981403 & -4.01134198140281 \tabularnewline
11 & 130 & 132.462151302950 & -2.46215130295027 \tabularnewline
12 & 128 & 128.577660429342 & -0.577660429342202 \tabularnewline
13 & 127 & 125.929629204454 & 1.07037079554582 \tabularnewline
14 & 123 & 122.769096544599 & 0.230903455401219 \tabularnewline
15 & 118 & 117.155091263919 & 0.84490873608082 \tabularnewline
16 & 114 & 113.169096544599 & 0.830903455401216 \tabularnewline
17 & 108 & 107.966318447939 & 0.0336815520606157 \tabularnewline
18 & 111 & 109.205785788084 & 1.79421421191598 \tabularnewline
19 & 151 & 146.428240156124 & 4.57175984387558 \tabularnewline
20 & 159 & 154.312845827115 & 4.68715417288485 \tabularnewline
21 & 158 & 153.800114797383 & 4.19988520261738 \tabularnewline
22 & 148 & 142.926851107795 & 5.07314889220525 \tabularnewline
23 & 138 & 132.419905866146 & 5.58009413385374 \tabularnewline
24 & 137 & 129.084605670991 & 7.91539432900931 \tabularnewline
25 & 136 & 125.845138330846 & 10.1548616691539 \tabularnewline
26 & 133 & 123.022569165423 & 9.97743083457697 \tabularnewline
27 & 126 & 117.957754563196 & 8.04224543680404 \tabularnewline
28 & 120 & 113.591550912639 & 6.40844908736081 \tabularnewline
29 & 114 & 108.135300195156 & 5.86469980484445 \tabularnewline
30 & 116 & 110.219676271381 & 5.78032372861898 \tabularnewline
31 & 153 & 146.766203650557 & 6.23379634944324 \tabularnewline
32 & 162 & 155.242245436804 & 6.75775456319595 \tabularnewline
33 & 161 & 154.433796349443 & 6.56620365055677 \tabularnewline
34 & 149 & 143.433796349443 & 5.56620365055676 \tabularnewline
35 & 139 & 133.433796349443 & 5.56620365055676 \tabularnewline
36 & 135 & 129.845023533463 & 5.15497646653657 \tabularnewline
37 & 130 & 126.436574446103 & 3.56342555389733 \tabularnewline
38 & 127 & 123.571759843876 & 3.42824015612443 \tabularnewline
39 & 122 & 118.464699804844 & 3.53530019515554 \tabularnewline
40 & 117 & 114.182987027896 & 2.81701297210423 \tabularnewline
41 & 112 & 108.895718057628 & 3.10428194237171 \tabularnewline
42 & 113 & 110.515394329009 & 2.4846056709907 \tabularnewline
43 & 149 & 146.935185397773 & 2.06481460222707 \tabularnewline
44 & 157 & 155.749190678453 & 1.25080932154746 \tabularnewline
45 & 157 & 155.025232464700 & 1.97476753530019 \tabularnewline
46 & 147 & 143.349305475835 & 3.65069452416485 \tabularnewline
47 & 137 & 134.151968775112 & 2.84803122488806 \tabularnewline
48 & 132 & 130.394214211916 & 1.60578578808403 \tabularnewline
49 & 125 & 127.070255998163 & -2.07025599816329 \tabularnewline
50 & 123 & 124.078705085524 & -1.07870508552406 \tabularnewline
51 & 117 & 119.309608540925 & -2.30960854092527 \tabularnewline
52 & 114 & 113.929514407072 & 0.0704855929284804 \tabularnewline
53 & 111 & 109.825117667317 & 1.17488233268281 \tabularnewline
54 & 112 & 111.022339570658 & 0.9776604293422 \tabularnewline
55 & 144 & 147.484376076225 & -3.48437607622546 \tabularnewline
56 & 150 & 156.213890483297 & -6.21389048329699 \tabularnewline
57 & 149 & 155.151968775112 & -6.15196877511193 \tabularnewline
58 & 134 & 144.278705085524 & -10.2787050855241 \tabularnewline
59 & 123 & 134.532177706348 & -11.5321777063483 \tabularnewline
60 & 116 & 130.098496154288 & -14.0984961542877 \tabularnewline
\hline
\end{tabular}
%Source: https://freestatistics.org/blog/index.php?pk=69433&T=4

[TABLE]
[ROW][C]Multiple Linear Regression - Actuals, Interpolation, and Residuals[/C][/ROW]
[ROW][C]Time or Index[/C][C]Actuals[/C][C]InterpolationForecast[/C][C]ResidualsPrediction Error[/C][/ROW]
[ROW][C]1[/C][C]113[/C][C]125.718402020434[/C][C]-12.7184020204338[/C][/ROW]
[ROW][C]2[/C][C]110[/C][C]122.557869360579[/C][C]-12.5578693605786[/C][/ROW]
[ROW][C]3[/C][C]107[/C][C]117.112845827115[/C][C]-10.1128458271151[/C][/ROW]
[ROW][C]4[/C][C]103[/C][C]113.126851107795[/C][C]-10.1268511077947[/C][/ROW]
[ROW][C]5[/C][C]98[/C][C]108.177545631960[/C][C]-10.1775456319596[/C][/ROW]
[ROW][C]6[/C][C]98[/C][C]109.036804040868[/C][C]-11.0368040408679[/C][/ROW]
[ROW][C]7[/C][C]137[/C][C]146.385994719320[/C][C]-9.38599471932042[/C][/ROW]
[ROW][C]8[/C][C]148[/C][C]154.481827574331[/C][C]-6.48182757433128[/C][/ROW]
[ROW][C]9[/C][C]147[/C][C]153.588887613362[/C][C]-6.58888761336242[/C][/ROW]
[ROW][C]10[/C][C]139[/C][C]143.011341981403[/C][C]-4.01134198140281[/C][/ROW]
[ROW][C]11[/C][C]130[/C][C]132.462151302950[/C][C]-2.46215130295027[/C][/ROW]
[ROW][C]12[/C][C]128[/C][C]128.577660429342[/C][C]-0.577660429342202[/C][/ROW]
[ROW][C]13[/C][C]127[/C][C]125.929629204454[/C][C]1.07037079554582[/C][/ROW]
[ROW][C]14[/C][C]123[/C][C]122.769096544599[/C][C]0.230903455401219[/C][/ROW]
[ROW][C]15[/C][C]118[/C][C]117.155091263919[/C][C]0.84490873608082[/C][/ROW]
[ROW][C]16[/C][C]114[/C][C]113.169096544599[/C][C]0.830903455401216[/C][/ROW]
[ROW][C]17[/C][C]108[/C][C]107.966318447939[/C][C]0.0336815520606157[/C][/ROW]
[ROW][C]18[/C][C]111[/C][C]109.205785788084[/C][C]1.79421421191598[/C][/ROW]
[ROW][C]19[/C][C]151[/C][C]146.428240156124[/C][C]4.57175984387558[/C][/ROW]
[ROW][C]20[/C][C]159[/C][C]154.312845827115[/C][C]4.68715417288485[/C][/ROW]
[ROW][C]21[/C][C]158[/C][C]153.800114797383[/C][C]4.19988520261738[/C][/ROW]
[ROW][C]22[/C][C]148[/C][C]142.926851107795[/C][C]5.07314889220525[/C][/ROW]
[ROW][C]23[/C][C]138[/C][C]132.419905866146[/C][C]5.58009413385374[/C][/ROW]
[ROW][C]24[/C][C]137[/C][C]129.084605670991[/C][C]7.91539432900931[/C][/ROW]
[ROW][C]25[/C][C]136[/C][C]125.845138330846[/C][C]10.1548616691539[/C][/ROW]
[ROW][C]26[/C][C]133[/C][C]123.022569165423[/C][C]9.97743083457697[/C][/ROW]
[ROW][C]27[/C][C]126[/C][C]117.957754563196[/C][C]8.04224543680404[/C][/ROW]
[ROW][C]28[/C][C]120[/C][C]113.591550912639[/C][C]6.40844908736081[/C][/ROW]
[ROW][C]29[/C][C]114[/C][C]108.135300195156[/C][C]5.86469980484445[/C][/ROW]
[ROW][C]30[/C][C]116[/C][C]110.219676271381[/C][C]5.78032372861898[/C][/ROW]
[ROW][C]31[/C][C]153[/C][C]146.766203650557[/C][C]6.23379634944324[/C][/ROW]
[ROW][C]32[/C][C]162[/C][C]155.242245436804[/C][C]6.75775456319595[/C][/ROW]
[ROW][C]33[/C][C]161[/C][C]154.433796349443[/C][C]6.56620365055677[/C][/ROW]
[ROW][C]34[/C][C]149[/C][C]143.433796349443[/C][C]5.56620365055676[/C][/ROW]
[ROW][C]35[/C][C]139[/C][C]133.433796349443[/C][C]5.56620365055676[/C][/ROW]
[ROW][C]36[/C][C]135[/C][C]129.845023533463[/C][C]5.15497646653657[/C][/ROW]
[ROW][C]37[/C][C]130[/C][C]126.436574446103[/C][C]3.56342555389733[/C][/ROW]
[ROW][C]38[/C][C]127[/C][C]123.571759843876[/C][C]3.42824015612443[/C][/ROW]
[ROW][C]39[/C][C]122[/C][C]118.464699804844[/C][C]3.53530019515554[/C][/ROW]
[ROW][C]40[/C][C]117[/C][C]114.182987027896[/C][C]2.81701297210423[/C][/ROW]
[ROW][C]41[/C][C]112[/C][C]108.895718057628[/C][C]3.10428194237171[/C][/ROW]
[ROW][C]42[/C][C]113[/C][C]110.515394329009[/C][C]2.4846056709907[/C][/ROW]
[ROW][C]43[/C][C]149[/C][C]146.935185397773[/C][C]2.06481460222707[/C][/ROW]
[ROW][C]44[/C][C]157[/C][C]155.749190678453[/C][C]1.25080932154746[/C][/ROW]
[ROW][C]45[/C][C]157[/C][C]155.025232464700[/C][C]1.97476753530019[/C][/ROW]
[ROW][C]46[/C][C]147[/C][C]143.349305475835[/C][C]3.65069452416485[/C][/ROW]
[ROW][C]47[/C][C]137[/C][C]134.151968775112[/C][C]2.84803122488806[/C][/ROW]
[ROW][C]48[/C][C]132[/C][C]130.394214211916[/C][C]1.60578578808403[/C][/ROW]
[ROW][C]49[/C][C]125[/C][C]127.070255998163[/C][C]-2.07025599816329[/C][/ROW]
[ROW][C]50[/C][C]123[/C][C]124.078705085524[/C][C]-1.07870508552406[/C][/ROW]
[ROW][C]51[/C][C]117[/C][C]119.309608540925[/C][C]-2.30960854092527[/C][/ROW]
[ROW][C]52[/C][C]114[/C][C]113.929514407072[/C][C]0.0704855929284804[/C][/ROW]
[ROW][C]53[/C][C]111[/C][C]109.825117667317[/C][C]1.17488233268281[/C][/ROW]
[ROW][C]54[/C][C]112[/C][C]111.022339570658[/C][C]0.9776604293422[/C][/ROW]
[ROW][C]55[/C][C]144[/C][C]147.484376076225[/C][C]-3.48437607622546[/C][/ROW]
[ROW][C]56[/C][C]150[/C][C]156.213890483297[/C][C]-6.21389048329699[/C][/ROW]
[ROW][C]57[/C][C]149[/C][C]155.151968775112[/C][C]-6.15196877511193[/C][/ROW]
[ROW][C]58[/C][C]134[/C][C]144.278705085524[/C][C]-10.2787050855241[/C][/ROW]
[ROW][C]59[/C][C]123[/C][C]134.532177706348[/C][C]-11.5321777063483[/C][/ROW]
[ROW][C]60[/C][C]116[/C][C]130.098496154288[/C][C]-14.0984961542877[/C][/ROW]
[/TABLE]
Source: https://freestatistics.org/blog/index.php?pk=69433&T=4

Globally Unique Identifier (entire table): ba.freestatistics.org/blog/index.php?pk=69433&T=4

As an alternative you can also use a QR Code:  

The GUIDs for individual cells are displayed in the table below:

Multiple Linear Regression - Actuals, Interpolation, and Residuals
Time or IndexActualsInterpolationForecastResidualsPrediction Error
1113125.718402020434-12.7184020204338
2110122.557869360579-12.5578693605786
3107117.112845827115-10.1128458271151
4103113.126851107795-10.1268511077947
598108.177545631960-10.1775456319596
698109.036804040868-11.0368040408679
7137146.385994719320-9.38599471932042
8148154.481827574331-6.48182757433128
9147153.588887613362-6.58888761336242
10139143.011341981403-4.01134198140281
11130132.462151302950-2.46215130295027
12128128.577660429342-0.577660429342202
13127125.9296292044541.07037079554582
14123122.7690965445990.230903455401219
15118117.1550912639190.84490873608082
16114113.1690965445990.830903455401216
17108107.9663184479390.0336815520606157
18111109.2057857880841.79421421191598
19151146.4282401561244.57175984387558
20159154.3128458271154.68715417288485
21158153.8001147973834.19988520261738
22148142.9268511077955.07314889220525
23138132.4199058661465.58009413385374
24137129.0846056709917.91539432900931
25136125.84513833084610.1548616691539
26133123.0225691654239.97743083457697
27126117.9577545631968.04224543680404
28120113.5915509126396.40844908736081
29114108.1353001951565.86469980484445
30116110.2196762713815.78032372861898
31153146.7662036505576.23379634944324
32162155.2422454368046.75775456319595
33161154.4337963494436.56620365055677
34149143.4337963494435.56620365055676
35139133.4337963494435.56620365055676
36135129.8450235334635.15497646653657
37130126.4365744461033.56342555389733
38127123.5717598438763.42824015612443
39122118.4646998048443.53530019515554
40117114.1829870278962.81701297210423
41112108.8957180576283.10428194237171
42113110.5153943290092.4846056709907
43149146.9351853977732.06481460222707
44157155.7491906784531.25080932154746
45157155.0252324647001.97476753530019
46147143.3493054758353.65069452416485
47137134.1519687751122.84803122488806
48132130.3942142119161.60578578808403
49125127.070255998163-2.07025599816329
50123124.078705085524-1.07870508552406
51117119.309608540925-2.30960854092527
52114113.9295144070720.0704855929284804
53111109.8251176673171.17488233268281
54112111.0223395706580.9776604293422
55144147.484376076225-3.48437607622546
56150156.213890483297-6.21389048329699
57149155.151968775112-6.15196877511193
58134144.278705085524-10.2787050855241
59123134.532177706348-11.5321777063483
60116130.098496154288-14.0984961542877


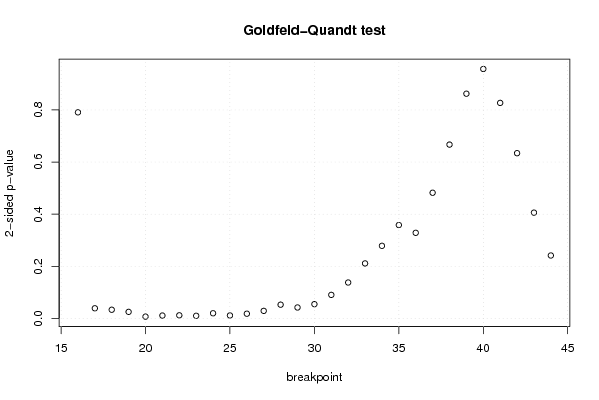
Goldfeld-Quandt test for Heteroskedasticity
p-valuesAlternative Hypothesis
breakpoint indexgreater2-sidedless
160.6046306635034970.7907386729930050.395369336496503
170.9803908306124860.03921833877502780.0196091693875139
180.9831876977205170.03362460455896630.0168123022794831
190.9872364394295760.02552712114084870.0127635605704244
200.9964182457434430.007163508513113340.00358175425655667
210.9943457091201160.01130858175976720.00565429087988358
220.9938463082524140.01230738349517270.00615369174758633
230.994784458561060.01043108287787820.00521554143893911
240.9899069213483780.02018615730324440.0100930786516222
250.9941165288387140.01176694232257190.00588347116128594
260.990785096232360.01842980753528060.0092149037676403
270.985308525763270.02938294847346060.0146914742367303
280.9734685913831750.05306281723364930.0265314086168247
290.9788227243762060.04235455124758850.0211772756237942
300.9724790154464520.0550419691070970.0275209845535485
310.9546687334957380.0906625330085230.0453312665042615
320.9309564191541220.1380871616917560.0690435808458781
330.8943250962032690.2113498075934620.105674903796731
340.8606162398181760.2787675203636480.139383760181824
350.8207466803624640.3585066392750730.179253319637536
360.8356600674673840.3286798650652330.164339932532616
370.7588094200945470.4823811598109070.241190579905453
380.6665110279828460.6669779440343090.333488972017154
390.568902003598420.8621959928031610.431097996401581
400.4785613337589910.9571226675179810.521438666241009
410.413471307829550.82694261565910.58652869217045
420.3170274572294940.6340549144589870.682972542770506
430.2030035628496610.4060071256993230.796996437150339
440.1208698367851230.2417396735702460.879130163214877

\begin{tabular}{lllllllll}
\hline
Goldfeld-Quandt test for Heteroskedasticity \tabularnewline
p-values & Alternative Hypothesis \tabularnewline
breakpoint index & greater & 2-sided & less \tabularnewline
16 & 0.604630663503497 & 0.790738672993005 & 0.395369336496503 \tabularnewline
17 & 0.980390830612486 & 0.0392183387750278 & 0.0196091693875139 \tabularnewline
18 & 0.983187697720517 & 0.0336246045589663 & 0.0168123022794831 \tabularnewline
19 & 0.987236439429576 & 0.0255271211408487 & 0.0127635605704244 \tabularnewline
20 & 0.996418245743443 & 0.00716350851311334 & 0.00358175425655667 \tabularnewline
21 & 0.994345709120116 & 0.0113085817597672 & 0.00565429087988358 \tabularnewline
22 & 0.993846308252414 & 0.0123073834951727 & 0.00615369174758633 \tabularnewline
23 & 0.99478445856106 & 0.0104310828778782 & 0.00521554143893911 \tabularnewline
24 & 0.989906921348378 & 0.0201861573032444 & 0.0100930786516222 \tabularnewline
25 & 0.994116528838714 & 0.0117669423225719 & 0.00588347116128594 \tabularnewline
26 & 0.99078509623236 & 0.0184298075352806 & 0.0092149037676403 \tabularnewline
27 & 0.98530852576327 & 0.0293829484734606 & 0.0146914742367303 \tabularnewline
28 & 0.973468591383175 & 0.0530628172336493 & 0.0265314086168247 \tabularnewline
29 & 0.978822724376206 & 0.0423545512475885 & 0.0211772756237942 \tabularnewline
30 & 0.972479015446452 & 0.055041969107097 & 0.0275209845535485 \tabularnewline
31 & 0.954668733495738 & 0.090662533008523 & 0.0453312665042615 \tabularnewline
32 & 0.930956419154122 & 0.138087161691756 & 0.0690435808458781 \tabularnewline
33 & 0.894325096203269 & 0.211349807593462 & 0.105674903796731 \tabularnewline
34 & 0.860616239818176 & 0.278767520363648 & 0.139383760181824 \tabularnewline
35 & 0.820746680362464 & 0.358506639275073 & 0.179253319637536 \tabularnewline
36 & 0.835660067467384 & 0.328679865065233 & 0.164339932532616 \tabularnewline
37 & 0.758809420094547 & 0.482381159810907 & 0.241190579905453 \tabularnewline
38 & 0.666511027982846 & 0.666977944034309 & 0.333488972017154 \tabularnewline
39 & 0.56890200359842 & 0.862195992803161 & 0.431097996401581 \tabularnewline
40 & 0.478561333758991 & 0.957122667517981 & 0.521438666241009 \tabularnewline
41 & 0.41347130782955 & 0.8269426156591 & 0.58652869217045 \tabularnewline
42 & 0.317027457229494 & 0.634054914458987 & 0.682972542770506 \tabularnewline
43 & 0.203003562849661 & 0.406007125699323 & 0.796996437150339 \tabularnewline
44 & 0.120869836785123 & 0.241739673570246 & 0.879130163214877 \tabularnewline
\hline
\end{tabular}
%Source: https://freestatistics.org/blog/index.php?pk=69433&T=5

[TABLE]
[ROW][C]Goldfeld-Quandt test for Heteroskedasticity[/C][/ROW]
[ROW][C]p-values[/C][C]Alternative Hypothesis[/C][/ROW]
[ROW][C]breakpoint index[/C][C]greater[/C][C]2-sided[/C][C]less[/C][/ROW]
[ROW][C]16[/C][C]0.604630663503497[/C][C]0.790738672993005[/C][C]0.395369336496503[/C][/ROW]
[ROW][C]17[/C][C]0.980390830612486[/C][C]0.0392183387750278[/C][C]0.0196091693875139[/C][/ROW]
[ROW][C]18[/C][C]0.983187697720517[/C][C]0.0336246045589663[/C][C]0.0168123022794831[/C][/ROW]
[ROW][C]19[/C][C]0.987236439429576[/C][C]0.0255271211408487[/C][C]0.0127635605704244[/C][/ROW]
[ROW][C]20[/C][C]0.996418245743443[/C][C]0.00716350851311334[/C][C]0.00358175425655667[/C][/ROW]
[ROW][C]21[/C][C]0.994345709120116[/C][C]0.0113085817597672[/C][C]0.00565429087988358[/C][/ROW]
[ROW][C]22[/C][C]0.993846308252414[/C][C]0.0123073834951727[/C][C]0.00615369174758633[/C][/ROW]
[ROW][C]23[/C][C]0.99478445856106[/C][C]0.0104310828778782[/C][C]0.00521554143893911[/C][/ROW]
[ROW][C]24[/C][C]0.989906921348378[/C][C]0.0201861573032444[/C][C]0.0100930786516222[/C][/ROW]
[ROW][C]25[/C][C]0.994116528838714[/C][C]0.0117669423225719[/C][C]0.00588347116128594[/C][/ROW]
[ROW][C]26[/C][C]0.99078509623236[/C][C]0.0184298075352806[/C][C]0.0092149037676403[/C][/ROW]
[ROW][C]27[/C][C]0.98530852576327[/C][C]0.0293829484734606[/C][C]0.0146914742367303[/C][/ROW]
[ROW][C]28[/C][C]0.973468591383175[/C][C]0.0530628172336493[/C][C]0.0265314086168247[/C][/ROW]
[ROW][C]29[/C][C]0.978822724376206[/C][C]0.0423545512475885[/C][C]0.0211772756237942[/C][/ROW]
[ROW][C]30[/C][C]0.972479015446452[/C][C]0.055041969107097[/C][C]0.0275209845535485[/C][/ROW]
[ROW][C]31[/C][C]0.954668733495738[/C][C]0.090662533008523[/C][C]0.0453312665042615[/C][/ROW]
[ROW][C]32[/C][C]0.930956419154122[/C][C]0.138087161691756[/C][C]0.0690435808458781[/C][/ROW]
[ROW][C]33[/C][C]0.894325096203269[/C][C]0.211349807593462[/C][C]0.105674903796731[/C][/ROW]
[ROW][C]34[/C][C]0.860616239818176[/C][C]0.278767520363648[/C][C]0.139383760181824[/C][/ROW]
[ROW][C]35[/C][C]0.820746680362464[/C][C]0.358506639275073[/C][C]0.179253319637536[/C][/ROW]
[ROW][C]36[/C][C]0.835660067467384[/C][C]0.328679865065233[/C][C]0.164339932532616[/C][/ROW]
[ROW][C]37[/C][C]0.758809420094547[/C][C]0.482381159810907[/C][C]0.241190579905453[/C][/ROW]
[ROW][C]38[/C][C]0.666511027982846[/C][C]0.666977944034309[/C][C]0.333488972017154[/C][/ROW]
[ROW][C]39[/C][C]0.56890200359842[/C][C]0.862195992803161[/C][C]0.431097996401581[/C][/ROW]
[ROW][C]40[/C][C]0.478561333758991[/C][C]0.957122667517981[/C][C]0.521438666241009[/C][/ROW]
[ROW][C]41[/C][C]0.41347130782955[/C][C]0.8269426156591[/C][C]0.58652869217045[/C][/ROW]
[ROW][C]42[/C][C]0.317027457229494[/C][C]0.634054914458987[/C][C]0.682972542770506[/C][/ROW]
[ROW][C]43[/C][C]0.203003562849661[/C][C]0.406007125699323[/C][C]0.796996437150339[/C][/ROW]
[ROW][C]44[/C][C]0.120869836785123[/C][C]0.241739673570246[/C][C]0.879130163214877[/C][/ROW]
[/TABLE]
Source: https://freestatistics.org/blog/index.php?pk=69433&T=5

Globally Unique Identifier (entire table): ba.freestatistics.org/blog/index.php?pk=69433&T=5

As an alternative you can also use a QR Code:  

The GUIDs for individual cells are displayed in the table below:

Goldfeld-Quandt test for Heteroskedasticity
p-valuesAlternative Hypothesis
breakpoint indexgreater2-sidedless
160.6046306635034970.7907386729930050.395369336496503
170.9803908306124860.03921833877502780.0196091693875139
180.9831876977205170.03362460455896630.0168123022794831
190.9872364394295760.02552712114084870.0127635605704244
200.9964182457434430.007163508513113340.00358175425655667
210.9943457091201160.01130858175976720.00565429087988358
220.9938463082524140.01230738349517270.00615369174758633
230.994784458561060.01043108287787820.00521554143893911
240.9899069213483780.02018615730324440.0100930786516222
250.9941165288387140.01176694232257190.00588347116128594
260.990785096232360.01842980753528060.0092149037676403
270.985308525763270.02938294847346060.0146914742367303
280.9734685913831750.05306281723364930.0265314086168247
290.9788227243762060.04235455124758850.0211772756237942
300.9724790154464520.0550419691070970.0275209845535485
310.9546687334957380.0906625330085230.0453312665042615
320.9309564191541220.1380871616917560.0690435808458781
330.8943250962032690.2113498075934620.105674903796731
340.8606162398181760.2787675203636480.139383760181824
350.8207466803624640.3585066392750730.179253319637536
360.8356600674673840.3286798650652330.164339932532616
370.7588094200945470.4823811598109070.241190579905453
380.6665110279828460.6669779440343090.333488972017154
390.568902003598420.8621959928031610.431097996401581
400.4785613337589910.9571226675179810.521438666241009
410.413471307829550.82694261565910.58652869217045
420.3170274572294940.6340549144589870.682972542770506
430.2030035628496610.4060071256993230.796996437150339
440.1208698367851230.2417396735702460.879130163214877


Meta Analysis of Goldfeld-Quandt test for Heteroskedasticity
Description# significant tests% significant testsOK/NOK
1% type I error level10.0344827586206897NOK
5% type I error level120.413793103448276NOK
10% type I error level150.517241379310345NOK

\begin{tabular}{lllllllll}
\hline
Meta Analysis of Goldfeld-Quandt test for Heteroskedasticity \tabularnewline
Description & # significant tests & % significant tests & OK/NOK \tabularnewline
1% type I error level & 1 & 0.0344827586206897 & NOK \tabularnewline
5% type I error level & 12 & 0.413793103448276 & NOK \tabularnewline
10% type I error level & 15 & 0.517241379310345 & NOK \tabularnewline
\hline
\end{tabular}
%Source: https://freestatistics.org/blog/index.php?pk=69433&T=6

[TABLE]
[ROW][C]Meta Analysis of Goldfeld-Quandt test for Heteroskedasticity[/C][/ROW]
[ROW][C]Description[/C][C]# significant tests[/C][C]% significant tests[/C][C]OK/NOK[/C][/ROW]
[ROW][C]1% type I error level[/C][C]1[/C][C]0.0344827586206897[/C][C]NOK[/C][/ROW]
[ROW][C]5% type I error level[/C][C]12[/C][C]0.413793103448276[/C][C]NOK[/C][/ROW]
[ROW][C]10% type I error level[/C][C]15[/C][C]0.517241379310345[/C][C]NOK[/C][/ROW]
[/TABLE]
Source: https://freestatistics.org/blog/index.php?pk=69433&T=6

Globally Unique Identifier (entire table): ba.freestatistics.org/blog/index.php?pk=69433&T=6

As an alternative you can also use a QR Code:  

The GUIDs for individual cells are displayed in the table below:

Meta Analysis of Goldfeld-Quandt test for Heteroskedasticity
Description# significant tests% significant testsOK/NOK
1% type I error level10.0344827586206897NOK
5% type I error level120.413793103448276NOK
10% type I error level150.517241379310345NOK


Parameters (Session):
par1 = 1 ; par2 = Include Monthly Dummies ; par3 = No Linear Trend ;
Parameters (R input):
par1 = 1 ; par2 = Include Monthly Dummies ; par3 = No Linear Trend ;
R code (references can be found in the software module):
library(lattice)
library(lmtest)
n25 <- 25 #minimum number of obs. for Goldfeld-Quandt test
par1 <- as.numeric(par1)
x <- t(y)
k <- length(x[1,])
n <- length(x[,1])
x1 <- cbind(x[,par1], x[,1:k!=par1])
mycolnames <- c(colnames(x)[par1], colnames(x)[1:k!=par1])
colnames(x1) <- mycolnames #colnames(x)[par1]
x <- x1
if (par3 == 'First Differences'){
x2 <- array(0, dim=c(n-1,k), dimnames=list(1:(n-1), paste('(1-B)',colnames(x),sep='')))
for (i in 1:n-1) {
for (j in 1:k) {
x2[i,j] <- x[i+1,j] - x[i,j]
}
}
x <- x2
}
if (par2 == 'Include Monthly Dummies'){
x2 <- array(0, dim=c(n,11), dimnames=list(1:n, paste('M', seq(1:11), sep ='')))
for (i in 1:11){
x2[seq(i,n,12),i] <- 1
}
x <- cbind(x, x2)
}
if (par2 == 'Include Quarterly Dummies'){
x2 <- array(0, dim=c(n,3), dimnames=list(1:n, paste('Q', seq(1:3), sep ='')))
for (i in 1:3){
x2[seq(i,n,4),i] <- 1
}
x <- cbind(x, x2)
}
k <- length(x[1,])
if (par3 == 'Linear Trend'){
x <- cbind(x, c(1:n))
colnames(x)[k+1] <- 't'
}
x
k <- length(x[1,])
df <- as.data.frame(x)
(mylm <- lm(df))
(mysum <- summary(mylm))
if (n > n25) {
kp3 <- k + 3
nmkm3 <- n - k - 3
gqarr <- array(NA, dim=c(nmkm3-kp3+1,3))
numgqtests <- 0
numsignificant1 <- 0
numsignificant5 <- 0
numsignificant10 <- 0
for (mypoint in kp3:nmkm3) {
j <- 0
numgqtests <- numgqtests + 1
for (myalt in c('greater', 'two.sided', 'less')) {
j <- j + 1
gqarr[mypoint-kp3+1,j] <- gqtest(mylm, point=mypoint, alternative=myalt)$p.value
}
if (gqarr[mypoint-kp3+1,2] < 0.01) numsignificant1 <- numsignificant1 + 1
if (gqarr[mypoint-kp3+1,2] < 0.05) numsignificant5 <- numsignificant5 + 1
if (gqarr[mypoint-kp3+1,2] < 0.10) numsignificant10 <- numsignificant10 + 1
}
gqarr
}
bitmap(file='test0.png')
plot(x[,1], type='l', main='Actuals and Interpolation', ylab='value of Actuals and Interpolation (dots)', xlab='time or index')
points(x[,1]-mysum$resid)
grid()
dev.off()
bitmap(file='test1.png')
plot(mysum$resid, type='b', pch=19, main='Residuals', ylab='value of Residuals', xlab='time or index')
grid()
dev.off()
bitmap(file='test2.png')
hist(mysum$resid, main='Residual Histogram', xlab='values of Residuals')
grid()
dev.off()
bitmap(file='test3.png')
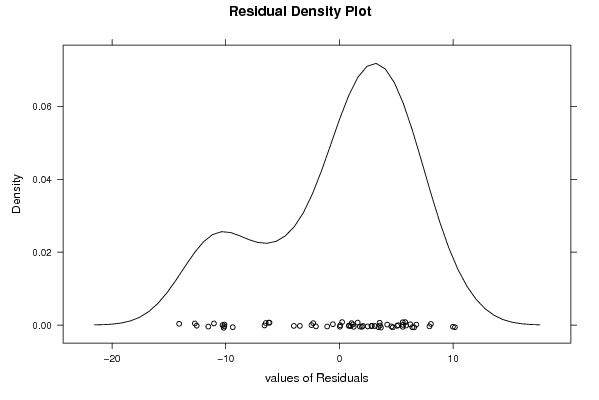
densityplot(~mysum$resid,col='black',main='Residual Density Plot', xlab='values of Residuals')
dev.off()
bitmap(file='test4.png')
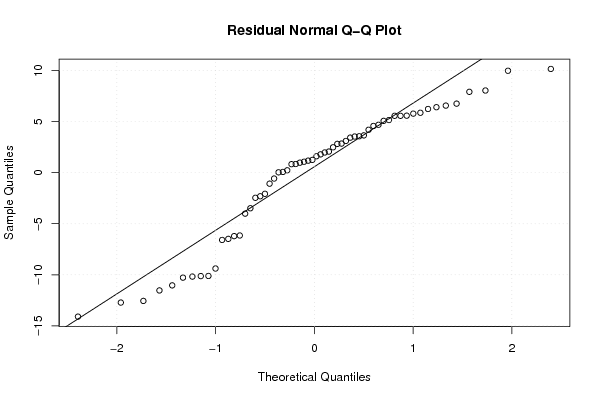
qqnorm(mysum$resid, main='Residual Normal Q-Q Plot')
qqline(mysum$resid)
grid()
dev.off()
(myerror <- as.ts(mysum$resid))
bitmap(file='test5.png')
dum <- cbind(lag(myerror,k=1),myerror)
dum
dum1 <- dum[2:length(myerror),]
dum1
z <- as.data.frame(dum1)
z
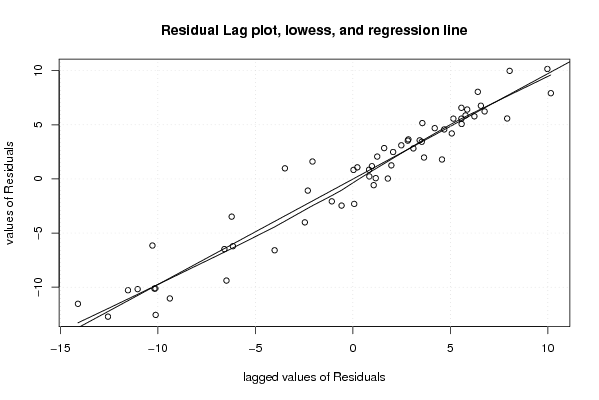
plot(z,main=paste('Residual Lag plot, lowess, and regression line'), ylab='values of Residuals', xlab='lagged values of Residuals')
lines(lowess(z))
abline(lm(z))
grid()
dev.off()
bitmap(file='test6.png')
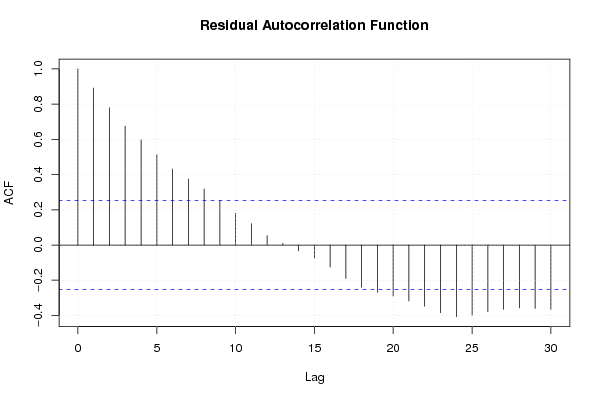
acf(mysum$resid, lag.max=length(mysum$resid)/2, main='Residual Autocorrelation Function')
grid()
dev.off()
bitmap(file='test7.png')
pacf(mysum$resid, lag.max=length(mysum$resid)/2, main='Residual Partial Autocorrelation Function')
grid()
dev.off()
bitmap(file='test8.png')
opar <- par(mfrow = c(2,2), oma = c(0, 0, 1.1, 0))
plot(mylm, las = 1, sub='Residual Diagnostics')
par(opar)
dev.off()
if (n > n25) {
bitmap(file='test9.png')
plot(kp3:nmkm3,gqarr[,2], main='Goldfeld-Quandt test',ylab='2-sided p-value',xlab='breakpoint')
grid()
dev.off()
}
load(file='createtable')
a<-table.start()
a<-table.row.start(a)
a<-table.element(a, 'Multiple Linear Regression - Estimated Regression Equation', 1, TRUE)
a<-table.row.end(a)
myeq <- colnames(x)[1]
myeq <- paste(myeq, '[t] = ', sep='')
for (i in 1:k){
if (mysum$coefficients[i,1] > 0) myeq <- paste(myeq, '+', '')
myeq <- paste(myeq, mysum$coefficients[i,1], sep=' ')
if (rownames(mysum$coefficients)[i] != '(Intercept)') {
myeq <- paste(myeq, rownames(mysum$coefficients)[i], sep='')
if (rownames(mysum$coefficients)[i] != 't') myeq <- paste(myeq, '[t]', sep='')
}
}
myeq <- paste(myeq, ' + e[t]')
a<-table.row.start(a)
a<-table.element(a, myeq)
a<-table.row.end(a)
a<-table.end(a)
table.save(a,file='mytable1.tab')
a<-table.start()
a<-table.row.start(a)
a<-table.element(a,hyperlink('ols1.htm','Multiple Linear Regression - Ordinary Least Squares',''), 6, TRUE)
a<-table.row.end(a)
a<-table.row.start(a)
a<-table.element(a,'Variable',header=TRUE)
a<-table.element(a,'Parameter',header=TRUE)
a<-table.element(a,'S.D.',header=TRUE)
a<-table.element(a,'T-STAT
H0: parameter = 0',header=TRUE)
a<-table.element(a,'2-tail p-value',header=TRUE)
a<-table.element(a,'1-tail p-value',header=TRUE)
a<-table.row.end(a)
for (i in 1:k){
a<-table.row.start(a)
a<-table.element(a,rownames(mysum$coefficients)[i],header=TRUE)
a<-table.element(a,mysum$coefficients[i,1])
a<-table.element(a, round(mysum$coefficients[i,2],6))
a<-table.element(a, round(mysum$coefficients[i,3],4))
a<-table.element(a, round(mysum$coefficients[i,4],6))
a<-table.element(a, round(mysum$coefficients[i,4]/2,6))
a<-table.row.end(a)
}
a<-table.end(a)
table.save(a,file='mytable2.tab')
a<-table.start()
a<-table.row.start(a)
a<-table.element(a, 'Multiple Linear Regression - Regression Statistics', 2, TRUE)
a<-table.row.end(a)
a<-table.row.start(a)
a<-table.element(a, 'Multiple R',1,TRUE)
a<-table.element(a, sqrt(mysum$r.squared))
a<-table.row.end(a)
a<-table.row.start(a)
a<-table.element(a, 'R-squared',1,TRUE)
a<-table.element(a, mysum$r.squared)
a<-table.row.end(a)
a<-table.row.start(a)
a<-table.element(a, 'Adjusted R-squared',1,TRUE)
a<-table.element(a, mysum$adj.r.squared)
a<-table.row.end(a)
a<-table.row.start(a)
a<-table.element(a, 'F-TEST (value)',1,TRUE)
a<-table.element(a, mysum$fstatistic[1])
a<-table.row.end(a)
a<-table.row.start(a)
a<-table.element(a, 'F-TEST (DF numerator)',1,TRUE)
a<-table.element(a, mysum$fstatistic[2])
a<-table.row.end(a)
a<-table.row.start(a)
a<-table.element(a, 'F-TEST (DF denominator)',1,TRUE)
a<-table.element(a, mysum$fstatistic[3])
a<-table.row.end(a)
a<-table.row.start(a)
a<-table.element(a, 'p-value',1,TRUE)
a<-table.element(a, 1-pf(mysum$fstatistic[1],mysum$fstatistic[2],mysum$fstatistic[3]))
a<-table.row.end(a)
a<-table.row.start(a)
a<-table.element(a, 'Multiple Linear Regression - Residual Statistics', 2, TRUE)
a<-table.row.end(a)
a<-table.row.start(a)
a<-table.element(a, 'Residual Standard Deviation',1,TRUE)
a<-table.element(a, mysum$sigma)
a<-table.row.end(a)
a<-table.row.start(a)
a<-table.element(a, 'Sum Squared Residuals',1,TRUE)
a<-table.element(a, sum(myerror*myerror))
a<-table.row.end(a)
a<-table.end(a)
table.save(a,file='mytable3.tab')
a<-table.start()
a<-table.row.start(a)
a<-table.element(a, 'Multiple Linear Regression - Actuals, Interpolation, and Residuals', 4, TRUE)
a<-table.row.end(a)
a<-table.row.start(a)
a<-table.element(a, 'Time or Index', 1, TRUE)
a<-table.element(a, 'Actuals', 1, TRUE)
a<-table.element(a, 'Interpolation
Forecast', 1, TRUE)
a<-table.element(a, 'Residuals
Prediction Error', 1, TRUE)
a<-table.row.end(a)
for (i in 1:n) {
a<-table.row.start(a)
a<-table.element(a,i, 1, TRUE)
a<-table.element(a,x[i])
a<-table.element(a,x[i]-mysum$resid[i])
a<-table.element(a,mysum$resid[i])
a<-table.row.end(a)
}
a<-table.end(a)
table.save(a,file='mytable4.tab')
if (n > n25) {
a<-table.start()
a<-table.row.start(a)
a<-table.element(a,'Goldfeld-Quandt test for Heteroskedasticity',4,TRUE)
a<-table.row.end(a)
a<-table.row.start(a)
a<-table.element(a,'p-values',header=TRUE)
a<-table.element(a,'Alternative Hypothesis',3,header=TRUE)
a<-table.row.end(a)
a<-table.row.start(a)
a<-table.element(a,'breakpoint index',header=TRUE)
a<-table.element(a,'greater',header=TRUE)
a<-table.element(a,'2-sided',header=TRUE)
a<-table.element(a,'less',header=TRUE)
a<-table.row.end(a)
for (mypoint in kp3:nmkm3) {
a<-table.row.start(a)
a<-table.element(a,mypoint,header=TRUE)
a<-table.element(a,gqarr[mypoint-kp3+1,1])
a<-table.element(a,gqarr[mypoint-kp3+1,2])
a<-table.element(a,gqarr[mypoint-kp3+1,3])
a<-table.row.end(a)
}
a<-table.end(a)
table.save(a,file='mytable5.tab')
a<-table.start()
a<-table.row.start(a)
a<-table.element(a,'Meta Analysis of Goldfeld-Quandt test for Heteroskedasticity',4,TRUE)
a<-table.row.end(a)
a<-table.row.start(a)
a<-table.element(a,'Description',header=TRUE)
a<-table.element(a,'# significant tests',header=TRUE)
a<-table.element(a,'% significant tests',header=TRUE)
a<-table.element(a,'OK/NOK',header=TRUE)
a<-table.row.end(a)
a<-table.row.start(a)
a<-table.element(a,'1% type I error level',header=TRUE)
a<-table.element(a,numsignificant1)
a<-table.element(a,numsignificant1/numgqtests)
if (numsignificant1/numgqtests < 0.01) dum <- 'OK' else dum <- 'NOK'
a<-table.element(a,dum)
a<-table.row.end(a)
a<-table.row.start(a)
a<-table.element(a,'5% type I error level',header=TRUE)
a<-table.element(a,numsignificant5)
a<-table.element(a,numsignificant5/numgqtests)
if (numsignificant5/numgqtests < 0.05) dum <- 'OK' else dum <- 'NOK'
a<-table.element(a,dum)
a<-table.row.end(a)
a<-table.row.start(a)
a<-table.element(a,'10% type I error level',header=TRUE)
a<-table.element(a,numsignificant10)
a<-table.element(a,numsignificant10/numgqtests)
if (numsignificant10/numgqtests < 0.1) dum <- 'OK' else dum <- 'NOK'
a<-table.element(a,dum)
a<-table.row.end(a)
a<-table.end(a)
table.save(a,file='mytable6.tab')
}