Free Statistics

of Irreproducible Research!

Author's title

Author*The author of this computation has been verified*
R Software Modulerwasp_multipleregression.wasp
Title produced by softwareMultiple Regression
Date of computationFri, 18 Dec 2009 10:57:07 -0700
Cite this page as followsStatistical Computations at FreeStatistics.org, Office for Research Development and Education, URL https://freestatistics.org/blog/index.php?v=date/2009/Dec/18/t1261159121tww3jzxwwbzebk3.htm/, Retrieved Sat, 27 Apr 2024 06:56:01 +0000
Statistical Computations at FreeStatistics.org, Office for Research Development and Education, URL https://freestatistics.org/blog/index.php?pk=69438, Retrieved Sat, 27 Apr 2024 06:56:01 +0000
QR Codes:

Original text written by user:
IsPrivate?No (this computation is public)
User-defined keywords
Estimated Impact128
Family? (F = Feedback message, R = changed R code, M = changed R Module, P = changed Parameters, D = changed Data)
-     [Multiple Regression] [Q1 The Seatbeltlaw] [2007-11-14 19:27:43] [8cd6641b921d30ebe00b648d1481bba0]
- RMPD  [Multiple Regression] [Seatbelt] [2009-11-12 14:03:14] [b98453cac15ba1066b407e146608df68]
-   PD    [Multiple Regression] [WS7] [2009-11-20 17:00:23] [5c968c05ca472afa314d272082b56b09]
-    D        [Multiple Regression] [Multiple Regressi...] [2009-12-18 17:57:07] [91df150cd527c563f0151b3a845ecd72] [Current]
Feedback Forum

Post a new message
Dataseries X:
113	14.3
110	14.2
107	15.9
103	15.3
98	15.5
98	15.1
137	15
148	12.1
147	15.8
139	16.9
130	15.1
128	13.7
127	14.8
123	14.7
118	16
114	15.4
108	15
111	15.5
151	15.1
159	11.7
158	16.3
148	16.7
138	15
137	14.9
136	14.6
133	15.3
126	17.9
120	16.4
114	15.4
116	17.9
153	15.9
162	13.9
161	17.8
149	17.9
139	17.4
135	16.7
130	16
127	16.6
122	19.1
117	17.8
112	17.2
113	18.6
149	16.3
157	15.1
157	19.2
147	17.7
137	19.1
132	18
125	17.5
123	17.8
117	21.1
114	17.2
111	19.4
112	19.8
144	17.6
150	16.2
149	19.5
134	19.9
123	20
116	17.3


Summary of computational transaction
Raw Inputview raw input (R code)
Raw Outputview raw output of R engine
Computing time5 seconds
R Server'Gwilym Jenkins' @ 72.249.127.135

\begin{tabular}{lllllllll}
\hline
Summary of computational transaction \tabularnewline
Raw Input & view raw input (R code)  \tabularnewline
Raw Output & view raw output of R engine  \tabularnewline
Computing time & 5 seconds \tabularnewline
R Server & 'Gwilym Jenkins' @ 72.249.127.135 \tabularnewline
\hline
\end{tabular}
%Source: https://freestatistics.org/blog/index.php?pk=69438&T=0

[TABLE]
[ROW][C]Summary of computational transaction[/C][/ROW]
[ROW][C]Raw Input[/C][C]view raw input (R code) [/C][/ROW]
[ROW][C]Raw Output[/C][C]view raw output of R engine [/C][/ROW]
[ROW][C]Computing time[/C][C]5 seconds[/C][/ROW]
[ROW][C]R Server[/C][C]'Gwilym Jenkins' @ 72.249.127.135[/C][/ROW]
[/TABLE]
Source: https://freestatistics.org/blog/index.php?pk=69438&T=0

Globally Unique Identifier (entire table): ba.freestatistics.org/blog/index.php?pk=69438&T=0

As an alternative you can also use a QR Code:  

The GUIDs for individual cells are displayed in the table below:

Summary of computational transaction
Raw Inputview raw input (R code)
Raw Outputview raw output of R engine
Computing time5 seconds
R Server'Gwilym Jenkins' @ 72.249.127.135


Multiple Linear Regression - Estimated Regression Equation
WK<25j[t] = + 165.733743201702 -2.98888626152753ExpBE[t] -1.75138330574603M1[t] -4.24913691179949M2[t] -2.96911799479788M3[t] -12.4262000472925M4[t] -17.5217309056515M5[t] -13.8261527547884M6[t] + 18.4547647197919M7[t] + 20.0043509103807M8[t] + 30.5861432962875M9[t] + 19.5503901631591M10[t] + 7.7213052731142M11[t] + 0.334641759281152t + e[t]

\begin{tabular}{lllllllll}
\hline
Multiple Linear Regression - Estimated Regression Equation \tabularnewline
WK<25j[t] =  +  165.733743201702 -2.98888626152753ExpBE[t] -1.75138330574603M1[t] -4.24913691179949M2[t] -2.96911799479788M3[t] -12.4262000472925M4[t] -17.5217309056515M5[t] -13.8261527547884M6[t] +  18.4547647197919M7[t] +  20.0043509103807M8[t] +  30.5861432962875M9[t] +  19.5503901631591M10[t] +  7.7213052731142M11[t] +  0.334641759281152t  + e[t] \tabularnewline
\hline
\end{tabular}
%Source: https://freestatistics.org/blog/index.php?pk=69438&T=1

[TABLE]
[ROW][C]Multiple Linear Regression - Estimated Regression Equation[/C][/ROW]
[ROW][C]WK<25j[t] =  +  165.733743201702 -2.98888626152753ExpBE[t] -1.75138330574603M1[t] -4.24913691179949M2[t] -2.96911799479788M3[t] -12.4262000472925M4[t] -17.5217309056515M5[t] -13.8261527547884M6[t] +  18.4547647197919M7[t] +  20.0043509103807M8[t] +  30.5861432962875M9[t] +  19.5503901631591M10[t] +  7.7213052731142M11[t] +  0.334641759281152t  + e[t][/C][/ROW]
[/TABLE]
Source: https://freestatistics.org/blog/index.php?pk=69438&T=1

Globally Unique Identifier (entire table): ba.freestatistics.org/blog/index.php?pk=69438&T=1

As an alternative you can also use a QR Code:  

The GUIDs for individual cells are displayed in the table below:

Multiple Linear Regression - Estimated Regression Equation
WK<25j[t] = + 165.733743201702 -2.98888626152753ExpBE[t] -1.75138330574603M1[t] -4.24913691179949M2[t] -2.96911799479788M3[t] -12.4262000472925M4[t] -17.5217309056515M5[t] -13.8261527547884M6[t] + 18.4547647197919M7[t] + 20.0043509103807M8[t] + 30.5861432962875M9[t] + 19.5503901631591M10[t] + 7.7213052731142M11[t] + 0.334641759281152t + e[t]


Multiple Linear Regression - Ordinary Least Squares
VariableParameterS.D.T-STATH0: parameter = 02-tail p-value1-tail p-value
(Intercept)165.73374320170218.8009648.815200
ExpBE-2.988886261527531.403729-2.12920.0386180.019309
M1-1.751383305746034.264698-0.41070.6832210.341611
M2-4.249136911799494.287849-0.9910.3268840.163442
M3-2.969117994797885.61351-0.52890.5994020.299701
M4-12.42620004729254.444025-2.79620.0075220.003761
M5-17.52173090565154.438739-3.94750.0002680.000134
M6-13.82615275478844.891554-2.82650.0069410.003471
M718.45476471979194.2410274.35157.5e-053.7e-05
M820.00435091038075.0626323.95140.0002650.000133
M930.58614329628754.951766.176800
M1019.55039016315914.9635753.93880.0002760.000138
M117.72130527311424.5846881.68420.0989270.049464
t0.3346417592811520.1260682.65450.0108730.005437

\begin{tabular}{lllllllll}
\hline
Multiple Linear Regression - Ordinary Least Squares \tabularnewline
Variable & Parameter & S.D. & T-STATH0: parameter = 0 & 2-tail p-value & 1-tail p-value \tabularnewline
(Intercept) & 165.733743201702 & 18.800964 & 8.8152 & 0 & 0 \tabularnewline
ExpBE & -2.98888626152753 & 1.403729 & -2.1292 & 0.038618 & 0.019309 \tabularnewline
M1 & -1.75138330574603 & 4.264698 & -0.4107 & 0.683221 & 0.341611 \tabularnewline
M2 & -4.24913691179949 & 4.287849 & -0.991 & 0.326884 & 0.163442 \tabularnewline
M3 & -2.96911799479788 & 5.61351 & -0.5289 & 0.599402 & 0.299701 \tabularnewline
M4 & -12.4262000472925 & 4.444025 & -2.7962 & 0.007522 & 0.003761 \tabularnewline
M5 & -17.5217309056515 & 4.438739 & -3.9475 & 0.000268 & 0.000134 \tabularnewline
M6 & -13.8261527547884 & 4.891554 & -2.8265 & 0.006941 & 0.003471 \tabularnewline
M7 & 18.4547647197919 & 4.241027 & 4.3515 & 7.5e-05 & 3.7e-05 \tabularnewline
M8 & 20.0043509103807 & 5.062632 & 3.9514 & 0.000265 & 0.000133 \tabularnewline
M9 & 30.5861432962875 & 4.95176 & 6.1768 & 0 & 0 \tabularnewline
M10 & 19.5503901631591 & 4.963575 & 3.9388 & 0.000276 & 0.000138 \tabularnewline
M11 & 7.7213052731142 & 4.584688 & 1.6842 & 0.098927 & 0.049464 \tabularnewline
t & 0.334641759281152 & 0.126068 & 2.6545 & 0.010873 & 0.005437 \tabularnewline
\hline
\end{tabular}
%Source: https://freestatistics.org/blog/index.php?pk=69438&T=2

[TABLE]
[ROW][C]Multiple Linear Regression - Ordinary Least Squares[/C][/ROW]
[ROW][C]Variable[/C][C]Parameter[/C][C]S.D.[/C][C]T-STATH0: parameter = 0[/C][C]2-tail p-value[/C][C]1-tail p-value[/C][/ROW]
[ROW][C](Intercept)[/C][C]165.733743201702[/C][C]18.800964[/C][C]8.8152[/C][C]0[/C][C]0[/C][/ROW]
[ROW][C]ExpBE[/C][C]-2.98888626152753[/C][C]1.403729[/C][C]-2.1292[/C][C]0.038618[/C][C]0.019309[/C][/ROW]
[ROW][C]M1[/C][C]-1.75138330574603[/C][C]4.264698[/C][C]-0.4107[/C][C]0.683221[/C][C]0.341611[/C][/ROW]
[ROW][C]M2[/C][C]-4.24913691179949[/C][C]4.287849[/C][C]-0.991[/C][C]0.326884[/C][C]0.163442[/C][/ROW]
[ROW][C]M3[/C][C]-2.96911799479788[/C][C]5.61351[/C][C]-0.5289[/C][C]0.599402[/C][C]0.299701[/C][/ROW]
[ROW][C]M4[/C][C]-12.4262000472925[/C][C]4.444025[/C][C]-2.7962[/C][C]0.007522[/C][C]0.003761[/C][/ROW]
[ROW][C]M5[/C][C]-17.5217309056515[/C][C]4.438739[/C][C]-3.9475[/C][C]0.000268[/C][C]0.000134[/C][/ROW]
[ROW][C]M6[/C][C]-13.8261527547884[/C][C]4.891554[/C][C]-2.8265[/C][C]0.006941[/C][C]0.003471[/C][/ROW]
[ROW][C]M7[/C][C]18.4547647197919[/C][C]4.241027[/C][C]4.3515[/C][C]7.5e-05[/C][C]3.7e-05[/C][/ROW]
[ROW][C]M8[/C][C]20.0043509103807[/C][C]5.062632[/C][C]3.9514[/C][C]0.000265[/C][C]0.000133[/C][/ROW]
[ROW][C]M9[/C][C]30.5861432962875[/C][C]4.95176[/C][C]6.1768[/C][C]0[/C][C]0[/C][/ROW]
[ROW][C]M10[/C][C]19.5503901631591[/C][C]4.963575[/C][C]3.9388[/C][C]0.000276[/C][C]0.000138[/C][/ROW]
[ROW][C]M11[/C][C]7.7213052731142[/C][C]4.584688[/C][C]1.6842[/C][C]0.098927[/C][C]0.049464[/C][/ROW]
[ROW][C]t[/C][C]0.334641759281152[/C][C]0.126068[/C][C]2.6545[/C][C]0.010873[/C][C]0.005437[/C][/ROW]
[/TABLE]
Source: https://freestatistics.org/blog/index.php?pk=69438&T=2

Globally Unique Identifier (entire table): ba.freestatistics.org/blog/index.php?pk=69438&T=2

As an alternative you can also use a QR Code:  

The GUIDs for individual cells are displayed in the table below:

Multiple Linear Regression - Ordinary Least Squares
VariableParameterS.D.T-STATH0: parameter = 02-tail p-value1-tail p-value
(Intercept)165.73374320170218.8009648.815200
ExpBE-2.988886261527531.403729-2.12920.0386180.019309
M1-1.751383305746034.264698-0.41070.6832210.341611
M2-4.249136911799494.287849-0.9910.3268840.163442
M3-2.969117994797885.61351-0.52890.5994020.299701
M4-12.42620004729254.444025-2.79620.0075220.003761
M5-17.52173090565154.438739-3.94750.0002680.000134
M6-13.82615275478844.891554-2.82650.0069410.003471
M718.45476471979194.2410274.35157.5e-053.7e-05
M820.00435091038075.0626323.95140.0002650.000133
M930.58614329628754.951766.176800
M1019.55039016315914.9635753.93880.0002760.000138
M117.72130527311424.5846881.68420.0989270.049464
t0.3346417592811520.1260682.65450.0108730.005437


Multiple Linear Regression - Regression Statistics
Multiple R0.939979664256332
R-squared0.883561769215446
Adjusted R-squared0.850655312689376
F-TEST (value)26.8507114558341
F-TEST (DF numerator)13
F-TEST (DF denominator)46
p-value0
Multiple Linear Regression - Residual Statistics
Residual Standard Deviation6.666554877216
Sum Squared Residuals2044.37588082289

\begin{tabular}{lllllllll}
\hline
Multiple Linear Regression - Regression Statistics \tabularnewline
Multiple R & 0.939979664256332 \tabularnewline
R-squared & 0.883561769215446 \tabularnewline
Adjusted R-squared & 0.850655312689376 \tabularnewline
F-TEST (value) & 26.8507114558341 \tabularnewline
F-TEST (DF numerator) & 13 \tabularnewline
F-TEST (DF denominator) & 46 \tabularnewline
p-value & 0 \tabularnewline
Multiple Linear Regression - Residual Statistics \tabularnewline
Residual Standard Deviation & 6.666554877216 \tabularnewline
Sum Squared Residuals & 2044.37588082289 \tabularnewline
\hline
\end{tabular}
%Source: https://freestatistics.org/blog/index.php?pk=69438&T=3

[TABLE]
[ROW][C]Multiple Linear Regression - Regression Statistics[/C][/ROW]
[ROW][C]Multiple R[/C][C]0.939979664256332[/C][/ROW]
[ROW][C]R-squared[/C][C]0.883561769215446[/C][/ROW]
[ROW][C]Adjusted R-squared[/C][C]0.850655312689376[/C][/ROW]
[ROW][C]F-TEST (value)[/C][C]26.8507114558341[/C][/ROW]
[ROW][C]F-TEST (DF numerator)[/C][C]13[/C][/ROW]
[ROW][C]F-TEST (DF denominator)[/C][C]46[/C][/ROW]
[ROW][C]p-value[/C][C]0[/C][/ROW]
[ROW][C]Multiple Linear Regression - Residual Statistics[/C][/ROW]
[ROW][C]Residual Standard Deviation[/C][C]6.666554877216[/C][/ROW]
[ROW][C]Sum Squared Residuals[/C][C]2044.37588082289[/C][/ROW]
[/TABLE]
Source: https://freestatistics.org/blog/index.php?pk=69438&T=3

Globally Unique Identifier (entire table): ba.freestatistics.org/blog/index.php?pk=69438&T=3

As an alternative you can also use a QR Code:  

The GUIDs for individual cells are displayed in the table below:

Multiple Linear Regression - Regression Statistics
Multiple R0.939979664256332
R-squared0.883561769215446
Adjusted R-squared0.850655312689376
F-TEST (value)26.8507114558341
F-TEST (DF numerator)13
F-TEST (DF denominator)46
p-value0
Multiple Linear Regression - Residual Statistics
Residual Standard Deviation6.666554877216
Sum Squared Residuals2044.37588082289


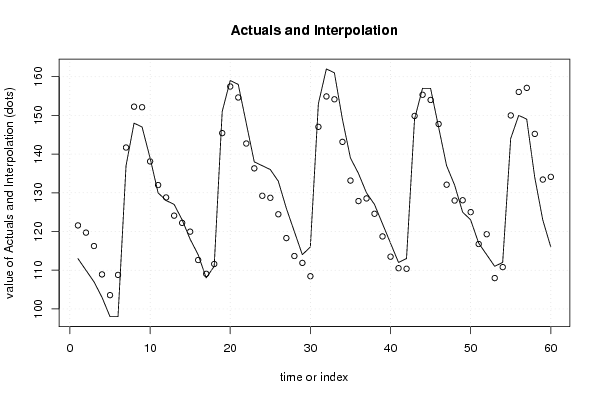
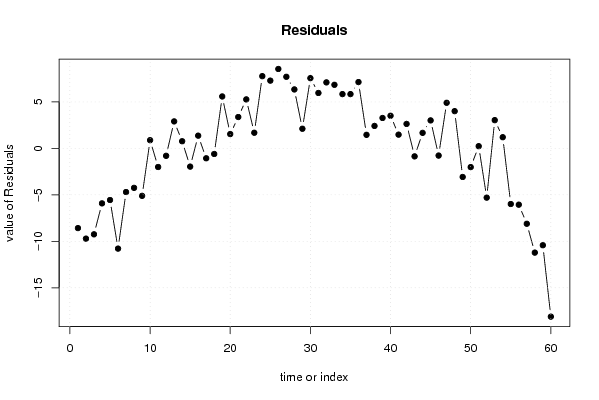
Multiple Linear Regression - Actuals, Interpolation, and Residuals
Time or IndexActualsInterpolationForecastResidualsPrediction Error
1113121.575928115394-8.57592811539369
2110119.711704894774-9.7117048947742
3107116.245258926460-9.24525892646015
4103108.916150390163-5.91615039016317
598103.557484038780-5.55748403877987
698108.783258453535-10.7832584535351
7137141.697706313549-4.69770631354935
8148152.249704421849-4.24970442184912
9147152.107259399385-5.10725939938521
10139138.1183731378580.881626862142338
11130132.003925277843-2.00392527784344
12128128.801702530149-0.801702530148966
13127124.0971860960042.90281390399620
14123122.2329628753840.767037124615754
15118119.962071411681-1.96207141168123
16114112.6329628753841.36703712461575
17108109.067628280917-1.06762828091747
18111111.603405060298-0.603405060297926
19151145.4145187987705.58548120122961
20159157.4609600378341.53903996216601
21158154.6285173799953.37148262000474
22148142.7318515015375.26814849846299
23138136.318515015371.68148498462995
24137129.2307401276907.76925987231025
25136128.7106644596837.28933554031686
26133124.4553322298428.54466777015844
27126118.2988886261537.70111137384724
28120113.6597777252316.34022227476945
29114111.8877748876802.11222511231972
30116108.4457791440067.55422085599431
31153147.0391109009225.9608890990778
32162154.9011113738477.09888862615275
33161154.1608890990786.83911090092221
34149143.1608890990785.8391109009222
35139133.1608890990785.8391109009222
36135127.8664459683147.13355403168597
37130128.5419248049181.45807519508158
38127124.5854812012302.4145187987704
39122118.7279262236943.27207377630646
40117113.4910380704663.50896192953416
41112110.5234807283051.47651927169544
42113110.3692598723102.63074012768976
43149149.859257507685-0.859257507685013
44157155.3301489713881.66985102861196
45157153.9921494443133.00785055568692
46147147.774367462757-0.774367462757131
47137132.0954835658554.90451643414517
48132127.9965949397024.00340506029793
49125128.074296524001-3.07429652400096
50123125.014518798770-2.01451879877039
51117116.7658548120120.234145187987687
52114119.300070938756-5.30007093875619
53111107.9636320643183.03636793568217
54112110.7982974698511.20170253014896
55144149.989406479073-5.98940647907305
56150156.058075195082-6.05807519508159
57149157.111184677229-8.11118467722866
58134145.214518798770-11.2145187987704
59123133.421187041854-10.4211870418539
60116134.104516434145-18.1045164341452

\begin{tabular}{lllllllll}
\hline
Multiple Linear Regression - Actuals, Interpolation, and Residuals \tabularnewline
Time or Index & Actuals & InterpolationForecast & ResidualsPrediction Error \tabularnewline
1 & 113 & 121.575928115394 & -8.57592811539369 \tabularnewline
2 & 110 & 119.711704894774 & -9.7117048947742 \tabularnewline
3 & 107 & 116.245258926460 & -9.24525892646015 \tabularnewline
4 & 103 & 108.916150390163 & -5.91615039016317 \tabularnewline
5 & 98 & 103.557484038780 & -5.55748403877987 \tabularnewline
6 & 98 & 108.783258453535 & -10.7832584535351 \tabularnewline
7 & 137 & 141.697706313549 & -4.69770631354935 \tabularnewline
8 & 148 & 152.249704421849 & -4.24970442184912 \tabularnewline
9 & 147 & 152.107259399385 & -5.10725939938521 \tabularnewline
10 & 139 & 138.118373137858 & 0.881626862142338 \tabularnewline
11 & 130 & 132.003925277843 & -2.00392527784344 \tabularnewline
12 & 128 & 128.801702530149 & -0.801702530148966 \tabularnewline
13 & 127 & 124.097186096004 & 2.90281390399620 \tabularnewline
14 & 123 & 122.232962875384 & 0.767037124615754 \tabularnewline
15 & 118 & 119.962071411681 & -1.96207141168123 \tabularnewline
16 & 114 & 112.632962875384 & 1.36703712461575 \tabularnewline
17 & 108 & 109.067628280917 & -1.06762828091747 \tabularnewline
18 & 111 & 111.603405060298 & -0.603405060297926 \tabularnewline
19 & 151 & 145.414518798770 & 5.58548120122961 \tabularnewline
20 & 159 & 157.460960037834 & 1.53903996216601 \tabularnewline
21 & 158 & 154.628517379995 & 3.37148262000474 \tabularnewline
22 & 148 & 142.731851501537 & 5.26814849846299 \tabularnewline
23 & 138 & 136.31851501537 & 1.68148498462995 \tabularnewline
24 & 137 & 129.230740127690 & 7.76925987231025 \tabularnewline
25 & 136 & 128.710664459683 & 7.28933554031686 \tabularnewline
26 & 133 & 124.455332229842 & 8.54466777015844 \tabularnewline
27 & 126 & 118.298888626153 & 7.70111137384724 \tabularnewline
28 & 120 & 113.659777725231 & 6.34022227476945 \tabularnewline
29 & 114 & 111.887774887680 & 2.11222511231972 \tabularnewline
30 & 116 & 108.445779144006 & 7.55422085599431 \tabularnewline
31 & 153 & 147.039110900922 & 5.9608890990778 \tabularnewline
32 & 162 & 154.901111373847 & 7.09888862615275 \tabularnewline
33 & 161 & 154.160889099078 & 6.83911090092221 \tabularnewline
34 & 149 & 143.160889099078 & 5.8391109009222 \tabularnewline
35 & 139 & 133.160889099078 & 5.8391109009222 \tabularnewline
36 & 135 & 127.866445968314 & 7.13355403168597 \tabularnewline
37 & 130 & 128.541924804918 & 1.45807519508158 \tabularnewline
38 & 127 & 124.585481201230 & 2.4145187987704 \tabularnewline
39 & 122 & 118.727926223694 & 3.27207377630646 \tabularnewline
40 & 117 & 113.491038070466 & 3.50896192953416 \tabularnewline
41 & 112 & 110.523480728305 & 1.47651927169544 \tabularnewline
42 & 113 & 110.369259872310 & 2.63074012768976 \tabularnewline
43 & 149 & 149.859257507685 & -0.859257507685013 \tabularnewline
44 & 157 & 155.330148971388 & 1.66985102861196 \tabularnewline
45 & 157 & 153.992149444313 & 3.00785055568692 \tabularnewline
46 & 147 & 147.774367462757 & -0.774367462757131 \tabularnewline
47 & 137 & 132.095483565855 & 4.90451643414517 \tabularnewline
48 & 132 & 127.996594939702 & 4.00340506029793 \tabularnewline
49 & 125 & 128.074296524001 & -3.07429652400096 \tabularnewline
50 & 123 & 125.014518798770 & -2.01451879877039 \tabularnewline
51 & 117 & 116.765854812012 & 0.234145187987687 \tabularnewline
52 & 114 & 119.300070938756 & -5.30007093875619 \tabularnewline
53 & 111 & 107.963632064318 & 3.03636793568217 \tabularnewline
54 & 112 & 110.798297469851 & 1.20170253014896 \tabularnewline
55 & 144 & 149.989406479073 & -5.98940647907305 \tabularnewline
56 & 150 & 156.058075195082 & -6.05807519508159 \tabularnewline
57 & 149 & 157.111184677229 & -8.11118467722866 \tabularnewline
58 & 134 & 145.214518798770 & -11.2145187987704 \tabularnewline
59 & 123 & 133.421187041854 & -10.4211870418539 \tabularnewline
60 & 116 & 134.104516434145 & -18.1045164341452 \tabularnewline
\hline
\end{tabular}
%Source: https://freestatistics.org/blog/index.php?pk=69438&T=4

[TABLE]
[ROW][C]Multiple Linear Regression - Actuals, Interpolation, and Residuals[/C][/ROW]
[ROW][C]Time or Index[/C][C]Actuals[/C][C]InterpolationForecast[/C][C]ResidualsPrediction Error[/C][/ROW]
[ROW][C]1[/C][C]113[/C][C]121.575928115394[/C][C]-8.57592811539369[/C][/ROW]
[ROW][C]2[/C][C]110[/C][C]119.711704894774[/C][C]-9.7117048947742[/C][/ROW]
[ROW][C]3[/C][C]107[/C][C]116.245258926460[/C][C]-9.24525892646015[/C][/ROW]
[ROW][C]4[/C][C]103[/C][C]108.916150390163[/C][C]-5.91615039016317[/C][/ROW]
[ROW][C]5[/C][C]98[/C][C]103.557484038780[/C][C]-5.55748403877987[/C][/ROW]
[ROW][C]6[/C][C]98[/C][C]108.783258453535[/C][C]-10.7832584535351[/C][/ROW]
[ROW][C]7[/C][C]137[/C][C]141.697706313549[/C][C]-4.69770631354935[/C][/ROW]
[ROW][C]8[/C][C]148[/C][C]152.249704421849[/C][C]-4.24970442184912[/C][/ROW]
[ROW][C]9[/C][C]147[/C][C]152.107259399385[/C][C]-5.10725939938521[/C][/ROW]
[ROW][C]10[/C][C]139[/C][C]138.118373137858[/C][C]0.881626862142338[/C][/ROW]
[ROW][C]11[/C][C]130[/C][C]132.003925277843[/C][C]-2.00392527784344[/C][/ROW]
[ROW][C]12[/C][C]128[/C][C]128.801702530149[/C][C]-0.801702530148966[/C][/ROW]
[ROW][C]13[/C][C]127[/C][C]124.097186096004[/C][C]2.90281390399620[/C][/ROW]
[ROW][C]14[/C][C]123[/C][C]122.232962875384[/C][C]0.767037124615754[/C][/ROW]
[ROW][C]15[/C][C]118[/C][C]119.962071411681[/C][C]-1.96207141168123[/C][/ROW]
[ROW][C]16[/C][C]114[/C][C]112.632962875384[/C][C]1.36703712461575[/C][/ROW]
[ROW][C]17[/C][C]108[/C][C]109.067628280917[/C][C]-1.06762828091747[/C][/ROW]
[ROW][C]18[/C][C]111[/C][C]111.603405060298[/C][C]-0.603405060297926[/C][/ROW]
[ROW][C]19[/C][C]151[/C][C]145.414518798770[/C][C]5.58548120122961[/C][/ROW]
[ROW][C]20[/C][C]159[/C][C]157.460960037834[/C][C]1.53903996216601[/C][/ROW]
[ROW][C]21[/C][C]158[/C][C]154.628517379995[/C][C]3.37148262000474[/C][/ROW]
[ROW][C]22[/C][C]148[/C][C]142.731851501537[/C][C]5.26814849846299[/C][/ROW]
[ROW][C]23[/C][C]138[/C][C]136.31851501537[/C][C]1.68148498462995[/C][/ROW]
[ROW][C]24[/C][C]137[/C][C]129.230740127690[/C][C]7.76925987231025[/C][/ROW]
[ROW][C]25[/C][C]136[/C][C]128.710664459683[/C][C]7.28933554031686[/C][/ROW]
[ROW][C]26[/C][C]133[/C][C]124.455332229842[/C][C]8.54466777015844[/C][/ROW]
[ROW][C]27[/C][C]126[/C][C]118.298888626153[/C][C]7.70111137384724[/C][/ROW]
[ROW][C]28[/C][C]120[/C][C]113.659777725231[/C][C]6.34022227476945[/C][/ROW]
[ROW][C]29[/C][C]114[/C][C]111.887774887680[/C][C]2.11222511231972[/C][/ROW]
[ROW][C]30[/C][C]116[/C][C]108.445779144006[/C][C]7.55422085599431[/C][/ROW]
[ROW][C]31[/C][C]153[/C][C]147.039110900922[/C][C]5.9608890990778[/C][/ROW]
[ROW][C]32[/C][C]162[/C][C]154.901111373847[/C][C]7.09888862615275[/C][/ROW]
[ROW][C]33[/C][C]161[/C][C]154.160889099078[/C][C]6.83911090092221[/C][/ROW]
[ROW][C]34[/C][C]149[/C][C]143.160889099078[/C][C]5.8391109009222[/C][/ROW]
[ROW][C]35[/C][C]139[/C][C]133.160889099078[/C][C]5.8391109009222[/C][/ROW]
[ROW][C]36[/C][C]135[/C][C]127.866445968314[/C][C]7.13355403168597[/C][/ROW]
[ROW][C]37[/C][C]130[/C][C]128.541924804918[/C][C]1.45807519508158[/C][/ROW]
[ROW][C]38[/C][C]127[/C][C]124.585481201230[/C][C]2.4145187987704[/C][/ROW]
[ROW][C]39[/C][C]122[/C][C]118.727926223694[/C][C]3.27207377630646[/C][/ROW]
[ROW][C]40[/C][C]117[/C][C]113.491038070466[/C][C]3.50896192953416[/C][/ROW]
[ROW][C]41[/C][C]112[/C][C]110.523480728305[/C][C]1.47651927169544[/C][/ROW]
[ROW][C]42[/C][C]113[/C][C]110.369259872310[/C][C]2.63074012768976[/C][/ROW]
[ROW][C]43[/C][C]149[/C][C]149.859257507685[/C][C]-0.859257507685013[/C][/ROW]
[ROW][C]44[/C][C]157[/C][C]155.330148971388[/C][C]1.66985102861196[/C][/ROW]
[ROW][C]45[/C][C]157[/C][C]153.992149444313[/C][C]3.00785055568692[/C][/ROW]
[ROW][C]46[/C][C]147[/C][C]147.774367462757[/C][C]-0.774367462757131[/C][/ROW]
[ROW][C]47[/C][C]137[/C][C]132.095483565855[/C][C]4.90451643414517[/C][/ROW]
[ROW][C]48[/C][C]132[/C][C]127.996594939702[/C][C]4.00340506029793[/C][/ROW]
[ROW][C]49[/C][C]125[/C][C]128.074296524001[/C][C]-3.07429652400096[/C][/ROW]
[ROW][C]50[/C][C]123[/C][C]125.014518798770[/C][C]-2.01451879877039[/C][/ROW]
[ROW][C]51[/C][C]117[/C][C]116.765854812012[/C][C]0.234145187987687[/C][/ROW]
[ROW][C]52[/C][C]114[/C][C]119.300070938756[/C][C]-5.30007093875619[/C][/ROW]
[ROW][C]53[/C][C]111[/C][C]107.963632064318[/C][C]3.03636793568217[/C][/ROW]
[ROW][C]54[/C][C]112[/C][C]110.798297469851[/C][C]1.20170253014896[/C][/ROW]
[ROW][C]55[/C][C]144[/C][C]149.989406479073[/C][C]-5.98940647907305[/C][/ROW]
[ROW][C]56[/C][C]150[/C][C]156.058075195082[/C][C]-6.05807519508159[/C][/ROW]
[ROW][C]57[/C][C]149[/C][C]157.111184677229[/C][C]-8.11118467722866[/C][/ROW]
[ROW][C]58[/C][C]134[/C][C]145.214518798770[/C][C]-11.2145187987704[/C][/ROW]
[ROW][C]59[/C][C]123[/C][C]133.421187041854[/C][C]-10.4211870418539[/C][/ROW]
[ROW][C]60[/C][C]116[/C][C]134.104516434145[/C][C]-18.1045164341452[/C][/ROW]
[/TABLE]
Source: https://freestatistics.org/blog/index.php?pk=69438&T=4

Globally Unique Identifier (entire table): ba.freestatistics.org/blog/index.php?pk=69438&T=4

As an alternative you can also use a QR Code:  

The GUIDs for individual cells are displayed in the table below:

Multiple Linear Regression - Actuals, Interpolation, and Residuals
Time or IndexActualsInterpolationForecastResidualsPrediction Error
1113121.575928115394-8.57592811539369
2110119.711704894774-9.7117048947742
3107116.245258926460-9.24525892646015
4103108.916150390163-5.91615039016317
598103.557484038780-5.55748403877987
698108.783258453535-10.7832584535351
7137141.697706313549-4.69770631354935
8148152.249704421849-4.24970442184912
9147152.107259399385-5.10725939938521
10139138.1183731378580.881626862142338
11130132.003925277843-2.00392527784344
12128128.801702530149-0.801702530148966
13127124.0971860960042.90281390399620
14123122.2329628753840.767037124615754
15118119.962071411681-1.96207141168123
16114112.6329628753841.36703712461575
17108109.067628280917-1.06762828091747
18111111.603405060298-0.603405060297926
19151145.4145187987705.58548120122961
20159157.4609600378341.53903996216601
21158154.6285173799953.37148262000474
22148142.7318515015375.26814849846299
23138136.318515015371.68148498462995
24137129.2307401276907.76925987231025
25136128.7106644596837.28933554031686
26133124.4553322298428.54466777015844
27126118.2988886261537.70111137384724
28120113.6597777252316.34022227476945
29114111.8877748876802.11222511231972
30116108.4457791440067.55422085599431
31153147.0391109009225.9608890990778
32162154.9011113738477.09888862615275
33161154.1608890990786.83911090092221
34149143.1608890990785.8391109009222
35139133.1608890990785.8391109009222
36135127.8664459683147.13355403168597
37130128.5419248049181.45807519508158
38127124.5854812012302.4145187987704
39122118.7279262236943.27207377630646
40117113.4910380704663.50896192953416
41112110.5234807283051.47651927169544
42113110.3692598723102.63074012768976
43149149.859257507685-0.859257507685013
44157155.3301489713881.66985102861196
45157153.9921494443133.00785055568692
46147147.774367462757-0.774367462757131
47137132.0954835658554.90451643414517
48132127.9965949397024.00340506029793
49125128.074296524001-3.07429652400096
50123125.014518798770-2.01451879877039
51117116.7658548120120.234145187987687
52114119.300070938756-5.30007093875619
53111107.9636320643183.03636793568217
54112110.7982974698511.20170253014896
55144149.989406479073-5.98940647907305
56150156.058075195082-6.05807519508159
57149157.111184677229-8.11118467722866
58134145.214518798770-11.2145187987704
59123133.421187041854-10.4211870418539
60116134.104516434145-18.1045164341452


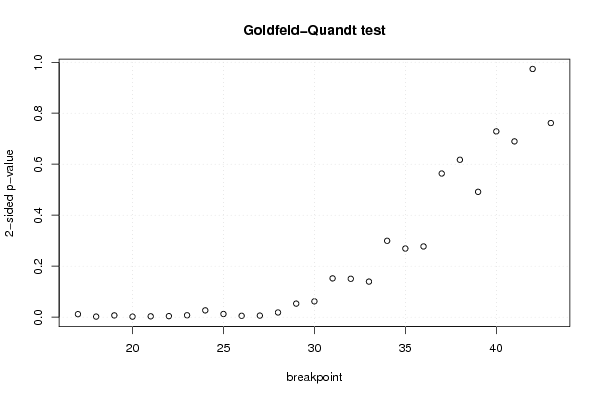
Goldfeld-Quandt test for Heteroskedasticity
p-valuesAlternative Hypothesis
breakpoint indexgreater2-sidedless
170.005895578652583690.01179115730516740.994104421347416
180.001112661029640240.002225322059280480.99888733897036
190.003497892064427850.006995784128855710.996502107935572
200.001010013200579030.002020026401158050.998989986799421
210.001672112384841810.003344224769683630.998327887615158
220.002026151775340280.004052303550680560.99797384822466
230.003744224692350830.007488449384701660.99625577530765
240.01336306450716580.02672612901433160.986636935492834
250.006215464247123660.01243092849424730.993784535752876
260.002700447198562790.005400894397125580.997299552801437
270.003078731716396560.006157463432793120.996921268283604
280.009235834672868240.01847166934573650.990764165327132
290.02654226717467580.05308453434935160.973457732825324
300.03101610315224740.06203220630449480.968983896847753
310.07609515744818190.1521903148963640.923904842551818
320.07528066074267730.1505613214853550.924719339257323
330.06976092391166240.1395218478233250.930239076088338
340.1498036500762960.2996073001525920.850196349923704
350.1346259960499970.2692519920999930.865374003950003
360.1387116744728090.2774233489456190.861288325527191
370.2817764399728040.5635528799456090.718223560027196
380.3087224289130630.6174448578261250.691277571086937
390.2458447740738290.4916895481476570.754155225926171
400.3643775028594510.7287550057189030.635622497140549
410.3448114883285740.6896229766571480.655188511671426
420.5131266005021590.9737467989956820.486873399497841
430.6192034622066980.7615930755866040.380796537793302

\begin{tabular}{lllllllll}
\hline
Goldfeld-Quandt test for Heteroskedasticity \tabularnewline
p-values & Alternative Hypothesis \tabularnewline
breakpoint index & greater & 2-sided & less \tabularnewline
17 & 0.00589557865258369 & 0.0117911573051674 & 0.994104421347416 \tabularnewline
18 & 0.00111266102964024 & 0.00222532205928048 & 0.99888733897036 \tabularnewline
19 & 0.00349789206442785 & 0.00699578412885571 & 0.996502107935572 \tabularnewline
20 & 0.00101001320057903 & 0.00202002640115805 & 0.998989986799421 \tabularnewline
21 & 0.00167211238484181 & 0.00334422476968363 & 0.998327887615158 \tabularnewline
22 & 0.00202615177534028 & 0.00405230355068056 & 0.99797384822466 \tabularnewline
23 & 0.00374422469235083 & 0.00748844938470166 & 0.99625577530765 \tabularnewline
24 & 0.0133630645071658 & 0.0267261290143316 & 0.986636935492834 \tabularnewline
25 & 0.00621546424712366 & 0.0124309284942473 & 0.993784535752876 \tabularnewline
26 & 0.00270044719856279 & 0.00540089439712558 & 0.997299552801437 \tabularnewline
27 & 0.00307873171639656 & 0.00615746343279312 & 0.996921268283604 \tabularnewline
28 & 0.00923583467286824 & 0.0184716693457365 & 0.990764165327132 \tabularnewline
29 & 0.0265422671746758 & 0.0530845343493516 & 0.973457732825324 \tabularnewline
30 & 0.0310161031522474 & 0.0620322063044948 & 0.968983896847753 \tabularnewline
31 & 0.0760951574481819 & 0.152190314896364 & 0.923904842551818 \tabularnewline
32 & 0.0752806607426773 & 0.150561321485355 & 0.924719339257323 \tabularnewline
33 & 0.0697609239116624 & 0.139521847823325 & 0.930239076088338 \tabularnewline
34 & 0.149803650076296 & 0.299607300152592 & 0.850196349923704 \tabularnewline
35 & 0.134625996049997 & 0.269251992099993 & 0.865374003950003 \tabularnewline
36 & 0.138711674472809 & 0.277423348945619 & 0.861288325527191 \tabularnewline
37 & 0.281776439972804 & 0.563552879945609 & 0.718223560027196 \tabularnewline
38 & 0.308722428913063 & 0.617444857826125 & 0.691277571086937 \tabularnewline
39 & 0.245844774073829 & 0.491689548147657 & 0.754155225926171 \tabularnewline
40 & 0.364377502859451 & 0.728755005718903 & 0.635622497140549 \tabularnewline
41 & 0.344811488328574 & 0.689622976657148 & 0.655188511671426 \tabularnewline
42 & 0.513126600502159 & 0.973746798995682 & 0.486873399497841 \tabularnewline
43 & 0.619203462206698 & 0.761593075586604 & 0.380796537793302 \tabularnewline
\hline
\end{tabular}
%Source: https://freestatistics.org/blog/index.php?pk=69438&T=5

[TABLE]
[ROW][C]Goldfeld-Quandt test for Heteroskedasticity[/C][/ROW]
[ROW][C]p-values[/C][C]Alternative Hypothesis[/C][/ROW]
[ROW][C]breakpoint index[/C][C]greater[/C][C]2-sided[/C][C]less[/C][/ROW]
[ROW][C]17[/C][C]0.00589557865258369[/C][C]0.0117911573051674[/C][C]0.994104421347416[/C][/ROW]
[ROW][C]18[/C][C]0.00111266102964024[/C][C]0.00222532205928048[/C][C]0.99888733897036[/C][/ROW]
[ROW][C]19[/C][C]0.00349789206442785[/C][C]0.00699578412885571[/C][C]0.996502107935572[/C][/ROW]
[ROW][C]20[/C][C]0.00101001320057903[/C][C]0.00202002640115805[/C][C]0.998989986799421[/C][/ROW]
[ROW][C]21[/C][C]0.00167211238484181[/C][C]0.00334422476968363[/C][C]0.998327887615158[/C][/ROW]
[ROW][C]22[/C][C]0.00202615177534028[/C][C]0.00405230355068056[/C][C]0.99797384822466[/C][/ROW]
[ROW][C]23[/C][C]0.00374422469235083[/C][C]0.00748844938470166[/C][C]0.99625577530765[/C][/ROW]
[ROW][C]24[/C][C]0.0133630645071658[/C][C]0.0267261290143316[/C][C]0.986636935492834[/C][/ROW]
[ROW][C]25[/C][C]0.00621546424712366[/C][C]0.0124309284942473[/C][C]0.993784535752876[/C][/ROW]
[ROW][C]26[/C][C]0.00270044719856279[/C][C]0.00540089439712558[/C][C]0.997299552801437[/C][/ROW]
[ROW][C]27[/C][C]0.00307873171639656[/C][C]0.00615746343279312[/C][C]0.996921268283604[/C][/ROW]
[ROW][C]28[/C][C]0.00923583467286824[/C][C]0.0184716693457365[/C][C]0.990764165327132[/C][/ROW]
[ROW][C]29[/C][C]0.0265422671746758[/C][C]0.0530845343493516[/C][C]0.973457732825324[/C][/ROW]
[ROW][C]30[/C][C]0.0310161031522474[/C][C]0.0620322063044948[/C][C]0.968983896847753[/C][/ROW]
[ROW][C]31[/C][C]0.0760951574481819[/C][C]0.152190314896364[/C][C]0.923904842551818[/C][/ROW]
[ROW][C]32[/C][C]0.0752806607426773[/C][C]0.150561321485355[/C][C]0.924719339257323[/C][/ROW]
[ROW][C]33[/C][C]0.0697609239116624[/C][C]0.139521847823325[/C][C]0.930239076088338[/C][/ROW]
[ROW][C]34[/C][C]0.149803650076296[/C][C]0.299607300152592[/C][C]0.850196349923704[/C][/ROW]
[ROW][C]35[/C][C]0.134625996049997[/C][C]0.269251992099993[/C][C]0.865374003950003[/C][/ROW]
[ROW][C]36[/C][C]0.138711674472809[/C][C]0.277423348945619[/C][C]0.861288325527191[/C][/ROW]
[ROW][C]37[/C][C]0.281776439972804[/C][C]0.563552879945609[/C][C]0.718223560027196[/C][/ROW]
[ROW][C]38[/C][C]0.308722428913063[/C][C]0.617444857826125[/C][C]0.691277571086937[/C][/ROW]
[ROW][C]39[/C][C]0.245844774073829[/C][C]0.491689548147657[/C][C]0.754155225926171[/C][/ROW]
[ROW][C]40[/C][C]0.364377502859451[/C][C]0.728755005718903[/C][C]0.635622497140549[/C][/ROW]
[ROW][C]41[/C][C]0.344811488328574[/C][C]0.689622976657148[/C][C]0.655188511671426[/C][/ROW]
[ROW][C]42[/C][C]0.513126600502159[/C][C]0.973746798995682[/C][C]0.486873399497841[/C][/ROW]
[ROW][C]43[/C][C]0.619203462206698[/C][C]0.761593075586604[/C][C]0.380796537793302[/C][/ROW]
[/TABLE]
Source: https://freestatistics.org/blog/index.php?pk=69438&T=5

Globally Unique Identifier (entire table): ba.freestatistics.org/blog/index.php?pk=69438&T=5

As an alternative you can also use a QR Code:  

The GUIDs for individual cells are displayed in the table below:

Goldfeld-Quandt test for Heteroskedasticity
p-valuesAlternative Hypothesis
breakpoint indexgreater2-sidedless
170.005895578652583690.01179115730516740.994104421347416
180.001112661029640240.002225322059280480.99888733897036
190.003497892064427850.006995784128855710.996502107935572
200.001010013200579030.002020026401158050.998989986799421
210.001672112384841810.003344224769683630.998327887615158
220.002026151775340280.004052303550680560.99797384822466
230.003744224692350830.007488449384701660.99625577530765
240.01336306450716580.02672612901433160.986636935492834
250.006215464247123660.01243092849424730.993784535752876
260.002700447198562790.005400894397125580.997299552801437
270.003078731716396560.006157463432793120.996921268283604
280.009235834672868240.01847166934573650.990764165327132
290.02654226717467580.05308453434935160.973457732825324
300.03101610315224740.06203220630449480.968983896847753
310.07609515744818190.1521903148963640.923904842551818
320.07528066074267730.1505613214853550.924719339257323
330.06976092391166240.1395218478233250.930239076088338
340.1498036500762960.2996073001525920.850196349923704
350.1346259960499970.2692519920999930.865374003950003
360.1387116744728090.2774233489456190.861288325527191
370.2817764399728040.5635528799456090.718223560027196
380.3087224289130630.6174448578261250.691277571086937
390.2458447740738290.4916895481476570.754155225926171
400.3643775028594510.7287550057189030.635622497140549
410.3448114883285740.6896229766571480.655188511671426
420.5131266005021590.9737467989956820.486873399497841
430.6192034622066980.7615930755866040.380796537793302


Meta Analysis of Goldfeld-Quandt test for Heteroskedasticity
Description# significant tests% significant testsOK/NOK
1% type I error level80.296296296296296NOK
5% type I error level120.444444444444444NOK
10% type I error level140.518518518518518NOK

\begin{tabular}{lllllllll}
\hline
Meta Analysis of Goldfeld-Quandt test for Heteroskedasticity \tabularnewline
Description & # significant tests & % significant tests & OK/NOK \tabularnewline
1% type I error level & 8 & 0.296296296296296 & NOK \tabularnewline
5% type I error level & 12 & 0.444444444444444 & NOK \tabularnewline
10% type I error level & 14 & 0.518518518518518 & NOK \tabularnewline
\hline
\end{tabular}
%Source: https://freestatistics.org/blog/index.php?pk=69438&T=6

[TABLE]
[ROW][C]Meta Analysis of Goldfeld-Quandt test for Heteroskedasticity[/C][/ROW]
[ROW][C]Description[/C][C]# significant tests[/C][C]% significant tests[/C][C]OK/NOK[/C][/ROW]
[ROW][C]1% type I error level[/C][C]8[/C][C]0.296296296296296[/C][C]NOK[/C][/ROW]
[ROW][C]5% type I error level[/C][C]12[/C][C]0.444444444444444[/C][C]NOK[/C][/ROW]
[ROW][C]10% type I error level[/C][C]14[/C][C]0.518518518518518[/C][C]NOK[/C][/ROW]
[/TABLE]
Source: https://freestatistics.org/blog/index.php?pk=69438&T=6

Globally Unique Identifier (entire table): ba.freestatistics.org/blog/index.php?pk=69438&T=6

As an alternative you can also use a QR Code:  

The GUIDs for individual cells are displayed in the table below:

Meta Analysis of Goldfeld-Quandt test for Heteroskedasticity
Description# significant tests% significant testsOK/NOK
1% type I error level80.296296296296296NOK
5% type I error level120.444444444444444NOK
10% type I error level140.518518518518518NOK


Parameters (Session):
par1 = 1 ; par2 = Include Monthly Dummies ; par3 = Linear Trend ;
Parameters (R input):
par1 = 1 ; par2 = Include Monthly Dummies ; par3 = Linear Trend ;
R code (references can be found in the software module):
library(lattice)
library(lmtest)
n25 <- 25 #minimum number of obs. for Goldfeld-Quandt test
par1 <- as.numeric(par1)
x <- t(y)
k <- length(x[1,])
n <- length(x[,1])
x1 <- cbind(x[,par1], x[,1:k!=par1])
mycolnames <- c(colnames(x)[par1], colnames(x)[1:k!=par1])
colnames(x1) <- mycolnames #colnames(x)[par1]
x <- x1
if (par3 == 'First Differences'){
x2 <- array(0, dim=c(n-1,k), dimnames=list(1:(n-1), paste('(1-B)',colnames(x),sep='')))
for (i in 1:n-1) {
for (j in 1:k) {
x2[i,j] <- x[i+1,j] - x[i,j]
}
}
x <- x2
}
if (par2 == 'Include Monthly Dummies'){
x2 <- array(0, dim=c(n,11), dimnames=list(1:n, paste('M', seq(1:11), sep ='')))
for (i in 1:11){
x2[seq(i,n,12),i] <- 1
}
x <- cbind(x, x2)
}
if (par2 == 'Include Quarterly Dummies'){
x2 <- array(0, dim=c(n,3), dimnames=list(1:n, paste('Q', seq(1:3), sep ='')))
for (i in 1:3){
x2[seq(i,n,4),i] <- 1
}
x <- cbind(x, x2)
}
k <- length(x[1,])
if (par3 == 'Linear Trend'){
x <- cbind(x, c(1:n))
colnames(x)[k+1] <- 't'
}
x
k <- length(x[1,])
df <- as.data.frame(x)
(mylm <- lm(df))
(mysum <- summary(mylm))
if (n > n25) {
kp3 <- k + 3
nmkm3 <- n - k - 3
gqarr <- array(NA, dim=c(nmkm3-kp3+1,3))
numgqtests <- 0
numsignificant1 <- 0
numsignificant5 <- 0
numsignificant10 <- 0
for (mypoint in kp3:nmkm3) {
j <- 0
numgqtests <- numgqtests + 1
for (myalt in c('greater', 'two.sided', 'less')) {
j <- j + 1
gqarr[mypoint-kp3+1,j] <- gqtest(mylm, point=mypoint, alternative=myalt)$p.value
}
if (gqarr[mypoint-kp3+1,2] < 0.01) numsignificant1 <- numsignificant1 + 1
if (gqarr[mypoint-kp3+1,2] < 0.05) numsignificant5 <- numsignificant5 + 1
if (gqarr[mypoint-kp3+1,2] < 0.10) numsignificant10 <- numsignificant10 + 1
}
gqarr
}
bitmap(file='test0.png')
plot(x[,1], type='l', main='Actuals and Interpolation', ylab='value of Actuals and Interpolation (dots)', xlab='time or index')
points(x[,1]-mysum$resid)
grid()
dev.off()
bitmap(file='test1.png')
plot(mysum$resid, type='b', pch=19, main='Residuals', ylab='value of Residuals', xlab='time or index')
grid()
dev.off()
bitmap(file='test2.png')
hist(mysum$resid, main='Residual Histogram', xlab='values of Residuals')
grid()
dev.off()
bitmap(file='test3.png')
densityplot(~mysum$resid,col='black',main='Residual Density Plot', xlab='values of Residuals')
dev.off()
bitmap(file='test4.png')
qqnorm(mysum$resid, main='Residual Normal Q-Q Plot')
qqline(mysum$resid)
grid()
dev.off()
(myerror <- as.ts(mysum$resid))
bitmap(file='test5.png')
dum <- cbind(lag(myerror,k=1),myerror)
dum
dum1 <- dum[2:length(myerror),]
dum1
z <- as.data.frame(dum1)
z
plot(z,main=paste('Residual Lag plot, lowess, and regression line'), ylab='values of Residuals', xlab='lagged values of Residuals')
lines(lowess(z))
abline(lm(z))
grid()
dev.off()
bitmap(file='test6.png')
acf(mysum$resid, lag.max=length(mysum$resid)/2, main='Residual Autocorrelation Function')
grid()
dev.off()
bitmap(file='test7.png')
pacf(mysum$resid, lag.max=length(mysum$resid)/2, main='Residual Partial Autocorrelation Function')
grid()
dev.off()
bitmap(file='test8.png')
opar <- par(mfrow = c(2,2), oma = c(0, 0, 1.1, 0))
plot(mylm, las = 1, sub='Residual Diagnostics')
par(opar)
dev.off()
if (n > n25) {
bitmap(file='test9.png')
plot(kp3:nmkm3,gqarr[,2], main='Goldfeld-Quandt test',ylab='2-sided p-value',xlab='breakpoint')
grid()
dev.off()
}
load(file='createtable')
a<-table.start()
a<-table.row.start(a)
a<-table.element(a, 'Multiple Linear Regression - Estimated Regression Equation', 1, TRUE)
a<-table.row.end(a)
myeq <- colnames(x)[1]
myeq <- paste(myeq, '[t] = ', sep='')
for (i in 1:k){
if (mysum$coefficients[i,1] > 0) myeq <- paste(myeq, '+', '')
myeq <- paste(myeq, mysum$coefficients[i,1], sep=' ')
if (rownames(mysum$coefficients)[i] != '(Intercept)') {
myeq <- paste(myeq, rownames(mysum$coefficients)[i], sep='')
if (rownames(mysum$coefficients)[i] != 't') myeq <- paste(myeq, '[t]', sep='')
}
}
myeq <- paste(myeq, ' + e[t]')
a<-table.row.start(a)
a<-table.element(a, myeq)
a<-table.row.end(a)
a<-table.end(a)
table.save(a,file='mytable1.tab')
a<-table.start()
a<-table.row.start(a)
a<-table.element(a,hyperlink('ols1.htm','Multiple Linear Regression - Ordinary Least Squares',''), 6, TRUE)
a<-table.row.end(a)
a<-table.row.start(a)
a<-table.element(a,'Variable',header=TRUE)
a<-table.element(a,'Parameter',header=TRUE)
a<-table.element(a,'S.D.',header=TRUE)
a<-table.element(a,'T-STAT
H0: parameter = 0',header=TRUE)
a<-table.element(a,'2-tail p-value',header=TRUE)
a<-table.element(a,'1-tail p-value',header=TRUE)
a<-table.row.end(a)
for (i in 1:k){
a<-table.row.start(a)
a<-table.element(a,rownames(mysum$coefficients)[i],header=TRUE)
a<-table.element(a,mysum$coefficients[i,1])
a<-table.element(a, round(mysum$coefficients[i,2],6))
a<-table.element(a, round(mysum$coefficients[i,3],4))
a<-table.element(a, round(mysum$coefficients[i,4],6))
a<-table.element(a, round(mysum$coefficients[i,4]/2,6))
a<-table.row.end(a)
}
a<-table.end(a)
table.save(a,file='mytable2.tab')
a<-table.start()
a<-table.row.start(a)
a<-table.element(a, 'Multiple Linear Regression - Regression Statistics', 2, TRUE)
a<-table.row.end(a)
a<-table.row.start(a)
a<-table.element(a, 'Multiple R',1,TRUE)
a<-table.element(a, sqrt(mysum$r.squared))
a<-table.row.end(a)
a<-table.row.start(a)
a<-table.element(a, 'R-squared',1,TRUE)
a<-table.element(a, mysum$r.squared)
a<-table.row.end(a)
a<-table.row.start(a)
a<-table.element(a, 'Adjusted R-squared',1,TRUE)
a<-table.element(a, mysum$adj.r.squared)
a<-table.row.end(a)
a<-table.row.start(a)
a<-table.element(a, 'F-TEST (value)',1,TRUE)
a<-table.element(a, mysum$fstatistic[1])
a<-table.row.end(a)
a<-table.row.start(a)
a<-table.element(a, 'F-TEST (DF numerator)',1,TRUE)
a<-table.element(a, mysum$fstatistic[2])
a<-table.row.end(a)
a<-table.row.start(a)
a<-table.element(a, 'F-TEST (DF denominator)',1,TRUE)
a<-table.element(a, mysum$fstatistic[3])
a<-table.row.end(a)
a<-table.row.start(a)
a<-table.element(a, 'p-value',1,TRUE)
a<-table.element(a, 1-pf(mysum$fstatistic[1],mysum$fstatistic[2],mysum$fstatistic[3]))
a<-table.row.end(a)
a<-table.row.start(a)
a<-table.element(a, 'Multiple Linear Regression - Residual Statistics', 2, TRUE)
a<-table.row.end(a)
a<-table.row.start(a)
a<-table.element(a, 'Residual Standard Deviation',1,TRUE)
a<-table.element(a, mysum$sigma)
a<-table.row.end(a)
a<-table.row.start(a)
a<-table.element(a, 'Sum Squared Residuals',1,TRUE)
a<-table.element(a, sum(myerror*myerror))
a<-table.row.end(a)
a<-table.end(a)
table.save(a,file='mytable3.tab')
a<-table.start()
a<-table.row.start(a)
a<-table.element(a, 'Multiple Linear Regression - Actuals, Interpolation, and Residuals', 4, TRUE)
a<-table.row.end(a)
a<-table.row.start(a)
a<-table.element(a, 'Time or Index', 1, TRUE)
a<-table.element(a, 'Actuals', 1, TRUE)
a<-table.element(a, 'Interpolation
Forecast', 1, TRUE)
a<-table.element(a, 'Residuals
Prediction Error', 1, TRUE)
a<-table.row.end(a)
for (i in 1:n) {
a<-table.row.start(a)
a<-table.element(a,i, 1, TRUE)
a<-table.element(a,x[i])
a<-table.element(a,x[i]-mysum$resid[i])
a<-table.element(a,mysum$resid[i])
a<-table.row.end(a)
}
a<-table.end(a)
table.save(a,file='mytable4.tab')
if (n > n25) {
a<-table.start()
a<-table.row.start(a)
a<-table.element(a,'Goldfeld-Quandt test for Heteroskedasticity',4,TRUE)
a<-table.row.end(a)
a<-table.row.start(a)
a<-table.element(a,'p-values',header=TRUE)
a<-table.element(a,'Alternative Hypothesis',3,header=TRUE)
a<-table.row.end(a)
a<-table.row.start(a)
a<-table.element(a,'breakpoint index',header=TRUE)
a<-table.element(a,'greater',header=TRUE)
a<-table.element(a,'2-sided',header=TRUE)
a<-table.element(a,'less',header=TRUE)
a<-table.row.end(a)
for (mypoint in kp3:nmkm3) {
a<-table.row.start(a)
a<-table.element(a,mypoint,header=TRUE)
a<-table.element(a,gqarr[mypoint-kp3+1,1])
a<-table.element(a,gqarr[mypoint-kp3+1,2])
a<-table.element(a,gqarr[mypoint-kp3+1,3])
a<-table.row.end(a)
}
a<-table.end(a)
table.save(a,file='mytable5.tab')
a<-table.start()
a<-table.row.start(a)
a<-table.element(a,'Meta Analysis of Goldfeld-Quandt test for Heteroskedasticity',4,TRUE)
a<-table.row.end(a)
a<-table.row.start(a)
a<-table.element(a,'Description',header=TRUE)
a<-table.element(a,'# significant tests',header=TRUE)
a<-table.element(a,'% significant tests',header=TRUE)
a<-table.element(a,'OK/NOK',header=TRUE)
a<-table.row.end(a)
a<-table.row.start(a)
a<-table.element(a,'1% type I error level',header=TRUE)
a<-table.element(a,numsignificant1)
a<-table.element(a,numsignificant1/numgqtests)
if (numsignificant1/numgqtests < 0.01) dum <- 'OK' else dum <- 'NOK'
a<-table.element(a,dum)
a<-table.row.end(a)
a<-table.row.start(a)
a<-table.element(a,'5% type I error level',header=TRUE)
a<-table.element(a,numsignificant5)
a<-table.element(a,numsignificant5/numgqtests)
if (numsignificant5/numgqtests < 0.05) dum <- 'OK' else dum <- 'NOK'
a<-table.element(a,dum)
a<-table.row.end(a)
a<-table.row.start(a)
a<-table.element(a,'10% type I error level',header=TRUE)
a<-table.element(a,numsignificant10)
a<-table.element(a,numsignificant10/numgqtests)
if (numsignificant10/numgqtests < 0.1) dum <- 'OK' else dum <- 'NOK'
a<-table.element(a,dum)
a<-table.row.end(a)
a<-table.end(a)
table.save(a,file='mytable6.tab')
}