Free Statistics

of Irreproducible Research!

Author's title

Author*The author of this computation has been verified*
R Software Modulerwasp_arimaforecasting.wasp
Title produced by softwareARIMA Forecasting
Date of computationFri, 18 Dec 2009 14:28:30 -0700
Cite this page as followsStatistical Computations at FreeStatistics.org, Office for Research Development and Education, URL https://freestatistics.org/blog/index.php?v=date/2009/Dec/18/t12611717673tqxhodtovjo8o3.htm/, Retrieved Sat, 27 Apr 2024 13:00:51 +0000
Statistical Computations at FreeStatistics.org, Office for Research Development and Education, URL https://freestatistics.org/blog/index.php?pk=69454, Retrieved Sat, 27 Apr 2024 13:00:51 +0000
QR Codes:

Original text written by user:
IsPrivate?No (this computation is public)
User-defined keywords
Estimated Impact141
Family? (F = Feedback message, R = changed R code, M = changed R Module, P = changed Parameters, D = changed Data)
-     [ARIMA Forecasting] [] [2009-12-07 09:54:52] [b98453cac15ba1066b407e146608df68]
- R PD    [ARIMA Forecasting] [] [2009-12-18 21:28:30] [e76c6d261190c0179bc6006a5cdb804c] [Current]
Feedback Forum

Post a new message
Dataseries X:
359640
364080
364080
359640
359640
359640
359640
359640
364080
368520
372960
377400
406780
402050
392590
368940
368940
378400
406780
420970
420970
406780
392590
392590
394250
399000
403750
399000
408500
403750
403750
399000
403750
403750
403750
403750
405450
405450
405450
405450
410220
400680
386370
381600
381600
381600
381600
376830
381420
381420
386310
396090
391200
371640
356970
342300
332520
342300
347190
352080
357130
347070
337010
337010
331980


Summary of computational transaction
Raw Inputview raw input (R code)
Raw Outputview raw output of R engine
Computing time2 seconds
R Server'Gwilym Jenkins' @ 72.249.127.135

\begin{tabular}{lllllllll}
\hline
Summary of computational transaction \tabularnewline
Raw Input & view raw input (R code)  \tabularnewline
Raw Output & view raw output of R engine  \tabularnewline
Computing time & 2 seconds \tabularnewline
R Server & 'Gwilym Jenkins' @ 72.249.127.135 \tabularnewline
\hline
\end{tabular}
%Source: https://freestatistics.org/blog/index.php?pk=69454&T=0

[TABLE]
[ROW][C]Summary of computational transaction[/C][/ROW]
[ROW][C]Raw Input[/C][C]view raw input (R code) [/C][/ROW]
[ROW][C]Raw Output[/C][C]view raw output of R engine [/C][/ROW]
[ROW][C]Computing time[/C][C]2 seconds[/C][/ROW]
[ROW][C]R Server[/C][C]'Gwilym Jenkins' @ 72.249.127.135[/C][/ROW]
[/TABLE]
Source: https://freestatistics.org/blog/index.php?pk=69454&T=0

Globally Unique Identifier (entire table): ba.freestatistics.org/blog/index.php?pk=69454&T=0

As an alternative you can also use a QR Code:  

The GUIDs for individual cells are displayed in the table below:

Summary of computational transaction
Raw Inputview raw input (R code)
Raw Outputview raw output of R engine
Computing time2 seconds
R Server'Gwilym Jenkins' @ 72.249.127.135


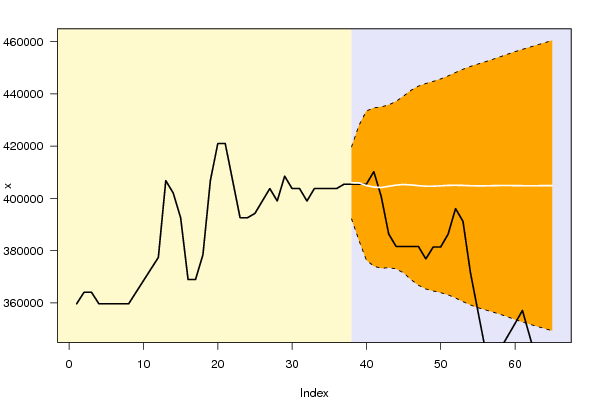
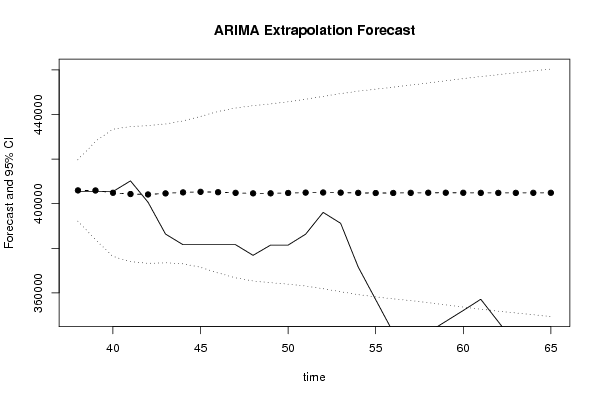
Univariate ARIMA Extrapolation Forecast
timeY[t]F[t]95% LB95% UBp-value(H0: Y[t] = F[t])P(F[t]>Y[t-1])P(F[t]>Y[t-s])P(F[t]>Y[37])
25394250-------
26399000-------
27403750-------
28399000-------
29408500-------
30403750-------
31403750-------
32399000-------
33403750-------
34403750-------
35403750-------
36403750-------
37405450-------
38405450405950.2501392171.7618419728.73840.47160.52840.83860.5284
39405450405917.5792383900.9414427934.2170.48340.51660.57650.5166
40405450404890.3454376346.7675433433.92340.48470.48470.65710.4847
41410220404319.501374026.0821434612.91990.35130.47080.39340.4708
42400680404132.7509373247.6986435017.80320.41330.34960.50970.4667
43386370404615.6888373476.0959435755.28180.12540.59780.52170.4791
44381600405058.9435373008.5049437109.38220.07570.87350.64450.4905
45381600405307.3295371485.5848439129.07430.08470.91530.5360.4967
46381600405133.4634368905.7529441361.17390.10150.89850.52980.4932
47381600404851.4703366759.5168442943.42390.11580.88420.52260.4877
48376830404628.0525365307.0789443949.02610.08290.87450.51750.4837
49381420404647.1719364532.9964444761.34750.12820.9130.48440.4844
50381420404797.5816363894.6678445700.49540.13130.86870.48750.4875
51386310404963.4051363073.9135446852.89670.19140.86470.49090.4909
52396090405006.7654361862.3108448151.22010.34270.80220.4920.492
53391200404943.8305360489.0017449398.65920.27230.65190.4080.4911
54371640404837.0541359203.1328450470.97540.0770.7210.57090.4895
55356970404780.1434358167.8638451392.42310.02220.91830.78060.4888
56342300404793.8231357312.605452275.04120.00490.97580.83080.4892
57332520404853.6975356508.2195453199.17550.00170.99440.82710.4904
58342300404902.5172355625.0325454180.00190.00640.9980.8230.4913
59347190404911.4986354646.0792455176.91790.01220.99270.81830.4916
60352080404883.3918353630.7074456136.07630.02170.98630.85830.4914
61357130404849.038352665.0695457033.00640.03650.97630.81060.491
62347070404833.131351781.4723457884.78960.01640.9610.80650.4909
63337010404842.503350960.6973458724.30860.00680.98220.74990.4912
64337010404863.2979350153.8804459572.71550.00750.99250.62340.4916
65331980404878.3309349327.3695460429.29220.00510.99170.68530.492

\begin{tabular}{lllllllll}
\hline
Univariate ARIMA Extrapolation Forecast \tabularnewline
time & Y[t] & F[t] & 95% LB & 95% UB & p-value(H0: Y[t] = F[t]) & P(F[t]>Y[t-1]) & P(F[t]>Y[t-s]) & P(F[t]>Y[37]) \tabularnewline
25 & 394250 & - & - & - & - & - & - & - \tabularnewline
26 & 399000 & - & - & - & - & - & - & - \tabularnewline
27 & 403750 & - & - & - & - & - & - & - \tabularnewline
28 & 399000 & - & - & - & - & - & - & - \tabularnewline
29 & 408500 & - & - & - & - & - & - & - \tabularnewline
30 & 403750 & - & - & - & - & - & - & - \tabularnewline
31 & 403750 & - & - & - & - & - & - & - \tabularnewline
32 & 399000 & - & - & - & - & - & - & - \tabularnewline
33 & 403750 & - & - & - & - & - & - & - \tabularnewline
34 & 403750 & - & - & - & - & - & - & - \tabularnewline
35 & 403750 & - & - & - & - & - & - & - \tabularnewline
36 & 403750 & - & - & - & - & - & - & - \tabularnewline
37 & 405450 & - & - & - & - & - & - & - \tabularnewline
38 & 405450 & 405950.2501 & 392171.7618 & 419728.7384 & 0.4716 & 0.5284 & 0.8386 & 0.5284 \tabularnewline
39 & 405450 & 405917.5792 & 383900.9414 & 427934.217 & 0.4834 & 0.5166 & 0.5765 & 0.5166 \tabularnewline
40 & 405450 & 404890.3454 & 376346.7675 & 433433.9234 & 0.4847 & 0.4847 & 0.6571 & 0.4847 \tabularnewline
41 & 410220 & 404319.501 & 374026.0821 & 434612.9199 & 0.3513 & 0.4708 & 0.3934 & 0.4708 \tabularnewline
42 & 400680 & 404132.7509 & 373247.6986 & 435017.8032 & 0.4133 & 0.3496 & 0.5097 & 0.4667 \tabularnewline
43 & 386370 & 404615.6888 & 373476.0959 & 435755.2818 & 0.1254 & 0.5978 & 0.5217 & 0.4791 \tabularnewline
44 & 381600 & 405058.9435 & 373008.5049 & 437109.3822 & 0.0757 & 0.8735 & 0.6445 & 0.4905 \tabularnewline
45 & 381600 & 405307.3295 & 371485.5848 & 439129.0743 & 0.0847 & 0.9153 & 0.536 & 0.4967 \tabularnewline
46 & 381600 & 405133.4634 & 368905.7529 & 441361.1739 & 0.1015 & 0.8985 & 0.5298 & 0.4932 \tabularnewline
47 & 381600 & 404851.4703 & 366759.5168 & 442943.4239 & 0.1158 & 0.8842 & 0.5226 & 0.4877 \tabularnewline
48 & 376830 & 404628.0525 & 365307.0789 & 443949.0261 & 0.0829 & 0.8745 & 0.5175 & 0.4837 \tabularnewline
49 & 381420 & 404647.1719 & 364532.9964 & 444761.3475 & 0.1282 & 0.913 & 0.4844 & 0.4844 \tabularnewline
50 & 381420 & 404797.5816 & 363894.6678 & 445700.4954 & 0.1313 & 0.8687 & 0.4875 & 0.4875 \tabularnewline
51 & 386310 & 404963.4051 & 363073.9135 & 446852.8967 & 0.1914 & 0.8647 & 0.4909 & 0.4909 \tabularnewline
52 & 396090 & 405006.7654 & 361862.3108 & 448151.2201 & 0.3427 & 0.8022 & 0.492 & 0.492 \tabularnewline
53 & 391200 & 404943.8305 & 360489.0017 & 449398.6592 & 0.2723 & 0.6519 & 0.408 & 0.4911 \tabularnewline
54 & 371640 & 404837.0541 & 359203.1328 & 450470.9754 & 0.077 & 0.721 & 0.5709 & 0.4895 \tabularnewline
55 & 356970 & 404780.1434 & 358167.8638 & 451392.4231 & 0.0222 & 0.9183 & 0.7806 & 0.4888 \tabularnewline
56 & 342300 & 404793.8231 & 357312.605 & 452275.0412 & 0.0049 & 0.9758 & 0.8308 & 0.4892 \tabularnewline
57 & 332520 & 404853.6975 & 356508.2195 & 453199.1755 & 0.0017 & 0.9944 & 0.8271 & 0.4904 \tabularnewline
58 & 342300 & 404902.5172 & 355625.0325 & 454180.0019 & 0.0064 & 0.998 & 0.823 & 0.4913 \tabularnewline
59 & 347190 & 404911.4986 & 354646.0792 & 455176.9179 & 0.0122 & 0.9927 & 0.8183 & 0.4916 \tabularnewline
60 & 352080 & 404883.3918 & 353630.7074 & 456136.0763 & 0.0217 & 0.9863 & 0.8583 & 0.4914 \tabularnewline
61 & 357130 & 404849.038 & 352665.0695 & 457033.0064 & 0.0365 & 0.9763 & 0.8106 & 0.491 \tabularnewline
62 & 347070 & 404833.131 & 351781.4723 & 457884.7896 & 0.0164 & 0.961 & 0.8065 & 0.4909 \tabularnewline
63 & 337010 & 404842.503 & 350960.6973 & 458724.3086 & 0.0068 & 0.9822 & 0.7499 & 0.4912 \tabularnewline
64 & 337010 & 404863.2979 & 350153.8804 & 459572.7155 & 0.0075 & 0.9925 & 0.6234 & 0.4916 \tabularnewline
65 & 331980 & 404878.3309 & 349327.3695 & 460429.2922 & 0.0051 & 0.9917 & 0.6853 & 0.492 \tabularnewline
\hline
\end{tabular}
%Source: https://freestatistics.org/blog/index.php?pk=69454&T=1

[TABLE]
[ROW][C]Univariate ARIMA Extrapolation Forecast[/C][/ROW]
[ROW][C]time[/C][C]Y[t][/C][C]F[t][/C][C]95% LB[/C][C]95% UB[/C][C]p-value(H0: Y[t] = F[t])[/C][C]P(F[t]>Y[t-1])[/C][C]P(F[t]>Y[t-s])[/C][C]P(F[t]>Y[37])[/C][/ROW]
[ROW][C]25[/C][C]394250[/C][C]-[/C][C]-[/C][C]-[/C][C]-[/C][C]-[/C][C]-[/C][C]-[/C][/ROW]
[ROW][C]26[/C][C]399000[/C][C]-[/C][C]-[/C][C]-[/C][C]-[/C][C]-[/C][C]-[/C][C]-[/C][/ROW]
[ROW][C]27[/C][C]403750[/C][C]-[/C][C]-[/C][C]-[/C][C]-[/C][C]-[/C][C]-[/C][C]-[/C][/ROW]
[ROW][C]28[/C][C]399000[/C][C]-[/C][C]-[/C][C]-[/C][C]-[/C][C]-[/C][C]-[/C][C]-[/C][/ROW]
[ROW][C]29[/C][C]408500[/C][C]-[/C][C]-[/C][C]-[/C][C]-[/C][C]-[/C][C]-[/C][C]-[/C][/ROW]
[ROW][C]30[/C][C]403750[/C][C]-[/C][C]-[/C][C]-[/C][C]-[/C][C]-[/C][C]-[/C][C]-[/C][/ROW]
[ROW][C]31[/C][C]403750[/C][C]-[/C][C]-[/C][C]-[/C][C]-[/C][C]-[/C][C]-[/C][C]-[/C][/ROW]
[ROW][C]32[/C][C]399000[/C][C]-[/C][C]-[/C][C]-[/C][C]-[/C][C]-[/C][C]-[/C][C]-[/C][/ROW]
[ROW][C]33[/C][C]403750[/C][C]-[/C][C]-[/C][C]-[/C][C]-[/C][C]-[/C][C]-[/C][C]-[/C][/ROW]
[ROW][C]34[/C][C]403750[/C][C]-[/C][C]-[/C][C]-[/C][C]-[/C][C]-[/C][C]-[/C][C]-[/C][/ROW]
[ROW][C]35[/C][C]403750[/C][C]-[/C][C]-[/C][C]-[/C][C]-[/C][C]-[/C][C]-[/C][C]-[/C][/ROW]
[ROW][C]36[/C][C]403750[/C][C]-[/C][C]-[/C][C]-[/C][C]-[/C][C]-[/C][C]-[/C][C]-[/C][/ROW]
[ROW][C]37[/C][C]405450[/C][C]-[/C][C]-[/C][C]-[/C][C]-[/C][C]-[/C][C]-[/C][C]-[/C][/ROW]
[ROW][C]38[/C][C]405450[/C][C]405950.2501[/C][C]392171.7618[/C][C]419728.7384[/C][C]0.4716[/C][C]0.5284[/C][C]0.8386[/C][C]0.5284[/C][/ROW]
[ROW][C]39[/C][C]405450[/C][C]405917.5792[/C][C]383900.9414[/C][C]427934.217[/C][C]0.4834[/C][C]0.5166[/C][C]0.5765[/C][C]0.5166[/C][/ROW]
[ROW][C]40[/C][C]405450[/C][C]404890.3454[/C][C]376346.7675[/C][C]433433.9234[/C][C]0.4847[/C][C]0.4847[/C][C]0.6571[/C][C]0.4847[/C][/ROW]
[ROW][C]41[/C][C]410220[/C][C]404319.501[/C][C]374026.0821[/C][C]434612.9199[/C][C]0.3513[/C][C]0.4708[/C][C]0.3934[/C][C]0.4708[/C][/ROW]
[ROW][C]42[/C][C]400680[/C][C]404132.7509[/C][C]373247.6986[/C][C]435017.8032[/C][C]0.4133[/C][C]0.3496[/C][C]0.5097[/C][C]0.4667[/C][/ROW]
[ROW][C]43[/C][C]386370[/C][C]404615.6888[/C][C]373476.0959[/C][C]435755.2818[/C][C]0.1254[/C][C]0.5978[/C][C]0.5217[/C][C]0.4791[/C][/ROW]
[ROW][C]44[/C][C]381600[/C][C]405058.9435[/C][C]373008.5049[/C][C]437109.3822[/C][C]0.0757[/C][C]0.8735[/C][C]0.6445[/C][C]0.4905[/C][/ROW]
[ROW][C]45[/C][C]381600[/C][C]405307.3295[/C][C]371485.5848[/C][C]439129.0743[/C][C]0.0847[/C][C]0.9153[/C][C]0.536[/C][C]0.4967[/C][/ROW]
[ROW][C]46[/C][C]381600[/C][C]405133.4634[/C][C]368905.7529[/C][C]441361.1739[/C][C]0.1015[/C][C]0.8985[/C][C]0.5298[/C][C]0.4932[/C][/ROW]
[ROW][C]47[/C][C]381600[/C][C]404851.4703[/C][C]366759.5168[/C][C]442943.4239[/C][C]0.1158[/C][C]0.8842[/C][C]0.5226[/C][C]0.4877[/C][/ROW]
[ROW][C]48[/C][C]376830[/C][C]404628.0525[/C][C]365307.0789[/C][C]443949.0261[/C][C]0.0829[/C][C]0.8745[/C][C]0.5175[/C][C]0.4837[/C][/ROW]
[ROW][C]49[/C][C]381420[/C][C]404647.1719[/C][C]364532.9964[/C][C]444761.3475[/C][C]0.1282[/C][C]0.913[/C][C]0.4844[/C][C]0.4844[/C][/ROW]
[ROW][C]50[/C][C]381420[/C][C]404797.5816[/C][C]363894.6678[/C][C]445700.4954[/C][C]0.1313[/C][C]0.8687[/C][C]0.4875[/C][C]0.4875[/C][/ROW]
[ROW][C]51[/C][C]386310[/C][C]404963.4051[/C][C]363073.9135[/C][C]446852.8967[/C][C]0.1914[/C][C]0.8647[/C][C]0.4909[/C][C]0.4909[/C][/ROW]
[ROW][C]52[/C][C]396090[/C][C]405006.7654[/C][C]361862.3108[/C][C]448151.2201[/C][C]0.3427[/C][C]0.8022[/C][C]0.492[/C][C]0.492[/C][/ROW]
[ROW][C]53[/C][C]391200[/C][C]404943.8305[/C][C]360489.0017[/C][C]449398.6592[/C][C]0.2723[/C][C]0.6519[/C][C]0.408[/C][C]0.4911[/C][/ROW]
[ROW][C]54[/C][C]371640[/C][C]404837.0541[/C][C]359203.1328[/C][C]450470.9754[/C][C]0.077[/C][C]0.721[/C][C]0.5709[/C][C]0.4895[/C][/ROW]
[ROW][C]55[/C][C]356970[/C][C]404780.1434[/C][C]358167.8638[/C][C]451392.4231[/C][C]0.0222[/C][C]0.9183[/C][C]0.7806[/C][C]0.4888[/C][/ROW]
[ROW][C]56[/C][C]342300[/C][C]404793.8231[/C][C]357312.605[/C][C]452275.0412[/C][C]0.0049[/C][C]0.9758[/C][C]0.8308[/C][C]0.4892[/C][/ROW]
[ROW][C]57[/C][C]332520[/C][C]404853.6975[/C][C]356508.2195[/C][C]453199.1755[/C][C]0.0017[/C][C]0.9944[/C][C]0.8271[/C][C]0.4904[/C][/ROW]
[ROW][C]58[/C][C]342300[/C][C]404902.5172[/C][C]355625.0325[/C][C]454180.0019[/C][C]0.0064[/C][C]0.998[/C][C]0.823[/C][C]0.4913[/C][/ROW]
[ROW][C]59[/C][C]347190[/C][C]404911.4986[/C][C]354646.0792[/C][C]455176.9179[/C][C]0.0122[/C][C]0.9927[/C][C]0.8183[/C][C]0.4916[/C][/ROW]
[ROW][C]60[/C][C]352080[/C][C]404883.3918[/C][C]353630.7074[/C][C]456136.0763[/C][C]0.0217[/C][C]0.9863[/C][C]0.8583[/C][C]0.4914[/C][/ROW]
[ROW][C]61[/C][C]357130[/C][C]404849.038[/C][C]352665.0695[/C][C]457033.0064[/C][C]0.0365[/C][C]0.9763[/C][C]0.8106[/C][C]0.491[/C][/ROW]
[ROW][C]62[/C][C]347070[/C][C]404833.131[/C][C]351781.4723[/C][C]457884.7896[/C][C]0.0164[/C][C]0.961[/C][C]0.8065[/C][C]0.4909[/C][/ROW]
[ROW][C]63[/C][C]337010[/C][C]404842.503[/C][C]350960.6973[/C][C]458724.3086[/C][C]0.0068[/C][C]0.9822[/C][C]0.7499[/C][C]0.4912[/C][/ROW]
[ROW][C]64[/C][C]337010[/C][C]404863.2979[/C][C]350153.8804[/C][C]459572.7155[/C][C]0.0075[/C][C]0.9925[/C][C]0.6234[/C][C]0.4916[/C][/ROW]
[ROW][C]65[/C][C]331980[/C][C]404878.3309[/C][C]349327.3695[/C][C]460429.2922[/C][C]0.0051[/C][C]0.9917[/C][C]0.6853[/C][C]0.492[/C][/ROW]
[/TABLE]
Source: https://freestatistics.org/blog/index.php?pk=69454&T=1

Globally Unique Identifier (entire table): ba.freestatistics.org/blog/index.php?pk=69454&T=1

As an alternative you can also use a QR Code:  

The GUIDs for individual cells are displayed in the table below:

Univariate ARIMA Extrapolation Forecast
timeY[t]F[t]95% LB95% UBp-value(H0: Y[t] = F[t])P(F[t]>Y[t-1])P(F[t]>Y[t-s])P(F[t]>Y[37])
25394250-------
26399000-------
27403750-------
28399000-------
29408500-------
30403750-------
31403750-------
32399000-------
33403750-------
34403750-------
35403750-------
36403750-------
37405450-------
38405450405950.2501392171.7618419728.73840.47160.52840.83860.5284
39405450405917.5792383900.9414427934.2170.48340.51660.57650.5166
40405450404890.3454376346.7675433433.92340.48470.48470.65710.4847
41410220404319.501374026.0821434612.91990.35130.47080.39340.4708
42400680404132.7509373247.6986435017.80320.41330.34960.50970.4667
43386370404615.6888373476.0959435755.28180.12540.59780.52170.4791
44381600405058.9435373008.5049437109.38220.07570.87350.64450.4905
45381600405307.3295371485.5848439129.07430.08470.91530.5360.4967
46381600405133.4634368905.7529441361.17390.10150.89850.52980.4932
47381600404851.4703366759.5168442943.42390.11580.88420.52260.4877
48376830404628.0525365307.0789443949.02610.08290.87450.51750.4837
49381420404647.1719364532.9964444761.34750.12820.9130.48440.4844
50381420404797.5816363894.6678445700.49540.13130.86870.48750.4875
51386310404963.4051363073.9135446852.89670.19140.86470.49090.4909
52396090405006.7654361862.3108448151.22010.34270.80220.4920.492
53391200404943.8305360489.0017449398.65920.27230.65190.4080.4911
54371640404837.0541359203.1328450470.97540.0770.7210.57090.4895
55356970404780.1434358167.8638451392.42310.02220.91830.78060.4888
56342300404793.8231357312.605452275.04120.00490.97580.83080.4892
57332520404853.6975356508.2195453199.17550.00170.99440.82710.4904
58342300404902.5172355625.0325454180.00190.00640.9980.8230.4913
59347190404911.4986354646.0792455176.91790.01220.99270.81830.4916
60352080404883.3918353630.7074456136.07630.02170.98630.85830.4914
61357130404849.038352665.0695457033.00640.03650.97630.81060.491
62347070404833.131351781.4723457884.78960.01640.9610.80650.4909
63337010404842.503350960.6973458724.30860.00680.98220.74990.4912
64337010404863.2979350153.8804459572.71550.00750.99250.62340.4916
65331980404878.3309349327.3695460429.29220.00510.99170.68530.492


Univariate ARIMA Extrapolation Forecast Performance
time% S.E.PEMAPESq.EMSERMSE
380.0173-0.00120250250.143900
390.0277-0.00120.0012218630.33234440.2369484.1903
400.0360.00140.0013313213.2417260697.9052510.5858
410.03820.01460.004634815888.88998899495.65142983.2022
420.039-0.00850.005411921488.72489503894.26613082.8387
430.0393-0.04510.012332905161.403663404105.45567962.6695
440.0404-0.05790.0186550322030.6137132963809.049711530.9934
450.0426-0.05850.0236562037474.2529186598017.200113660.0885
460.0456-0.05810.0274553823899.2911227400892.98815079.8174
470.048-0.05740.0304540630872.5748258723890.946616084.8964
480.0496-0.06870.0339772731722.0958305451875.596617477.1816
490.0506-0.05740.0358539501516.273324956012.319618026.5363
500.0516-0.05780.0375546511319.3727341998728.246818493.2076
510.0528-0.04610.0381347949521.542342423784.910718504.6963
520.0544-0.0220.037179508705.8695324896112.974618024.8748
530.056-0.03390.0369188892875.5972316395910.638517787.5212
540.0575-0.0820.03951102044399.8308362610527.649819042.3351
550.0588-0.11810.04392285809814.3374469454932.465821666.9087
560.0598-0.15440.04973905477926.0211650298247.916125500.946
570.0609-0.17870.05615232163795.3625879391525.288429654.5363
580.0621-0.15460.06083919075160.76471024138365.07332002.1619
590.0633-0.14260.06463331771396.04221129030775.571633601.0532
600.0646-0.13040.06742788198189.35361201168489.214334657.8777
610.0658-0.11790.06952277106584.15371245999243.170135298.7145
620.0669-0.14270.07243336579297.22611329622445.332336463.9883
630.0679-0.16760.07614601248459.60881455454215.112238150.4157
640.0689-0.16760.07954604070041.07571572069616.073839649.3331
650.07-0.180.08315314166640.87911705715938.388341300.314

\begin{tabular}{lllllllll}
\hline
Univariate ARIMA Extrapolation Forecast Performance \tabularnewline
time & % S.E. & PE & MAPE & Sq.E & MSE & RMSE \tabularnewline
38 & 0.0173 & -0.0012 & 0 & 250250.1439 & 0 & 0 \tabularnewline
39 & 0.0277 & -0.0012 & 0.0012 & 218630.33 & 234440.2369 & 484.1903 \tabularnewline
40 & 0.036 & 0.0014 & 0.0013 & 313213.2417 & 260697.9052 & 510.5858 \tabularnewline
41 & 0.0382 & 0.0146 & 0.0046 & 34815888.8899 & 8899495.6514 & 2983.2022 \tabularnewline
42 & 0.039 & -0.0085 & 0.0054 & 11921488.7248 & 9503894.2661 & 3082.8387 \tabularnewline
43 & 0.0393 & -0.0451 & 0.012 & 332905161.4036 & 63404105.4556 & 7962.6695 \tabularnewline
44 & 0.0404 & -0.0579 & 0.0186 & 550322030.6137 & 132963809.0497 & 11530.9934 \tabularnewline
45 & 0.0426 & -0.0585 & 0.0236 & 562037474.2529 & 186598017.2001 & 13660.0885 \tabularnewline
46 & 0.0456 & -0.0581 & 0.0274 & 553823899.2911 & 227400892.988 & 15079.8174 \tabularnewline
47 & 0.048 & -0.0574 & 0.0304 & 540630872.5748 & 258723890.9466 & 16084.8964 \tabularnewline
48 & 0.0496 & -0.0687 & 0.0339 & 772731722.0958 & 305451875.5966 & 17477.1816 \tabularnewline
49 & 0.0506 & -0.0574 & 0.0358 & 539501516.273 & 324956012.3196 & 18026.5363 \tabularnewline
50 & 0.0516 & -0.0578 & 0.0375 & 546511319.3727 & 341998728.2468 & 18493.2076 \tabularnewline
51 & 0.0528 & -0.0461 & 0.0381 & 347949521.542 & 342423784.9107 & 18504.6963 \tabularnewline
52 & 0.0544 & -0.022 & 0.0371 & 79508705.8695 & 324896112.9746 & 18024.8748 \tabularnewline
53 & 0.056 & -0.0339 & 0.0369 & 188892875.5972 & 316395910.6385 & 17787.5212 \tabularnewline
54 & 0.0575 & -0.082 & 0.0395 & 1102044399.8308 & 362610527.6498 & 19042.3351 \tabularnewline
55 & 0.0588 & -0.1181 & 0.0439 & 2285809814.3374 & 469454932.4658 & 21666.9087 \tabularnewline
56 & 0.0598 & -0.1544 & 0.0497 & 3905477926.0211 & 650298247.9161 & 25500.946 \tabularnewline
57 & 0.0609 & -0.1787 & 0.0561 & 5232163795.3625 & 879391525.2884 & 29654.5363 \tabularnewline
58 & 0.0621 & -0.1546 & 0.0608 & 3919075160.7647 & 1024138365.073 & 32002.1619 \tabularnewline
59 & 0.0633 & -0.1426 & 0.0646 & 3331771396.0422 & 1129030775.5716 & 33601.0532 \tabularnewline
60 & 0.0646 & -0.1304 & 0.0674 & 2788198189.3536 & 1201168489.2143 & 34657.8777 \tabularnewline
61 & 0.0658 & -0.1179 & 0.0695 & 2277106584.1537 & 1245999243.1701 & 35298.7145 \tabularnewline
62 & 0.0669 & -0.1427 & 0.0724 & 3336579297.2261 & 1329622445.3323 & 36463.9883 \tabularnewline
63 & 0.0679 & -0.1676 & 0.0761 & 4601248459.6088 & 1455454215.1122 & 38150.4157 \tabularnewline
64 & 0.0689 & -0.1676 & 0.0795 & 4604070041.0757 & 1572069616.0738 & 39649.3331 \tabularnewline
65 & 0.07 & -0.18 & 0.0831 & 5314166640.8791 & 1705715938.3883 & 41300.314 \tabularnewline
\hline
\end{tabular}
%Source: https://freestatistics.org/blog/index.php?pk=69454&T=2

[TABLE]
[ROW][C]Univariate ARIMA Extrapolation Forecast Performance[/C][/ROW]
[ROW][C]time[/C][C]% S.E.[/C][C]PE[/C][C]MAPE[/C][C]Sq.E[/C][C]MSE[/C][C]RMSE[/C][/ROW]
[ROW][C]38[/C][C]0.0173[/C][C]-0.0012[/C][C]0[/C][C]250250.1439[/C][C]0[/C][C]0[/C][/ROW]
[ROW][C]39[/C][C]0.0277[/C][C]-0.0012[/C][C]0.0012[/C][C]218630.33[/C][C]234440.2369[/C][C]484.1903[/C][/ROW]
[ROW][C]40[/C][C]0.036[/C][C]0.0014[/C][C]0.0013[/C][C]313213.2417[/C][C]260697.9052[/C][C]510.5858[/C][/ROW]
[ROW][C]41[/C][C]0.0382[/C][C]0.0146[/C][C]0.0046[/C][C]34815888.8899[/C][C]8899495.6514[/C][C]2983.2022[/C][/ROW]
[ROW][C]42[/C][C]0.039[/C][C]-0.0085[/C][C]0.0054[/C][C]11921488.7248[/C][C]9503894.2661[/C][C]3082.8387[/C][/ROW]
[ROW][C]43[/C][C]0.0393[/C][C]-0.0451[/C][C]0.012[/C][C]332905161.4036[/C][C]63404105.4556[/C][C]7962.6695[/C][/ROW]
[ROW][C]44[/C][C]0.0404[/C][C]-0.0579[/C][C]0.0186[/C][C]550322030.6137[/C][C]132963809.0497[/C][C]11530.9934[/C][/ROW]
[ROW][C]45[/C][C]0.0426[/C][C]-0.0585[/C][C]0.0236[/C][C]562037474.2529[/C][C]186598017.2001[/C][C]13660.0885[/C][/ROW]
[ROW][C]46[/C][C]0.0456[/C][C]-0.0581[/C][C]0.0274[/C][C]553823899.2911[/C][C]227400892.988[/C][C]15079.8174[/C][/ROW]
[ROW][C]47[/C][C]0.048[/C][C]-0.0574[/C][C]0.0304[/C][C]540630872.5748[/C][C]258723890.9466[/C][C]16084.8964[/C][/ROW]
[ROW][C]48[/C][C]0.0496[/C][C]-0.0687[/C][C]0.0339[/C][C]772731722.0958[/C][C]305451875.5966[/C][C]17477.1816[/C][/ROW]
[ROW][C]49[/C][C]0.0506[/C][C]-0.0574[/C][C]0.0358[/C][C]539501516.273[/C][C]324956012.3196[/C][C]18026.5363[/C][/ROW]
[ROW][C]50[/C][C]0.0516[/C][C]-0.0578[/C][C]0.0375[/C][C]546511319.3727[/C][C]341998728.2468[/C][C]18493.2076[/C][/ROW]
[ROW][C]51[/C][C]0.0528[/C][C]-0.0461[/C][C]0.0381[/C][C]347949521.542[/C][C]342423784.9107[/C][C]18504.6963[/C][/ROW]
[ROW][C]52[/C][C]0.0544[/C][C]-0.022[/C][C]0.0371[/C][C]79508705.8695[/C][C]324896112.9746[/C][C]18024.8748[/C][/ROW]
[ROW][C]53[/C][C]0.056[/C][C]-0.0339[/C][C]0.0369[/C][C]188892875.5972[/C][C]316395910.6385[/C][C]17787.5212[/C][/ROW]
[ROW][C]54[/C][C]0.0575[/C][C]-0.082[/C][C]0.0395[/C][C]1102044399.8308[/C][C]362610527.6498[/C][C]19042.3351[/C][/ROW]
[ROW][C]55[/C][C]0.0588[/C][C]-0.1181[/C][C]0.0439[/C][C]2285809814.3374[/C][C]469454932.4658[/C][C]21666.9087[/C][/ROW]
[ROW][C]56[/C][C]0.0598[/C][C]-0.1544[/C][C]0.0497[/C][C]3905477926.0211[/C][C]650298247.9161[/C][C]25500.946[/C][/ROW]
[ROW][C]57[/C][C]0.0609[/C][C]-0.1787[/C][C]0.0561[/C][C]5232163795.3625[/C][C]879391525.2884[/C][C]29654.5363[/C][/ROW]
[ROW][C]58[/C][C]0.0621[/C][C]-0.1546[/C][C]0.0608[/C][C]3919075160.7647[/C][C]1024138365.073[/C][C]32002.1619[/C][/ROW]
[ROW][C]59[/C][C]0.0633[/C][C]-0.1426[/C][C]0.0646[/C][C]3331771396.0422[/C][C]1129030775.5716[/C][C]33601.0532[/C][/ROW]
[ROW][C]60[/C][C]0.0646[/C][C]-0.1304[/C][C]0.0674[/C][C]2788198189.3536[/C][C]1201168489.2143[/C][C]34657.8777[/C][/ROW]
[ROW][C]61[/C][C]0.0658[/C][C]-0.1179[/C][C]0.0695[/C][C]2277106584.1537[/C][C]1245999243.1701[/C][C]35298.7145[/C][/ROW]
[ROW][C]62[/C][C]0.0669[/C][C]-0.1427[/C][C]0.0724[/C][C]3336579297.2261[/C][C]1329622445.3323[/C][C]36463.9883[/C][/ROW]
[ROW][C]63[/C][C]0.0679[/C][C]-0.1676[/C][C]0.0761[/C][C]4601248459.6088[/C][C]1455454215.1122[/C][C]38150.4157[/C][/ROW]
[ROW][C]64[/C][C]0.0689[/C][C]-0.1676[/C][C]0.0795[/C][C]4604070041.0757[/C][C]1572069616.0738[/C][C]39649.3331[/C][/ROW]
[ROW][C]65[/C][C]0.07[/C][C]-0.18[/C][C]0.0831[/C][C]5314166640.8791[/C][C]1705715938.3883[/C][C]41300.314[/C][/ROW]
[/TABLE]
Source: https://freestatistics.org/blog/index.php?pk=69454&T=2

Globally Unique Identifier (entire table): ba.freestatistics.org/blog/index.php?pk=69454&T=2

As an alternative you can also use a QR Code:  

The GUIDs for individual cells are displayed in the table below:

Univariate ARIMA Extrapolation Forecast Performance
time% S.E.PEMAPESq.EMSERMSE
380.0173-0.00120250250.143900
390.0277-0.00120.0012218630.33234440.2369484.1903
400.0360.00140.0013313213.2417260697.9052510.5858
410.03820.01460.004634815888.88998899495.65142983.2022
420.039-0.00850.005411921488.72489503894.26613082.8387
430.0393-0.04510.012332905161.403663404105.45567962.6695
440.0404-0.05790.0186550322030.6137132963809.049711530.9934
450.0426-0.05850.0236562037474.2529186598017.200113660.0885
460.0456-0.05810.0274553823899.2911227400892.98815079.8174
470.048-0.05740.0304540630872.5748258723890.946616084.8964
480.0496-0.06870.0339772731722.0958305451875.596617477.1816
490.0506-0.05740.0358539501516.273324956012.319618026.5363
500.0516-0.05780.0375546511319.3727341998728.246818493.2076
510.0528-0.04610.0381347949521.542342423784.910718504.6963
520.0544-0.0220.037179508705.8695324896112.974618024.8748
530.056-0.03390.0369188892875.5972316395910.638517787.5212
540.0575-0.0820.03951102044399.8308362610527.649819042.3351
550.0588-0.11810.04392285809814.3374469454932.465821666.9087
560.0598-0.15440.04973905477926.0211650298247.916125500.946
570.0609-0.17870.05615232163795.3625879391525.288429654.5363
580.0621-0.15460.06083919075160.76471024138365.07332002.1619
590.0633-0.14260.06463331771396.04221129030775.571633601.0532
600.0646-0.13040.06742788198189.35361201168489.214334657.8777
610.0658-0.11790.06952277106584.15371245999243.170135298.7145
620.0669-0.14270.07243336579297.22611329622445.332336463.9883
630.0679-0.16760.07614601248459.60881455454215.112238150.4157
640.0689-0.16760.07954604070041.07571572069616.073839649.3331
650.07-0.180.08315314166640.87911705715938.388341300.314


Parameters (Session):
par1 = 12 ; par2 = 1 ; par3 = 1 ; par4 = 0 ; par5 = 12 ; par6 = 3 ; par7 = 0 ; par8 = 0 ; par9 = 0 ; par10 = FALSE ;
Parameters (R input):
par1 = 12 ; par2 = 1 ; par3 = 1 ; par4 = 0 ; par5 = 12 ; par6 = 3 ; par7 = 0 ; par8 = 0 ; par9 = 0 ; par10 = FALSE ;
R code (references can be found in the software module):
par1 <- as.numeric(par1) #cut off periods
par1 <- 28
par2 <- as.numeric(par2) #lambda
par3 <- as.numeric(par3) #degree of non-seasonal differencing
par4 <- as.numeric(par4) #degree of seasonal differencing
par5 <- as.numeric(par5) #seasonal period
par6 <- as.numeric(par6) #p
par6 <- 3
par7 <- as.numeric(par7) #q
par7 <- 3
par8 <- as.numeric(par8) #P
par9 <- as.numeric(par9) #Q
if (par10 == 'TRUE') par10 <- TRUE
if (par10 == 'FALSE') par10 <- FALSE
if (par2 == 0) x <- log(x)
if (par2 != 0) x <- x^par2
lx <- length(x)
first <- lx - 2*par1
nx <- lx - par1
nx1 <- nx + 1
fx <- lx - nx
if (fx < 1) {
fx <- par5
nx1 <- lx + fx - 1
first <- lx - 2*fx
}
first <- 1
if (fx < 3) fx <- round(lx/10,0)
(arima.out <- arima(x[1:nx], order=c(par6,par3,par7), seasonal=list(order=c(par8,par4,par9), period=par5), include.mean=par10, method='ML'))
(forecast <- predict(arima.out,par1))
(lb <- forecast$pred - 1.96 * forecast$se)
(ub <- forecast$pred + 1.96 * forecast$se)
if (par2 == 0) {
x <- exp(x)
forecast$pred <- exp(forecast$pred)
lb <- exp(lb)
ub <- exp(ub)
}
if (par2 != 0) {
x <- x^(1/par2)
forecast$pred <- forecast$pred^(1/par2)
lb <- lb^(1/par2)
ub <- ub^(1/par2)
}
if (par2 < 0) {
olb <- lb
lb <- ub
ub <- olb
}
(actandfor <- c(x[1:nx], forecast$pred))
(perc.se <- (ub-forecast$pred)/1.96/forecast$pred)
bitmap(file='test1.png')
opar <- par(mar=c(4,4,2,2),las=1)
ylim <- c( min(x[first:nx],lb), max(x[first:nx],ub))
plot(x,ylim=ylim,type='n',xlim=c(first,lx))
usr <- par('usr')
rect(usr[1],usr[3],nx+1,usr[4],border=NA,col='lemonchiffon')
rect(nx1,usr[3],usr[2],usr[4],border=NA,col='lavender')
abline(h= (-3:3)*2 , col ='gray', lty =3)
polygon( c(nx1:lx,lx:nx1), c(lb,rev(ub)), col = 'orange', lty=2,border=NA)
lines(nx1:lx, lb , lty=2)
lines(nx1:lx, ub , lty=2)
lines(x, lwd=2)
lines(nx1:lx, forecast$pred , lwd=2 , col ='white')
box()
par(opar)
dev.off()
prob.dec <- array(NA, dim=fx)
prob.sdec <- array(NA, dim=fx)
prob.ldec <- array(NA, dim=fx)
prob.pval <- array(NA, dim=fx)
perf.pe <- array(0, dim=fx)
perf.mape <- array(0, dim=fx)
perf.mape1 <- array(0, dim=fx)
perf.se <- array(0, dim=fx)
perf.mse <- array(0, dim=fx)
perf.mse1 <- array(0, dim=fx)
perf.rmse <- array(0, dim=fx)
for (i in 1:fx) {
locSD <- (ub[i] - forecast$pred[i]) / 1.96
perf.pe[i] = (x[nx+i] - forecast$pred[i]) / forecast$pred[i]
perf.se[i] = (x[nx+i] - forecast$pred[i])^2
prob.dec[i] = pnorm((x[nx+i-1] - forecast$pred[i]) / locSD)
prob.sdec[i] = pnorm((x[nx+i-par5] - forecast$pred[i]) / locSD)
prob.ldec[i] = pnorm((x[nx] - forecast$pred[i]) / locSD)
prob.pval[i] = pnorm(abs(x[nx+i] - forecast$pred[i]) / locSD)
}
perf.mape[1] = abs(perf.pe[1])
perf.mse[1] = abs(perf.se[1])
for (i in 2:fx) {
perf.mape[i] = perf.mape[i-1] + abs(perf.pe[i])
perf.mape1[i] = perf.mape[i] / i
perf.mse[i] = perf.mse[i-1] + perf.se[i]
perf.mse1[i] = perf.mse[i] / i
}
perf.rmse = sqrt(perf.mse1)
bitmap(file='test2.png')
plot(forecast$pred, pch=19, type='b',main='ARIMA Extrapolation Forecast', ylab='Forecast and 95% CI', xlab='time',ylim=c(min(lb),max(ub)))
dum <- forecast$pred
dum[1:par1] <- x[(nx+1):lx]
lines(dum, lty=1)
lines(ub,lty=3)
lines(lb,lty=3)
dev.off()
load(file='createtable')
a<-table.start()
a<-table.row.start(a)
a<-table.element(a,'Univariate ARIMA Extrapolation Forecast',9,TRUE)
a<-table.row.end(a)
a<-table.row.start(a)
a<-table.element(a,'time',1,header=TRUE)
a<-table.element(a,'Y[t]',1,header=TRUE)
a<-table.element(a,'F[t]',1,header=TRUE)
a<-table.element(a,'95% LB',1,header=TRUE)
a<-table.element(a,'95% UB',1,header=TRUE)
a<-table.element(a,'p-value
(H0: Y[t] = F[t])',1,header=TRUE)
a<-table.element(a,'P(F[t]>Y[t-1])',1,header=TRUE)
a<-table.element(a,'P(F[t]>Y[t-s])',1,header=TRUE)
mylab <- paste('P(F[t]>Y[',nx,sep='')
mylab <- paste(mylab,'])',sep='')
a<-table.element(a,mylab,1,header=TRUE)
a<-table.row.end(a)
for (i in (nx-par5):nx) {
a<-table.row.start(a)
a<-table.element(a,i,header=TRUE)
a<-table.element(a,x[i])
a<-table.element(a,'-')
a<-table.row.end(a)
}
for (i in 1:fx) {
a<-table.row.start(a)
a<-table.element(a,nx+i,header=TRUE)
a<-table.element(a,round(x[nx+i],4))
a<-table.element(a,round(forecast$pred[i],4))
a<-table.element(a,round(lb[i],4))
a<-table.element(a,round(ub[i],4))
a<-table.element(a,round((1-prob.pval[i]),4))
a<-table.element(a,round((1-prob.dec[i]),4))
a<-table.element(a,round((1-prob.sdec[i]),4))
a<-table.element(a,round((1-prob.ldec[i]),4))
a<-table.row.end(a)
}
a<-table.end(a)
table.save(a,file='mytable.tab')
a<-table.start()
a<-table.row.start(a)
a<-table.element(a,'Univariate ARIMA Extrapolation Forecast Performance',7,TRUE)
a<-table.row.end(a)
a<-table.row.start(a)
a<-table.element(a,'time',1,header=TRUE)
a<-table.element(a,'% S.E.',1,header=TRUE)
a<-table.element(a,'PE',1,header=TRUE)
a<-table.element(a,'MAPE',1,header=TRUE)
a<-table.element(a,'Sq.E',1,header=TRUE)
a<-table.element(a,'MSE',1,header=TRUE)
a<-table.element(a,'RMSE',1,header=TRUE)
a<-table.row.end(a)
for (i in 1:fx) {
a<-table.row.start(a)
a<-table.element(a,nx+i,header=TRUE)
a<-table.element(a,round(perc.se[i],4))
a<-table.element(a,round(perf.pe[i],4))
a<-table.element(a,round(perf.mape1[i],4))
a<-table.element(a,round(perf.se[i],4))
a<-table.element(a,round(perf.mse1[i],4))
a<-table.element(a,round(perf.rmse[i],4))
a<-table.row.end(a)
}
a<-table.end(a)
table.save(a,file='mytable1.tab')