Free Statistics

of Irreproducible Research!

Author's title

Author*The author of this computation has been verified*
R Software Modulerwasp_arimabackwardselection.wasp
Title produced by softwareARIMA Backward Selection
Date of computationSat, 19 Dec 2009 03:42:58 -0700
Cite this page as followsStatistical Computations at FreeStatistics.org, Office for Research Development and Education, URL https://freestatistics.org/blog/index.php?v=date/2009/Dec/19/t1261219465styusubh3i6l5ko.htm/, Retrieved Fri, 03 May 2024 21:39:35 +0000
Statistical Computations at FreeStatistics.org, Office for Research Development and Education, URL https://freestatistics.org/blog/index.php?pk=69489, Retrieved Fri, 03 May 2024 21:39:35 +0000
QR Codes:

Original text written by user:
IsPrivate?No (this computation is public)
User-defined keywords
Estimated Impact143
Family? (F = Feedback message, R = changed R code, M = changed R Module, P = changed Parameters, D = changed Data)
-     [Univariate Data Series] [data set] [2008-12-01 19:54:57] [b98453cac15ba1066b407e146608df68]
- RMP   [ARIMA Backward Selection] [] [2009-11-27 14:53:14] [b98453cac15ba1066b407e146608df68]
-   PD    [ARIMA Backward Selection] [ARIMA] [2009-12-04 16:05:30] [c0117c881d5fcd069841276db0c34efe]
-   P         [ARIMA Backward Selection] [ARIMA] [2009-12-19 10:42:58] [d5837f25ec8937f9733a894c487f865c] [Current]
Feedback Forum

Post a new message
Dataseries X:
3030.29
2803.47
2767.63
2882.6
2863.36
2897.06
3012.61
3142.95
3032.93
3045.78
3110.52
3013.24
2987.1
2995.55
2833.18
2848.96
2794.83
2845.26
2915.02
2892.63
2604.42
2641.65
2659.81
2638.53
2720.25
2745.88
2735.7
2811.7
2799.43
2555.28
2304.98
2214.95
2065.81
1940.49
2042
1995.37
1946.81
1765.9
1635.25
1833.42
1910.43
1959.67
1969.6
2061.41
2093.48
2120.88
2174.56
2196.72
2350.44
2440.25
2408.64
2472.81
2407.6
2454.62
2448.05
2497.84
2645.64
2756.76
2849.27
2921.44


Summary of computational transaction
Raw Inputview raw input (R code)
Raw Outputview raw output of R engine
Computing time9 seconds
R Server'Gwilym Jenkins' @ 72.249.127.135

\begin{tabular}{lllllllll}
\hline
Summary of computational transaction \tabularnewline
Raw Input & view raw input (R code)  \tabularnewline
Raw Output & view raw output of R engine  \tabularnewline
Computing time & 9 seconds \tabularnewline
R Server & 'Gwilym Jenkins' @ 72.249.127.135 \tabularnewline
\hline
\end{tabular}
%Source: https://freestatistics.org/blog/index.php?pk=69489&T=0

[TABLE]
[ROW][C]Summary of computational transaction[/C][/ROW]
[ROW][C]Raw Input[/C][C]view raw input (R code) [/C][/ROW]
[ROW][C]Raw Output[/C][C]view raw output of R engine [/C][/ROW]
[ROW][C]Computing time[/C][C]9 seconds[/C][/ROW]
[ROW][C]R Server[/C][C]'Gwilym Jenkins' @ 72.249.127.135[/C][/ROW]
[/TABLE]
Source: https://freestatistics.org/blog/index.php?pk=69489&T=0

Globally Unique Identifier (entire table): ba.freestatistics.org/blog/index.php?pk=69489&T=0

As an alternative you can also use a QR Code:  

The GUIDs for individual cells are displayed in the table below:

Summary of computational transaction
Raw Inputview raw input (R code)
Raw Outputview raw output of R engine
Computing time9 seconds
R Server'Gwilym Jenkins' @ 72.249.127.135


ARIMA Parameter Estimation and Backward Selection
Iterationar1ar2ar3ma1sar1sar2sma1
Estimates ( 1 )0.07420.00590.13660.33350.8207-7e-04-0.6697
(p-val)(0.899 )(0.9826 )(0.3848 )(0.5622 )(0.3025 )(0.9977 )(0.4254 )
Estimates ( 2 )0.06920.00770.13640.33850.82520-0.6757
(p-val)(0.9046 )(0.9771 )(0.3803 )(0.5524 )(0.0877 )(NA )(0.2657 )
Estimates ( 3 )0.08400.13830.32350.82630-0.6772
(p-val)(0.7879 )(NA )(0.3243 )(0.2665 )(0.0865 )(NA )(0.2642 )
Estimates ( 4 )000.13280.39060.83390-0.6934
(p-val)(NA )(NA )(0.3499 )(0.0037 )(0.1033 )(NA )(0.2785 )
Estimates ( 5 )0000.42470.76340-0.5827
(p-val)(NA )(NA )(NA )(0.002 )(0.1172 )(NA )(0.3243 )
Estimates ( 6 )0000.39650.217300
(p-val)(NA )(NA )(NA )(0.0036 )(0.1247 )(NA )(NA )
Estimates ( 7 )0000.3405000
(p-val)(NA )(NA )(NA )(0.0181 )(NA )(NA )(NA )
Estimates ( 8 )NANANANANANANA
(p-val)(NA )(NA )(NA )(NA )(NA )(NA )(NA )
Estimates ( 9 )NANANANANANANA
(p-val)(NA )(NA )(NA )(NA )(NA )(NA )(NA )
Estimates ( 10 )NANANANANANANA
(p-val)(NA )(NA )(NA )(NA )(NA )(NA )(NA )
Estimates ( 11 )NANANANANANANA
(p-val)(NA )(NA )(NA )(NA )(NA )(NA )(NA )
Estimates ( 12 )NANANANANANANA
(p-val)(NA )(NA )(NA )(NA )(NA )(NA )(NA )
Estimates ( 13 )NANANANANANANA
(p-val)(NA )(NA )(NA )(NA )(NA )(NA )(NA )

\begin{tabular}{lllllllll}
\hline
ARIMA Parameter Estimation and Backward Selection \tabularnewline
Iteration & ar1 & ar2 & ar3 & ma1 & sar1 & sar2 & sma1 \tabularnewline
Estimates ( 1 ) & 0.0742 & 0.0059 & 0.1366 & 0.3335 & 0.8207 & -7e-04 & -0.6697 \tabularnewline
(p-val) & (0.899 ) & (0.9826 ) & (0.3848 ) & (0.5622 ) & (0.3025 ) & (0.9977 ) & (0.4254 ) \tabularnewline
Estimates ( 2 ) & 0.0692 & 0.0077 & 0.1364 & 0.3385 & 0.8252 & 0 & -0.6757 \tabularnewline
(p-val) & (0.9046 ) & (0.9771 ) & (0.3803 ) & (0.5524 ) & (0.0877 ) & (NA ) & (0.2657 ) \tabularnewline
Estimates ( 3 ) & 0.084 & 0 & 0.1383 & 0.3235 & 0.8263 & 0 & -0.6772 \tabularnewline
(p-val) & (0.7879 ) & (NA ) & (0.3243 ) & (0.2665 ) & (0.0865 ) & (NA ) & (0.2642 ) \tabularnewline
Estimates ( 4 ) & 0 & 0 & 0.1328 & 0.3906 & 0.8339 & 0 & -0.6934 \tabularnewline
(p-val) & (NA ) & (NA ) & (0.3499 ) & (0.0037 ) & (0.1033 ) & (NA ) & (0.2785 ) \tabularnewline
Estimates ( 5 ) & 0 & 0 & 0 & 0.4247 & 0.7634 & 0 & -0.5827 \tabularnewline
(p-val) & (NA ) & (NA ) & (NA ) & (0.002 ) & (0.1172 ) & (NA ) & (0.3243 ) \tabularnewline
Estimates ( 6 ) & 0 & 0 & 0 & 0.3965 & 0.2173 & 0 & 0 \tabularnewline
(p-val) & (NA ) & (NA ) & (NA ) & (0.0036 ) & (0.1247 ) & (NA ) & (NA ) \tabularnewline
Estimates ( 7 ) & 0 & 0 & 0 & 0.3405 & 0 & 0 & 0 \tabularnewline
(p-val) & (NA ) & (NA ) & (NA ) & (0.0181 ) & (NA ) & (NA ) & (NA ) \tabularnewline
Estimates ( 8 ) & NA & NA & NA & NA & NA & NA & NA \tabularnewline
(p-val) & (NA ) & (NA ) & (NA ) & (NA ) & (NA ) & (NA ) & (NA ) \tabularnewline
Estimates ( 9 ) & NA & NA & NA & NA & NA & NA & NA \tabularnewline
(p-val) & (NA ) & (NA ) & (NA ) & (NA ) & (NA ) & (NA ) & (NA ) \tabularnewline
Estimates ( 10 ) & NA & NA & NA & NA & NA & NA & NA \tabularnewline
(p-val) & (NA ) & (NA ) & (NA ) & (NA ) & (NA ) & (NA ) & (NA ) \tabularnewline
Estimates ( 11 ) & NA & NA & NA & NA & NA & NA & NA \tabularnewline
(p-val) & (NA ) & (NA ) & (NA ) & (NA ) & (NA ) & (NA ) & (NA ) \tabularnewline
Estimates ( 12 ) & NA & NA & NA & NA & NA & NA & NA \tabularnewline
(p-val) & (NA ) & (NA ) & (NA ) & (NA ) & (NA ) & (NA ) & (NA ) \tabularnewline
Estimates ( 13 ) & NA & NA & NA & NA & NA & NA & NA \tabularnewline
(p-val) & (NA ) & (NA ) & (NA ) & (NA ) & (NA ) & (NA ) & (NA ) \tabularnewline
\hline
\end{tabular}
%Source: https://freestatistics.org/blog/index.php?pk=69489&T=1

[TABLE]
[ROW][C]ARIMA Parameter Estimation and Backward Selection[/C][/ROW]
[ROW][C]Iteration[/C][C]ar1[/C][C]ar2[/C][C]ar3[/C][C]ma1[/C][C]sar1[/C][C]sar2[/C][C]sma1[/C][/ROW]
[ROW][C]Estimates ( 1 )[/C][C]0.0742[/C][C]0.0059[/C][C]0.1366[/C][C]0.3335[/C][C]0.8207[/C][C]-7e-04[/C][C]-0.6697[/C][/ROW]
[ROW][C](p-val)[/C][C](0.899 )[/C][C](0.9826 )[/C][C](0.3848 )[/C][C](0.5622 )[/C][C](0.3025 )[/C][C](0.9977 )[/C][C](0.4254 )[/C][/ROW]
[ROW][C]Estimates ( 2 )[/C][C]0.0692[/C][C]0.0077[/C][C]0.1364[/C][C]0.3385[/C][C]0.8252[/C][C]0[/C][C]-0.6757[/C][/ROW]
[ROW][C](p-val)[/C][C](0.9046 )[/C][C](0.9771 )[/C][C](0.3803 )[/C][C](0.5524 )[/C][C](0.0877 )[/C][C](NA )[/C][C](0.2657 )[/C][/ROW]
[ROW][C]Estimates ( 3 )[/C][C]0.084[/C][C]0[/C][C]0.1383[/C][C]0.3235[/C][C]0.8263[/C][C]0[/C][C]-0.6772[/C][/ROW]
[ROW][C](p-val)[/C][C](0.7879 )[/C][C](NA )[/C][C](0.3243 )[/C][C](0.2665 )[/C][C](0.0865 )[/C][C](NA )[/C][C](0.2642 )[/C][/ROW]
[ROW][C]Estimates ( 4 )[/C][C]0[/C][C]0[/C][C]0.1328[/C][C]0.3906[/C][C]0.8339[/C][C]0[/C][C]-0.6934[/C][/ROW]
[ROW][C](p-val)[/C][C](NA )[/C][C](NA )[/C][C](0.3499 )[/C][C](0.0037 )[/C][C](0.1033 )[/C][C](NA )[/C][C](0.2785 )[/C][/ROW]
[ROW][C]Estimates ( 5 )[/C][C]0[/C][C]0[/C][C]0[/C][C]0.4247[/C][C]0.7634[/C][C]0[/C][C]-0.5827[/C][/ROW]
[ROW][C](p-val)[/C][C](NA )[/C][C](NA )[/C][C](NA )[/C][C](0.002 )[/C][C](0.1172 )[/C][C](NA )[/C][C](0.3243 )[/C][/ROW]
[ROW][C]Estimates ( 6 )[/C][C]0[/C][C]0[/C][C]0[/C][C]0.3965[/C][C]0.2173[/C][C]0[/C][C]0[/C][/ROW]
[ROW][C](p-val)[/C][C](NA )[/C][C](NA )[/C][C](NA )[/C][C](0.0036 )[/C][C](0.1247 )[/C][C](NA )[/C][C](NA )[/C][/ROW]
[ROW][C]Estimates ( 7 )[/C][C]0[/C][C]0[/C][C]0[/C][C]0.3405[/C][C]0[/C][C]0[/C][C]0[/C][/ROW]
[ROW][C](p-val)[/C][C](NA )[/C][C](NA )[/C][C](NA )[/C][C](0.0181 )[/C][C](NA )[/C][C](NA )[/C][C](NA )[/C][/ROW]
[ROW][C]Estimates ( 8 )[/C][C]NA[/C][C]NA[/C][C]NA[/C][C]NA[/C][C]NA[/C][C]NA[/C][C]NA[/C][/ROW]
[ROW][C](p-val)[/C][C](NA )[/C][C](NA )[/C][C](NA )[/C][C](NA )[/C][C](NA )[/C][C](NA )[/C][C](NA )[/C][/ROW]
[ROW][C]Estimates ( 9 )[/C][C]NA[/C][C]NA[/C][C]NA[/C][C]NA[/C][C]NA[/C][C]NA[/C][C]NA[/C][/ROW]
[ROW][C](p-val)[/C][C](NA )[/C][C](NA )[/C][C](NA )[/C][C](NA )[/C][C](NA )[/C][C](NA )[/C][C](NA )[/C][/ROW]
[ROW][C]Estimates ( 10 )[/C][C]NA[/C][C]NA[/C][C]NA[/C][C]NA[/C][C]NA[/C][C]NA[/C][C]NA[/C][/ROW]
[ROW][C](p-val)[/C][C](NA )[/C][C](NA )[/C][C](NA )[/C][C](NA )[/C][C](NA )[/C][C](NA )[/C][C](NA )[/C][/ROW]
[ROW][C]Estimates ( 11 )[/C][C]NA[/C][C]NA[/C][C]NA[/C][C]NA[/C][C]NA[/C][C]NA[/C][C]NA[/C][/ROW]
[ROW][C](p-val)[/C][C](NA )[/C][C](NA )[/C][C](NA )[/C][C](NA )[/C][C](NA )[/C][C](NA )[/C][C](NA )[/C][/ROW]
[ROW][C]Estimates ( 12 )[/C][C]NA[/C][C]NA[/C][C]NA[/C][C]NA[/C][C]NA[/C][C]NA[/C][C]NA[/C][/ROW]
[ROW][C](p-val)[/C][C](NA )[/C][C](NA )[/C][C](NA )[/C][C](NA )[/C][C](NA )[/C][C](NA )[/C][C](NA )[/C][/ROW]
[ROW][C]Estimates ( 13 )[/C][C]NA[/C][C]NA[/C][C]NA[/C][C]NA[/C][C]NA[/C][C]NA[/C][C]NA[/C][/ROW]
[ROW][C](p-val)[/C][C](NA )[/C][C](NA )[/C][C](NA )[/C][C](NA )[/C][C](NA )[/C][C](NA )[/C][C](NA )[/C][/ROW]
[/TABLE]
Source: https://freestatistics.org/blog/index.php?pk=69489&T=1

Globally Unique Identifier (entire table): ba.freestatistics.org/blog/index.php?pk=69489&T=1

As an alternative you can also use a QR Code:  

The GUIDs for individual cells are displayed in the table below:

ARIMA Parameter Estimation and Backward Selection
Iterationar1ar2ar3ma1sar1sar2sma1
Estimates ( 1 )0.07420.00590.13660.33350.8207-7e-04-0.6697
(p-val)(0.899 )(0.9826 )(0.3848 )(0.5622 )(0.3025 )(0.9977 )(0.4254 )
Estimates ( 2 )0.06920.00770.13640.33850.82520-0.6757
(p-val)(0.9046 )(0.9771 )(0.3803 )(0.5524 )(0.0877 )(NA )(0.2657 )
Estimates ( 3 )0.08400.13830.32350.82630-0.6772
(p-val)(0.7879 )(NA )(0.3243 )(0.2665 )(0.0865 )(NA )(0.2642 )
Estimates ( 4 )000.13280.39060.83390-0.6934
(p-val)(NA )(NA )(0.3499 )(0.0037 )(0.1033 )(NA )(0.2785 )
Estimates ( 5 )0000.42470.76340-0.5827
(p-val)(NA )(NA )(NA )(0.002 )(0.1172 )(NA )(0.3243 )
Estimates ( 6 )0000.39650.217300
(p-val)(NA )(NA )(NA )(0.0036 )(0.1247 )(NA )(NA )
Estimates ( 7 )0000.3405000
(p-val)(NA )(NA )(NA )(0.0181 )(NA )(NA )(NA )
Estimates ( 8 )NANANANANANANA
(p-val)(NA )(NA )(NA )(NA )(NA )(NA )(NA )
Estimates ( 9 )NANANANANANANA
(p-val)(NA )(NA )(NA )(NA )(NA )(NA )(NA )
Estimates ( 10 )NANANANANANANA
(p-val)(NA )(NA )(NA )(NA )(NA )(NA )(NA )
Estimates ( 11 )NANANANANANANA
(p-val)(NA )(NA )(NA )(NA )(NA )(NA )(NA )
Estimates ( 12 )NANANANANANANA
(p-val)(NA )(NA )(NA )(NA )(NA )(NA )(NA )
Estimates ( 13 )NANANANANANANA
(p-val)(NA )(NA )(NA )(NA )(NA )(NA )(NA )


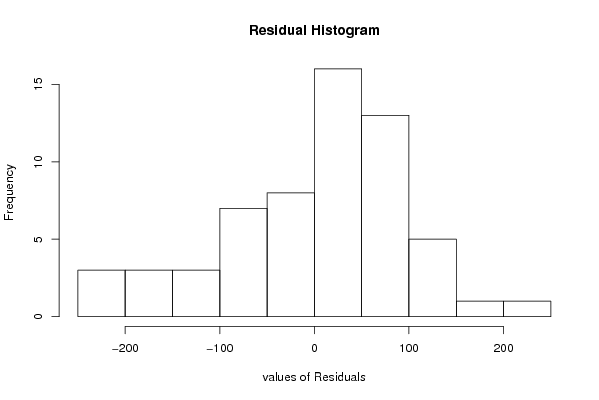
Estimated ARIMA Residuals
Value
3.03028815977636
-205.814225865519
40.4423118324373
96.1984344207713
-56.842956020702
55.4231197094836
90.8148606353312
91.2193691704413
-143.556256642335
69.4588524833269
35.6541859197896
-109.091066297277
34.0927819009415
44.3612659510223
-172.029182823590
58.9606111294203
-73.3221611433058
72.1757807770544
16.0323693904942
-57.0726558128606
-241.672093318618
130.253499886971
-47.5515135926259
18.7143085699692
79.9812101242803
-7.9166900082294
28.2459774078816
61.3718645067277
-24.8383460199570
-245.262052956570
-168.221208579904
-18.4691241764340
-79.1819686156446
-102.017641503111
138.010464240829
-96.7225417863078
-27.9721378614552
-175.389906699906
-58.9004897097252
205.005594747302
-1.60232159644056
102.935435181500
23.5157305013834
102.052544933838
24.0210662162181
45.1116306526633
13.7337466362092
26.8488730587228
153.628536173284
68.2170955933866
-30.2624953921063
33.1007150395203
-95.0697767563784
74.0113383722355
-38.071447511752
44.9315442321272
123.016268118672
56.3927992357494
58.485788719297
44.1660953970368

\begin{tabular}{lllllllll}
\hline
Estimated ARIMA Residuals \tabularnewline
Value \tabularnewline
3.03028815977636 \tabularnewline
-205.814225865519 \tabularnewline
40.4423118324373 \tabularnewline
96.1984344207713 \tabularnewline
-56.842956020702 \tabularnewline
55.4231197094836 \tabularnewline
90.8148606353312 \tabularnewline
91.2193691704413 \tabularnewline
-143.556256642335 \tabularnewline
69.4588524833269 \tabularnewline
35.6541859197896 \tabularnewline
-109.091066297277 \tabularnewline
34.0927819009415 \tabularnewline
44.3612659510223 \tabularnewline
-172.029182823590 \tabularnewline
58.9606111294203 \tabularnewline
-73.3221611433058 \tabularnewline
72.1757807770544 \tabularnewline
16.0323693904942 \tabularnewline
-57.0726558128606 \tabularnewline
-241.672093318618 \tabularnewline
130.253499886971 \tabularnewline
-47.5515135926259 \tabularnewline
18.7143085699692 \tabularnewline
79.9812101242803 \tabularnewline
-7.9166900082294 \tabularnewline
28.2459774078816 \tabularnewline
61.3718645067277 \tabularnewline
-24.8383460199570 \tabularnewline
-245.262052956570 \tabularnewline
-168.221208579904 \tabularnewline
-18.4691241764340 \tabularnewline
-79.1819686156446 \tabularnewline
-102.017641503111 \tabularnewline
138.010464240829 \tabularnewline
-96.7225417863078 \tabularnewline
-27.9721378614552 \tabularnewline
-175.389906699906 \tabularnewline
-58.9004897097252 \tabularnewline
205.005594747302 \tabularnewline
-1.60232159644056 \tabularnewline
102.935435181500 \tabularnewline
23.5157305013834 \tabularnewline
102.052544933838 \tabularnewline
24.0210662162181 \tabularnewline
45.1116306526633 \tabularnewline
13.7337466362092 \tabularnewline
26.8488730587228 \tabularnewline
153.628536173284 \tabularnewline
68.2170955933866 \tabularnewline
-30.2624953921063 \tabularnewline
33.1007150395203 \tabularnewline
-95.0697767563784 \tabularnewline
74.0113383722355 \tabularnewline
-38.071447511752 \tabularnewline
44.9315442321272 \tabularnewline
123.016268118672 \tabularnewline
56.3927992357494 \tabularnewline
58.485788719297 \tabularnewline
44.1660953970368 \tabularnewline
\hline
\end{tabular}
%Source: https://freestatistics.org/blog/index.php?pk=69489&T=2

[TABLE]
[ROW][C]Estimated ARIMA Residuals[/C][/ROW]
[ROW][C]Value[/C][/ROW]
[ROW][C]3.03028815977636[/C][/ROW]
[ROW][C]-205.814225865519[/C][/ROW]
[ROW][C]40.4423118324373[/C][/ROW]
[ROW][C]96.1984344207713[/C][/ROW]
[ROW][C]-56.842956020702[/C][/ROW]
[ROW][C]55.4231197094836[/C][/ROW]
[ROW][C]90.8148606353312[/C][/ROW]
[ROW][C]91.2193691704413[/C][/ROW]
[ROW][C]-143.556256642335[/C][/ROW]
[ROW][C]69.4588524833269[/C][/ROW]
[ROW][C]35.6541859197896[/C][/ROW]
[ROW][C]-109.091066297277[/C][/ROW]
[ROW][C]34.0927819009415[/C][/ROW]
[ROW][C]44.3612659510223[/C][/ROW]
[ROW][C]-172.029182823590[/C][/ROW]
[ROW][C]58.9606111294203[/C][/ROW]
[ROW][C]-73.3221611433058[/C][/ROW]
[ROW][C]72.1757807770544[/C][/ROW]
[ROW][C]16.0323693904942[/C][/ROW]
[ROW][C]-57.0726558128606[/C][/ROW]
[ROW][C]-241.672093318618[/C][/ROW]
[ROW][C]130.253499886971[/C][/ROW]
[ROW][C]-47.5515135926259[/C][/ROW]
[ROW][C]18.7143085699692[/C][/ROW]
[ROW][C]79.9812101242803[/C][/ROW]
[ROW][C]-7.9166900082294[/C][/ROW]
[ROW][C]28.2459774078816[/C][/ROW]
[ROW][C]61.3718645067277[/C][/ROW]
[ROW][C]-24.8383460199570[/C][/ROW]
[ROW][C]-245.262052956570[/C][/ROW]
[ROW][C]-168.221208579904[/C][/ROW]
[ROW][C]-18.4691241764340[/C][/ROW]
[ROW][C]-79.1819686156446[/C][/ROW]
[ROW][C]-102.017641503111[/C][/ROW]
[ROW][C]138.010464240829[/C][/ROW]
[ROW][C]-96.7225417863078[/C][/ROW]
[ROW][C]-27.9721378614552[/C][/ROW]
[ROW][C]-175.389906699906[/C][/ROW]
[ROW][C]-58.9004897097252[/C][/ROW]
[ROW][C]205.005594747302[/C][/ROW]
[ROW][C]-1.60232159644056[/C][/ROW]
[ROW][C]102.935435181500[/C][/ROW]
[ROW][C]23.5157305013834[/C][/ROW]
[ROW][C]102.052544933838[/C][/ROW]
[ROW][C]24.0210662162181[/C][/ROW]
[ROW][C]45.1116306526633[/C][/ROW]
[ROW][C]13.7337466362092[/C][/ROW]
[ROW][C]26.8488730587228[/C][/ROW]
[ROW][C]153.628536173284[/C][/ROW]
[ROW][C]68.2170955933866[/C][/ROW]
[ROW][C]-30.2624953921063[/C][/ROW]
[ROW][C]33.1007150395203[/C][/ROW]
[ROW][C]-95.0697767563784[/C][/ROW]
[ROW][C]74.0113383722355[/C][/ROW]
[ROW][C]-38.071447511752[/C][/ROW]
[ROW][C]44.9315442321272[/C][/ROW]
[ROW][C]123.016268118672[/C][/ROW]
[ROW][C]56.3927992357494[/C][/ROW]
[ROW][C]58.485788719297[/C][/ROW]
[ROW][C]44.1660953970368[/C][/ROW]
[/TABLE]
Source: https://freestatistics.org/blog/index.php?pk=69489&T=2

Globally Unique Identifier (entire table): ba.freestatistics.org/blog/index.php?pk=69489&T=2

As an alternative you can also use a QR Code:  

The GUIDs for individual cells are displayed in the table below:

Estimated ARIMA Residuals
Value
3.03028815977636
-205.814225865519
40.4423118324373
96.1984344207713
-56.842956020702
55.4231197094836
90.8148606353312
91.2193691704413
-143.556256642335
69.4588524833269
35.6541859197896
-109.091066297277
34.0927819009415
44.3612659510223
-172.029182823590
58.9606111294203
-73.3221611433058
72.1757807770544
16.0323693904942
-57.0726558128606
-241.672093318618
130.253499886971
-47.5515135926259
18.7143085699692
79.9812101242803
-7.9166900082294
28.2459774078816
61.3718645067277
-24.8383460199570
-245.262052956570
-168.221208579904
-18.4691241764340
-79.1819686156446
-102.017641503111
138.010464240829
-96.7225417863078
-27.9721378614552
-175.389906699906
-58.9004897097252
205.005594747302
-1.60232159644056
102.935435181500
23.5157305013834
102.052544933838
24.0210662162181
45.1116306526633
13.7337466362092
26.8488730587228
153.628536173284
68.2170955933866
-30.2624953921063
33.1007150395203
-95.0697767563784
74.0113383722355
-38.071447511752
44.9315442321272
123.016268118672
56.3927992357494
58.485788719297
44.1660953970368


Parameters (Session):
par1 = FALSE ; par2 = 1 ; par3 = 1 ; par4 = 0 ; par5 = 12 ; par6 = 3 ; par7 = 1 ; par8 = 2 ; par9 = 1 ;
Parameters (R input):
par1 = FALSE ; par2 = 1 ; par3 = 1 ; par4 = 0 ; par5 = 12 ; par6 = 3 ; par7 = 1 ; par8 = 2 ; par9 = 1 ;
R code (references can be found in the software module):
library(lattice)
if (par1 == 'TRUE') par1 <- TRUE
if (par1 == 'FALSE') par1 <- FALSE
par2 <- as.numeric(par2) #Box-Cox lambda transformation parameter
par3 <- as.numeric(par3) #degree of non-seasonal differencing
par4 <- as.numeric(par4) #degree of seasonal differencing
par5 <- as.numeric(par5) #seasonal period
par6 <- as.numeric(par6) #degree (p) of the non-seasonal AR(p) polynomial
par7 <- as.numeric(par7) #degree (q) of the non-seasonal MA(q) polynomial
par8 <- as.numeric(par8) #degree (P) of the seasonal AR(P) polynomial
par9 <- as.numeric(par9) #degree (Q) of the seasonal MA(Q) polynomial
armaGR <- function(arima.out, names, n){
try1 <- arima.out$coef
try2 <- sqrt(diag(arima.out$var.coef))
try.data.frame <- data.frame(matrix(NA,ncol=4,nrow=length(names)))
dimnames(try.data.frame) <- list(names,c('coef','std','tstat','pv'))
try.data.frame[,1] <- try1
for(i in 1:length(try2)) try.data.frame[which(rownames(try.data.frame)==names(try2)[i]),2] <- try2[i]
try.data.frame[,3] <- try.data.frame[,1] / try.data.frame[,2]
try.data.frame[,4] <- round((1-pt(abs(try.data.frame[,3]),df=n-(length(try2)+1)))*2,5)
vector <- rep(NA,length(names))
vector[is.na(try.data.frame[,4])] <- 0
maxi <- which.max(try.data.frame[,4])
continue <- max(try.data.frame[,4],na.rm=TRUE) > .05
vector[maxi] <- 0
list(summary=try.data.frame,next.vector=vector,continue=continue)
}
arimaSelect <- function(series, order=c(13,0,0), seasonal=list(order=c(2,0,0),period=12), include.mean=F){
nrc <- order[1]+order[3]+seasonal$order[1]+seasonal$order[3]
coeff <- matrix(NA, nrow=nrc*2, ncol=nrc)
pval <- matrix(NA, nrow=nrc*2, ncol=nrc)
mylist <- rep(list(NULL), nrc)
names <- NULL
if(order[1] > 0) names <- paste('ar',1:order[1],sep='')
if(order[3] > 0) names <- c( names , paste('ma',1:order[3],sep='') )
if(seasonal$order[1] > 0) names <- c(names, paste('sar',1:seasonal$order[1],sep=''))
if(seasonal$order[3] > 0) names <- c(names, paste('sma',1:seasonal$order[3],sep=''))
arima.out <- arima(series, order=order, seasonal=seasonal, include.mean=include.mean, method='ML')
mylist[[1]] <- arima.out
last.arma <- armaGR(arima.out, names, length(series))
mystop <- FALSE
i <- 1
coeff[i,] <- last.arma[[1]][,1]
pval [i,] <- last.arma[[1]][,4]
i <- 2
aic <- arima.out$aic
while(!mystop){
mylist[[i]] <- arima.out
arima.out <- arima(series, order=order, seasonal=seasonal, include.mean=include.mean, method='ML', fixed=last.arma$next.vector)
aic <- c(aic, arima.out$aic)
last.arma <- armaGR(arima.out, names, length(series))
mystop <- !last.arma$continue
coeff[i,] <- last.arma[[1]][,1]
pval [i,] <- last.arma[[1]][,4]
i <- i+1
}
list(coeff, pval, mylist, aic=aic)
}
arimaSelectplot <- function(arimaSelect.out,noms,choix){
noms <- names(arimaSelect.out[[3]][[1]]$coef)
coeff <- arimaSelect.out[[1]]
k <- min(which(is.na(coeff[,1])))-1
coeff <- coeff[1:k,]
pval <- arimaSelect.out[[2]][1:k,]
aic <- arimaSelect.out$aic[1:k]
coeff[coeff==0] <- NA
n <- ncol(coeff)
if(missing(choix)) choix <- k
layout(matrix(c(1,1,1,2,
3,3,3,2,
3,3,3,4,
5,6,7,7),nr=4),
widths=c(10,35,45,15),
heights=c(30,30,15,15))
couleurs <- rainbow(75)[1:50]#(50)
ticks <- pretty(coeff)
par(mar=c(1,1,3,1))
plot(aic,k:1-.5,type='o',pch=21,bg='blue',cex=2,axes=F,lty=2,xpd=NA)
points(aic[choix],k-choix+.5,pch=21,cex=4,bg=2,xpd=NA)
title('aic',line=2)
par(mar=c(3,0,0,0))
plot(0,axes=F,xlab='',ylab='',xlim=range(ticks),ylim=c(.1,1))
rect(xleft = min(ticks) + (0:49)/50*(max(ticks)-min(ticks)),
xright = min(ticks) + (1:50)/50*(max(ticks)-min(ticks)),
ytop = rep(1,50),
ybottom= rep(0,50),col=couleurs,border=NA)
axis(1,ticks)
rect(xleft=min(ticks),xright=max(ticks),ytop=1,ybottom=0)
text(mean(coeff,na.rm=T),.5,'coefficients',cex=2,font=2)
par(mar=c(1,1,3,1))
image(1:n,1:k,t(coeff[k:1,]),axes=F,col=couleurs,zlim=range(ticks))
for(i in 1:n) for(j in 1:k) if(!is.na(coeff[j,i])) {
if(pval[j,i]<.01) symb = 'green'
else if( (pval[j,i]<.05) & (pval[j,i]>=.01)) symb = 'orange'
else if( (pval[j,i]<.1) & (pval[j,i]>=.05)) symb = 'red'
else symb = 'black'
polygon(c(i+.5 ,i+.2 ,i+.5 ,i+.5),
c(k-j+0.5,k-j+0.5,k-j+0.8,k-j+0.5),
col=symb)
if(j==choix) {
rect(xleft=i-.5,
xright=i+.5,
ybottom=k-j+1.5,
ytop=k-j+.5,
lwd=4)
text(i,
k-j+1,
round(coeff[j,i],2),
cex=1.2,
font=2)
}
else{
rect(xleft=i-.5,xright=i+.5,ybottom=k-j+1.5,ytop=k-j+.5)
text(i,k-j+1,round(coeff[j,i],2),cex=1.2,font=1)
}
}
axis(3,1:n,noms)
par(mar=c(0.5,0,0,0.5))
plot(0,axes=F,xlab='',ylab='',type='n',xlim=c(0,8),ylim=c(-.2,.8))
cols <- c('green','orange','red','black')
niv <- c('0','0.01','0.05','0.1')
for(i in 0:3){
polygon(c(1+2*i ,1+2*i ,1+2*i-.5 ,1+2*i),
c(.4 ,.7 , .4 , .4),
col=cols[i+1])
text(2*i,0.5,niv[i+1],cex=1.5)
}
text(8,.5,1,cex=1.5)
text(4,0,'p-value',cex=2)
box()
residus <- arimaSelect.out[[3]][[choix]]$res
par(mar=c(1,2,4,1))
acf(residus,main='')
title('acf',line=.5)
par(mar=c(1,2,4,1))
pacf(residus,main='')
title('pacf',line=.5)
par(mar=c(2,2,4,1))
qqnorm(residus,main='')
title('qq-norm',line=.5)
qqline(residus)
residus
}
if (par2 == 0) x <- log(x)
if (par2 != 0) x <- x^par2
(selection <- arimaSelect(x, order=c(par6,par3,par7), seasonal=list(order=c(par8,par4,par9), period=par5)))
bitmap(file='test1.png')
resid <- arimaSelectplot(selection)
dev.off()
resid
bitmap(file='test2.png')
acf(resid,length(resid)/2, main='Residual Autocorrelation Function')
dev.off()
bitmap(file='test3.png')
pacf(resid,length(resid)/2, main='Residual Partial Autocorrelation Function')
dev.off()
bitmap(file='test4.png')
cpgram(resid, main='Residual Cumulative Periodogram')
dev.off()
bitmap(file='test5.png')
hist(resid, main='Residual Histogram', xlab='values of Residuals')
dev.off()
bitmap(file='test6.png')
densityplot(~resid,col='black',main='Residual Density Plot', xlab='values of Residuals')
dev.off()
bitmap(file='test7.png')
qqnorm(resid, main='Residual Normal Q-Q Plot')
qqline(resid)
dev.off()
ncols <- length(selection[[1]][1,])
nrows <- length(selection[[2]][,1])-1
load(file='createtable')
a<-table.start()
a<-table.row.start(a)
a<-table.element(a,'ARIMA Parameter Estimation and Backward Selection', ncols+1,TRUE)
a<-table.row.end(a)
a<-table.row.start(a)
a<-table.element(a,'Iteration', header=TRUE)
for (i in 1:ncols) {
a<-table.element(a,names(selection[[3]][[1]]$coef)[i],header=TRUE)
}
a<-table.row.end(a)
for (j in 1:nrows) {
a<-table.row.start(a)
mydum <- 'Estimates ('
mydum <- paste(mydum,j)
mydum <- paste(mydum,')')
a<-table.element(a,mydum, header=TRUE)
for (i in 1:ncols) {
a<-table.element(a,round(selection[[1]][j,i],4))
}
a<-table.row.end(a)
a<-table.row.start(a)
a<-table.element(a,'(p-val)', header=TRUE)
for (i in 1:ncols) {
mydum <- '('
mydum <- paste(mydum,round(selection[[2]][j,i],4),sep='')
mydum <- paste(mydum,')')
a<-table.element(a,mydum)
}
a<-table.row.end(a)
}
a<-table.end(a)
table.save(a,file='mytable.tab')
a<-table.start()
a<-table.row.start(a)
a<-table.element(a,'Estimated ARIMA Residuals', 1,TRUE)
a<-table.row.end(a)
a<-table.row.start(a)
a<-table.element(a,'Value', 1,TRUE)
a<-table.row.end(a)
for (i in (par4*par5+par3):length(resid)) {
a<-table.row.start(a)
a<-table.element(a,resid[i])
a<-table.row.end(a)
}
a<-table.end(a)
table.save(a,file='mytable1.tab')