Free Statistics

of Irreproducible Research!

Author's title

Author*The author of this computation has been verified*
R Software Modulerwasp_multipleregression.wasp
Title produced by softwareMultiple Regression
Date of computationSat, 19 Dec 2009 04:06:01 -0700
Cite this page as followsStatistical Computations at FreeStatistics.org, Office for Research Development and Education, URL https://freestatistics.org/blog/index.php?v=date/2009/Dec/19/t12612208084sqblvt4cj1uy1a.htm/, Retrieved Fri, 03 May 2024 18:39:52 +0000
Statistical Computations at FreeStatistics.org, Office for Research Development and Education, URL https://freestatistics.org/blog/index.php?pk=69501, Retrieved Fri, 03 May 2024 18:39:52 +0000
QR Codes:

Original text written by user:
IsPrivate?No (this computation is public)
User-defined keywords
Estimated Impact149
Family? (F = Feedback message, R = changed R code, M = changed R Module, P = changed Parameters, D = changed Data)
-     [Multiple Regression] [Q1 The Seatbeltlaw] [2007-11-14 19:27:43] [8cd6641b921d30ebe00b648d1481bba0]
- RMPD  [Multiple Regression] [Seatbelt] [2009-11-12 13:54:52] [b98453cac15ba1066b407e146608df68]
-    D    [Multiple Regression] [Multiple Regressi...] [2009-12-15 19:14:24] [1eab65e90adf64584b8e6f0da23ff414]
-   PD      [Multiple Regression] [Multiple Regressi...] [2009-12-18 15:36:53] [1eab65e90adf64584b8e6f0da23ff414]
-   PD          [Multiple Regression] [Multiple Regressi...] [2009-12-19 11:06:01] [0f1f1142419956a95ff6f880845f2408] [Current]
Feedback Forum

Post a new message
Dataseries X:
122,74	95,10	96,33
109,84	97,00	96,33
101,99	112,70	95,05
125,12	102,90	96,84
103,5	97,40	96,92
102,8	111,40	97,44
118,72	87,40	97,78
119,01	96,80	97,69
118,61	114,10	96,67
120,43	110,30	98,29
111,83	103,90	98,20
116,79	101,60	98,71
131,71	94,60	98,54
120,57	95,90	98,20
117,83	104,70	100,80
130,8	102,80	101,33
107,46	98,10	101,88
112,09	113,90	101,85
129,47	80,90	102,04
119,72	95,70	102,22
134,81	113,20	102,63
135,8	105,90	102,65
129,27	108,80	102,54
126,94	102,30	102,37
153,45	99,00	102,68
121,86	100,70	102,76
133,47	115,50	102,82
135,34	100,70	103,31
117,1	109,90	103,23
120,65	114,60	103,60
132,49	85,40	103,95
137,6	100,50	103,93
138,69	114,80	104,25
125,53	116,50	104,38
133,09	112,90	104,36
129,08	102,00	104,32
145,94	106,00	104,58
129,07	105,30	104,68
139,69	118,80	104,92
142,09	106,10	105,46
137,29	109,30	105,23
127,03	117,20	105,58
137,25	92,50	105,34
156,87	104,20	105,28
150,89	112,50	105,70
139,14	122,40	105,67
158,3	113,30	105,71
149	100,00	106,19
158,36	110,70	106,93
168,06	112,80	107,44
153,38	109,80	107,85
173,86	117,30	108,71
162,47	109,10	109,32
145,17	115,90	109,49
168,89	96,00	110,20
166,64	99,80	110,62
140,07	116,80	111,22
128,84	115,70	110,88
123,41	99,40	111,15
120,3	94,30	111,29
129,67	91,00	111,09
118,1	93,20	111,24
113,91	103,10	111,45
131,09	94,10	111,75
119,15	91,80	111,07
122,3	102,70	111,17


Summary of computational transaction
Raw Inputview raw input (R code)
Raw Outputview raw output of R engine
Computing time4 seconds
R Server'Gwilym Jenkins' @ 72.249.127.135

\begin{tabular}{lllllllll}
\hline
Summary of computational transaction \tabularnewline
Raw Input & view raw input (R code)  \tabularnewline
Raw Output & view raw output of R engine  \tabularnewline
Computing time & 4 seconds \tabularnewline
R Server & 'Gwilym Jenkins' @ 72.249.127.135 \tabularnewline
\hline
\end{tabular}
%Source: https://freestatistics.org/blog/index.php?pk=69501&T=0

[TABLE]
[ROW][C]Summary of computational transaction[/C][/ROW]
[ROW][C]Raw Input[/C][C]view raw input (R code) [/C][/ROW]
[ROW][C]Raw Output[/C][C]view raw output of R engine [/C][/ROW]
[ROW][C]Computing time[/C][C]4 seconds[/C][/ROW]
[ROW][C]R Server[/C][C]'Gwilym Jenkins' @ 72.249.127.135[/C][/ROW]
[/TABLE]
Source: https://freestatistics.org/blog/index.php?pk=69501&T=0

Globally Unique Identifier (entire table): ba.freestatistics.org/blog/index.php?pk=69501&T=0

As an alternative you can also use a QR Code:  

The GUIDs for individual cells are displayed in the table below:

Summary of computational transaction
Raw Inputview raw input (R code)
Raw Outputview raw output of R engine
Computing time4 seconds
R Server'Gwilym Jenkins' @ 72.249.127.135


Multiple Linear Regression - Estimated Regression Equation
Invoer[t] = -98.86710326935 + 1.58106468927319TIP[t] + 0.558446578230743CONS[t] + 15.0703390719775M1[t] + 0.0912023698377545M2[t] -17.3516358551200M3[t] + 5.66072943166297M4[t] -7.69482419975213M5[t] -26.7889968374189M6[t] + 29.169870473176M7[t] + 14.0996172288639M8[t] -13.1599163920929M9[t] -20.0903115154348M10[t] -8.88920091771722M11[t] + 0.29775784415005t + e[t]

\begin{tabular}{lllllllll}
\hline
Multiple Linear Regression - Estimated Regression Equation \tabularnewline
Invoer[t] =  -98.86710326935 +  1.58106468927319TIP[t] +  0.558446578230743CONS[t] +  15.0703390719775M1[t] +  0.0912023698377545M2[t] -17.3516358551200M3[t] +  5.66072943166297M4[t] -7.69482419975213M5[t] -26.7889968374189M6[t] +  29.169870473176M7[t] +  14.0996172288639M8[t] -13.1599163920929M9[t] -20.0903115154348M10[t] -8.88920091771722M11[t] +  0.29775784415005t  + e[t] \tabularnewline
\hline
\end{tabular}
%Source: https://freestatistics.org/blog/index.php?pk=69501&T=1

[TABLE]
[ROW][C]Multiple Linear Regression - Estimated Regression Equation[/C][/ROW]
[ROW][C]Invoer[t] =  -98.86710326935 +  1.58106468927319TIP[t] +  0.558446578230743CONS[t] +  15.0703390719775M1[t] +  0.0912023698377545M2[t] -17.3516358551200M3[t] +  5.66072943166297M4[t] -7.69482419975213M5[t] -26.7889968374189M6[t] +  29.169870473176M7[t] +  14.0996172288639M8[t] -13.1599163920929M9[t] -20.0903115154348M10[t] -8.88920091771722M11[t] +  0.29775784415005t  + e[t][/C][/ROW]
[/TABLE]
Source: https://freestatistics.org/blog/index.php?pk=69501&T=1

Globally Unique Identifier (entire table): ba.freestatistics.org/blog/index.php?pk=69501&T=1

As an alternative you can also use a QR Code:  

The GUIDs for individual cells are displayed in the table below:

Multiple Linear Regression - Estimated Regression Equation
Invoer[t] = -98.86710326935 + 1.58106468927319TIP[t] + 0.558446578230743CONS[t] + 15.0703390719775M1[t] + 0.0912023698377545M2[t] -17.3516358551200M3[t] + 5.66072943166297M4[t] -7.69482419975213M5[t] -26.7889968374189M6[t] + 29.169870473176M7[t] + 14.0996172288639M8[t] -13.1599163920929M9[t] -20.0903115154348M10[t] -8.88920091771722M11[t] + 0.29775784415005t + e[t]


Multiple Linear Regression - Ordinary Least Squares
VariableParameterS.D.T-STATH0: parameter = 02-tail p-value1-tail p-value
(Intercept)-98.86710326935159.538486-0.61970.538210.269105
TIP1.581064689273190.241296.552500
CONS0.5584465782307431.577790.35390.7248410.362421
M115.07033907197756.2820172.3990.0201350.010068
M20.09120236983775456.2847950.01450.9884780.494239
M3-17.35163585512006.789906-2.55550.0136280.006814
M45.660729431662976.4202930.88170.3820790.19104
M5-7.694824199752136.329107-1.21580.2296650.114833
M6-26.78899683741897.03228-3.80940.0003760.000188
M729.1698704731767.0781684.12110.0001396.9e-05
M814.09961722886396.5753142.14430.0367950.018397
M9-13.15991639209297.466237-1.76260.0839610.041981
M10-20.09031151543487.458708-2.69350.0095450.004772
M11-8.889200917717226.81304-1.30470.1978410.09892
t0.297757844150050.385990.77140.4440220.222011

\begin{tabular}{lllllllll}
\hline
Multiple Linear Regression - Ordinary Least Squares \tabularnewline
Variable & Parameter & S.D. & T-STATH0: parameter = 0 & 2-tail p-value & 1-tail p-value \tabularnewline
(Intercept) & -98.86710326935 & 159.538486 & -0.6197 & 0.53821 & 0.269105 \tabularnewline
TIP & 1.58106468927319 & 0.24129 & 6.5525 & 0 & 0 \tabularnewline
CONS & 0.558446578230743 & 1.57779 & 0.3539 & 0.724841 & 0.362421 \tabularnewline
M1 & 15.0703390719775 & 6.282017 & 2.399 & 0.020135 & 0.010068 \tabularnewline
M2 & 0.0912023698377545 & 6.284795 & 0.0145 & 0.988478 & 0.494239 \tabularnewline
M3 & -17.3516358551200 & 6.789906 & -2.5555 & 0.013628 & 0.006814 \tabularnewline
M4 & 5.66072943166297 & 6.420293 & 0.8817 & 0.382079 & 0.19104 \tabularnewline
M5 & -7.69482419975213 & 6.329107 & -1.2158 & 0.229665 & 0.114833 \tabularnewline
M6 & -26.7889968374189 & 7.03228 & -3.8094 & 0.000376 & 0.000188 \tabularnewline
M7 & 29.169870473176 & 7.078168 & 4.1211 & 0.000139 & 6.9e-05 \tabularnewline
M8 & 14.0996172288639 & 6.575314 & 2.1443 & 0.036795 & 0.018397 \tabularnewline
M9 & -13.1599163920929 & 7.466237 & -1.7626 & 0.083961 & 0.041981 \tabularnewline
M10 & -20.0903115154348 & 7.458708 & -2.6935 & 0.009545 & 0.004772 \tabularnewline
M11 & -8.88920091771722 & 6.81304 & -1.3047 & 0.197841 & 0.09892 \tabularnewline
t & 0.29775784415005 & 0.38599 & 0.7714 & 0.444022 & 0.222011 \tabularnewline
\hline
\end{tabular}
%Source: https://freestatistics.org/blog/index.php?pk=69501&T=2

[TABLE]
[ROW][C]Multiple Linear Regression - Ordinary Least Squares[/C][/ROW]
[ROW][C]Variable[/C][C]Parameter[/C][C]S.D.[/C][C]T-STATH0: parameter = 0[/C][C]2-tail p-value[/C][C]1-tail p-value[/C][/ROW]
[ROW][C](Intercept)[/C][C]-98.86710326935[/C][C]159.538486[/C][C]-0.6197[/C][C]0.53821[/C][C]0.269105[/C][/ROW]
[ROW][C]TIP[/C][C]1.58106468927319[/C][C]0.24129[/C][C]6.5525[/C][C]0[/C][C]0[/C][/ROW]
[ROW][C]CONS[/C][C]0.558446578230743[/C][C]1.57779[/C][C]0.3539[/C][C]0.724841[/C][C]0.362421[/C][/ROW]
[ROW][C]M1[/C][C]15.0703390719775[/C][C]6.282017[/C][C]2.399[/C][C]0.020135[/C][C]0.010068[/C][/ROW]
[ROW][C]M2[/C][C]0.0912023698377545[/C][C]6.284795[/C][C]0.0145[/C][C]0.988478[/C][C]0.494239[/C][/ROW]
[ROW][C]M3[/C][C]-17.3516358551200[/C][C]6.789906[/C][C]-2.5555[/C][C]0.013628[/C][C]0.006814[/C][/ROW]
[ROW][C]M4[/C][C]5.66072943166297[/C][C]6.420293[/C][C]0.8817[/C][C]0.382079[/C][C]0.19104[/C][/ROW]
[ROW][C]M5[/C][C]-7.69482419975213[/C][C]6.329107[/C][C]-1.2158[/C][C]0.229665[/C][C]0.114833[/C][/ROW]
[ROW][C]M6[/C][C]-26.7889968374189[/C][C]7.03228[/C][C]-3.8094[/C][C]0.000376[/C][C]0.000188[/C][/ROW]
[ROW][C]M7[/C][C]29.169870473176[/C][C]7.078168[/C][C]4.1211[/C][C]0.000139[/C][C]6.9e-05[/C][/ROW]
[ROW][C]M8[/C][C]14.0996172288639[/C][C]6.575314[/C][C]2.1443[/C][C]0.036795[/C][C]0.018397[/C][/ROW]
[ROW][C]M9[/C][C]-13.1599163920929[/C][C]7.466237[/C][C]-1.7626[/C][C]0.083961[/C][C]0.041981[/C][/ROW]
[ROW][C]M10[/C][C]-20.0903115154348[/C][C]7.458708[/C][C]-2.6935[/C][C]0.009545[/C][C]0.004772[/C][/ROW]
[ROW][C]M11[/C][C]-8.88920091771722[/C][C]6.81304[/C][C]-1.3047[/C][C]0.197841[/C][C]0.09892[/C][/ROW]
[ROW][C]t[/C][C]0.29775784415005[/C][C]0.38599[/C][C]0.7714[/C][C]0.444022[/C][C]0.222011[/C][/ROW]
[/TABLE]
Source: https://freestatistics.org/blog/index.php?pk=69501&T=2

Globally Unique Identifier (entire table): ba.freestatistics.org/blog/index.php?pk=69501&T=2

As an alternative you can also use a QR Code:  

The GUIDs for individual cells are displayed in the table below:

Multiple Linear Regression - Ordinary Least Squares
VariableParameterS.D.T-STATH0: parameter = 02-tail p-value1-tail p-value
(Intercept)-98.86710326935159.538486-0.61970.538210.269105
TIP1.581064689273190.241296.552500
CONS0.5584465782307431.577790.35390.7248410.362421
M115.07033907197756.2820172.3990.0201350.010068
M20.09120236983775456.2847950.01450.9884780.494239
M3-17.35163585512006.789906-2.55550.0136280.006814
M45.660729431662976.4202930.88170.3820790.19104
M5-7.694824199752136.329107-1.21580.2296650.114833
M6-26.78899683741897.03228-3.80940.0003760.000188
M729.1698704731767.0781684.12110.0001396.9e-05
M814.09961722886396.5753142.14430.0367950.018397
M9-13.15991639209297.466237-1.76260.0839610.041981
M10-20.09031151543487.458708-2.69350.0095450.004772
M11-8.889200917717226.81304-1.30470.1978410.09892
t0.297757844150050.385990.77140.4440220.222011


Multiple Linear Regression - Regression Statistics
Multiple R0.838957608214395
R-squared0.703849868380818
Adjusted R-squared0.622553753818689
F-TEST (value)8.65785372612018
F-TEST (DF numerator)14
F-TEST (DF denominator)51
p-value3.66045016519934e-09
Multiple Linear Regression - Residual Statistics
Residual Standard Deviation10.3573846658034
Sum Squared Residuals5471.04627288638

\begin{tabular}{lllllllll}
\hline
Multiple Linear Regression - Regression Statistics \tabularnewline
Multiple R & 0.838957608214395 \tabularnewline
R-squared & 0.703849868380818 \tabularnewline
Adjusted R-squared & 0.622553753818689 \tabularnewline
F-TEST (value) & 8.65785372612018 \tabularnewline
F-TEST (DF numerator) & 14 \tabularnewline
F-TEST (DF denominator) & 51 \tabularnewline
p-value & 3.66045016519934e-09 \tabularnewline
Multiple Linear Regression - Residual Statistics \tabularnewline
Residual Standard Deviation & 10.3573846658034 \tabularnewline
Sum Squared Residuals & 5471.04627288638 \tabularnewline
\hline
\end{tabular}
%Source: https://freestatistics.org/blog/index.php?pk=69501&T=3

[TABLE]
[ROW][C]Multiple Linear Regression - Regression Statistics[/C][/ROW]
[ROW][C]Multiple R[/C][C]0.838957608214395[/C][/ROW]
[ROW][C]R-squared[/C][C]0.703849868380818[/C][/ROW]
[ROW][C]Adjusted R-squared[/C][C]0.622553753818689[/C][/ROW]
[ROW][C]F-TEST (value)[/C][C]8.65785372612018[/C][/ROW]
[ROW][C]F-TEST (DF numerator)[/C][C]14[/C][/ROW]
[ROW][C]F-TEST (DF denominator)[/C][C]51[/C][/ROW]
[ROW][C]p-value[/C][C]3.66045016519934e-09[/C][/ROW]
[ROW][C]Multiple Linear Regression - Residual Statistics[/C][/ROW]
[ROW][C]Residual Standard Deviation[/C][C]10.3573846658034[/C][/ROW]
[ROW][C]Sum Squared Residuals[/C][C]5471.04627288638[/C][/ROW]
[/TABLE]
Source: https://freestatistics.org/blog/index.php?pk=69501&T=3

Globally Unique Identifier (entire table): ba.freestatistics.org/blog/index.php?pk=69501&T=3

As an alternative you can also use a QR Code:  

The GUIDs for individual cells are displayed in the table below:

Multiple Linear Regression - Regression Statistics
Multiple R0.838957608214395
R-squared0.703849868380818
Adjusted R-squared0.622553753818689
F-TEST (value)8.65785372612018
F-TEST (DF numerator)14
F-TEST (DF denominator)51
p-value3.66045016519934e-09
Multiple Linear Regression - Residual Statistics
Residual Standard Deviation10.3573846658034
Sum Squared Residuals5471.04627288638


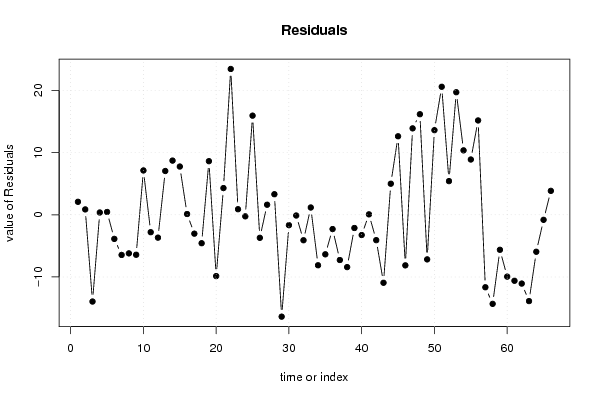
Multiple Linear Regression - Actuals, Interpolation, and Residuals
Time or IndexActualsInterpolationForecastResidualsPrediction Error
1122.74120.6554044776252.08459552237498
2109.84108.9780485292550.861951470745158
3101.99115.940872149901-13.9508721499009
4125.12124.7561807009900.363819299010295
5103.5103.0472048489810.45279515101944
6102.8106.676087925968-3.87608792596849
7118.72125.177032374755-6.4570323747553
8119.01125.216284861720-6.20628486172049
9118.61125.037312699545-6.4273126995446
10120.43113.3013130578487.12868694215156
11111.83114.631107296327-2.80110729632685
12116.79120.466425027763-3.67642502776344
13131.71124.6721332006797.03786679932062
14120.57111.8562666021468.71373339785355
15117.83110.0765165903437.75348340965728
16130.8130.6785934981190.121406501881015
17107.46110.496939289297-3.03693928929685
18112.09116.664593188950-4.57459318894966
19129.47120.8521884475438.61781155245688
20119.72129.579970832706-9.85997083270587
21134.81130.5157902152554.29420978474545
22135.8112.35254963593323.4474503640670
23129.27128.3750765530870.894923446912506
24126.94127.190178916380-0.250178916379806
25153.45137.51388079715715.9361192028427
26121.86125.564987637191-3.70498763719055
27133.47131.853171452321.61682854768012
28135.34132.0371760053433.30282399465723
29117.1133.480499633133-16.3804996331327
30120.65122.321714113145-1.67171411314526
31132.49132.606706643494-0.116706643493797
32137.6141.697119119792-4.09711911979237
33138.69137.5232713046261.16672869537395
34125.53133.651042052369-8.12104205236865
35133.09139.446908681288-6.35690868128815
36129.08131.377924466948-2.29792446694838
37145.94153.215476250509-7.27547625050866
38129.07137.483196767851-8.41319676785085
39139.69141.816516871007-2.12651687100658
40142.09145.348679600415-3.25867960041468
41137.29137.2218481058310.0681518941691958
42127.03131.111300659953-4.08130065995305
43137.25148.181600810875-10.9316008108748
44156.87151.8740554805154.99594451948473
45150.89138.26966418753312.6203358124671
46139.14147.272813934799-8.13281393479876
47158.3144.40633156740913.8936684325905
48149132.83318431949416.1668156805059
49158.36165.531923878736-7.1719238787355
50168.06154.45558862311713.6044113768828
51153.38132.79627727156520.5837227284355
52173.86168.4446496293255.41535037067507
53162.47142.76277580274019.7072241972595
54145.17134.81253681458110.3574631854193
55168.89160.0024717233338.88752827666701
56166.64151.47256970526615.167430294734
57140.07151.723961593042-11.6539615930419
58128.84143.162281319051-14.3222813190511
59123.41129.040575901888-5.630575901888
60120.3130.242287269414-9.94228726941428
61129.67140.281181395294-10.6111813952941
62118.1129.16191184044-11.0619118404401
63113.91127.786645664865-13.8766456648654
64131.09137.034720565809-5.94472056580894
65119.15119.960732320019-0.810732320018646
66122.3118.4537672974033.84623270259718

\begin{tabular}{lllllllll}
\hline
Multiple Linear Regression - Actuals, Interpolation, and Residuals \tabularnewline
Time or Index & Actuals & InterpolationForecast & ResidualsPrediction Error \tabularnewline
1 & 122.74 & 120.655404477625 & 2.08459552237498 \tabularnewline
2 & 109.84 & 108.978048529255 & 0.861951470745158 \tabularnewline
3 & 101.99 & 115.940872149901 & -13.9508721499009 \tabularnewline
4 & 125.12 & 124.756180700990 & 0.363819299010295 \tabularnewline
5 & 103.5 & 103.047204848981 & 0.45279515101944 \tabularnewline
6 & 102.8 & 106.676087925968 & -3.87608792596849 \tabularnewline
7 & 118.72 & 125.177032374755 & -6.4570323747553 \tabularnewline
8 & 119.01 & 125.216284861720 & -6.20628486172049 \tabularnewline
9 & 118.61 & 125.037312699545 & -6.4273126995446 \tabularnewline
10 & 120.43 & 113.301313057848 & 7.12868694215156 \tabularnewline
11 & 111.83 & 114.631107296327 & -2.80110729632685 \tabularnewline
12 & 116.79 & 120.466425027763 & -3.67642502776344 \tabularnewline
13 & 131.71 & 124.672133200679 & 7.03786679932062 \tabularnewline
14 & 120.57 & 111.856266602146 & 8.71373339785355 \tabularnewline
15 & 117.83 & 110.076516590343 & 7.75348340965728 \tabularnewline
16 & 130.8 & 130.678593498119 & 0.121406501881015 \tabularnewline
17 & 107.46 & 110.496939289297 & -3.03693928929685 \tabularnewline
18 & 112.09 & 116.664593188950 & -4.57459318894966 \tabularnewline
19 & 129.47 & 120.852188447543 & 8.61781155245688 \tabularnewline
20 & 119.72 & 129.579970832706 & -9.85997083270587 \tabularnewline
21 & 134.81 & 130.515790215255 & 4.29420978474545 \tabularnewline
22 & 135.8 & 112.352549635933 & 23.4474503640670 \tabularnewline
23 & 129.27 & 128.375076553087 & 0.894923446912506 \tabularnewline
24 & 126.94 & 127.190178916380 & -0.250178916379806 \tabularnewline
25 & 153.45 & 137.513880797157 & 15.9361192028427 \tabularnewline
26 & 121.86 & 125.564987637191 & -3.70498763719055 \tabularnewline
27 & 133.47 & 131.85317145232 & 1.61682854768012 \tabularnewline
28 & 135.34 & 132.037176005343 & 3.30282399465723 \tabularnewline
29 & 117.1 & 133.480499633133 & -16.3804996331327 \tabularnewline
30 & 120.65 & 122.321714113145 & -1.67171411314526 \tabularnewline
31 & 132.49 & 132.606706643494 & -0.116706643493797 \tabularnewline
32 & 137.6 & 141.697119119792 & -4.09711911979237 \tabularnewline
33 & 138.69 & 137.523271304626 & 1.16672869537395 \tabularnewline
34 & 125.53 & 133.651042052369 & -8.12104205236865 \tabularnewline
35 & 133.09 & 139.446908681288 & -6.35690868128815 \tabularnewline
36 & 129.08 & 131.377924466948 & -2.29792446694838 \tabularnewline
37 & 145.94 & 153.215476250509 & -7.27547625050866 \tabularnewline
38 & 129.07 & 137.483196767851 & -8.41319676785085 \tabularnewline
39 & 139.69 & 141.816516871007 & -2.12651687100658 \tabularnewline
40 & 142.09 & 145.348679600415 & -3.25867960041468 \tabularnewline
41 & 137.29 & 137.221848105831 & 0.0681518941691958 \tabularnewline
42 & 127.03 & 131.111300659953 & -4.08130065995305 \tabularnewline
43 & 137.25 & 148.181600810875 & -10.9316008108748 \tabularnewline
44 & 156.87 & 151.874055480515 & 4.99594451948473 \tabularnewline
45 & 150.89 & 138.269664187533 & 12.6203358124671 \tabularnewline
46 & 139.14 & 147.272813934799 & -8.13281393479876 \tabularnewline
47 & 158.3 & 144.406331567409 & 13.8936684325905 \tabularnewline
48 & 149 & 132.833184319494 & 16.1668156805059 \tabularnewline
49 & 158.36 & 165.531923878736 & -7.1719238787355 \tabularnewline
50 & 168.06 & 154.455588623117 & 13.6044113768828 \tabularnewline
51 & 153.38 & 132.796277271565 & 20.5837227284355 \tabularnewline
52 & 173.86 & 168.444649629325 & 5.41535037067507 \tabularnewline
53 & 162.47 & 142.762775802740 & 19.7072241972595 \tabularnewline
54 & 145.17 & 134.812536814581 & 10.3574631854193 \tabularnewline
55 & 168.89 & 160.002471723333 & 8.88752827666701 \tabularnewline
56 & 166.64 & 151.472569705266 & 15.167430294734 \tabularnewline
57 & 140.07 & 151.723961593042 & -11.6539615930419 \tabularnewline
58 & 128.84 & 143.162281319051 & -14.3222813190511 \tabularnewline
59 & 123.41 & 129.040575901888 & -5.630575901888 \tabularnewline
60 & 120.3 & 130.242287269414 & -9.94228726941428 \tabularnewline
61 & 129.67 & 140.281181395294 & -10.6111813952941 \tabularnewline
62 & 118.1 & 129.16191184044 & -11.0619118404401 \tabularnewline
63 & 113.91 & 127.786645664865 & -13.8766456648654 \tabularnewline
64 & 131.09 & 137.034720565809 & -5.94472056580894 \tabularnewline
65 & 119.15 & 119.960732320019 & -0.810732320018646 \tabularnewline
66 & 122.3 & 118.453767297403 & 3.84623270259718 \tabularnewline
\hline
\end{tabular}
%Source: https://freestatistics.org/blog/index.php?pk=69501&T=4

[TABLE]
[ROW][C]Multiple Linear Regression - Actuals, Interpolation, and Residuals[/C][/ROW]
[ROW][C]Time or Index[/C][C]Actuals[/C][C]InterpolationForecast[/C][C]ResidualsPrediction Error[/C][/ROW]
[ROW][C]1[/C][C]122.74[/C][C]120.655404477625[/C][C]2.08459552237498[/C][/ROW]
[ROW][C]2[/C][C]109.84[/C][C]108.978048529255[/C][C]0.861951470745158[/C][/ROW]
[ROW][C]3[/C][C]101.99[/C][C]115.940872149901[/C][C]-13.9508721499009[/C][/ROW]
[ROW][C]4[/C][C]125.12[/C][C]124.756180700990[/C][C]0.363819299010295[/C][/ROW]
[ROW][C]5[/C][C]103.5[/C][C]103.047204848981[/C][C]0.45279515101944[/C][/ROW]
[ROW][C]6[/C][C]102.8[/C][C]106.676087925968[/C][C]-3.87608792596849[/C][/ROW]
[ROW][C]7[/C][C]118.72[/C][C]125.177032374755[/C][C]-6.4570323747553[/C][/ROW]
[ROW][C]8[/C][C]119.01[/C][C]125.216284861720[/C][C]-6.20628486172049[/C][/ROW]
[ROW][C]9[/C][C]118.61[/C][C]125.037312699545[/C][C]-6.4273126995446[/C][/ROW]
[ROW][C]10[/C][C]120.43[/C][C]113.301313057848[/C][C]7.12868694215156[/C][/ROW]
[ROW][C]11[/C][C]111.83[/C][C]114.631107296327[/C][C]-2.80110729632685[/C][/ROW]
[ROW][C]12[/C][C]116.79[/C][C]120.466425027763[/C][C]-3.67642502776344[/C][/ROW]
[ROW][C]13[/C][C]131.71[/C][C]124.672133200679[/C][C]7.03786679932062[/C][/ROW]
[ROW][C]14[/C][C]120.57[/C][C]111.856266602146[/C][C]8.71373339785355[/C][/ROW]
[ROW][C]15[/C][C]117.83[/C][C]110.076516590343[/C][C]7.75348340965728[/C][/ROW]
[ROW][C]16[/C][C]130.8[/C][C]130.678593498119[/C][C]0.121406501881015[/C][/ROW]
[ROW][C]17[/C][C]107.46[/C][C]110.496939289297[/C][C]-3.03693928929685[/C][/ROW]
[ROW][C]18[/C][C]112.09[/C][C]116.664593188950[/C][C]-4.57459318894966[/C][/ROW]
[ROW][C]19[/C][C]129.47[/C][C]120.852188447543[/C][C]8.61781155245688[/C][/ROW]
[ROW][C]20[/C][C]119.72[/C][C]129.579970832706[/C][C]-9.85997083270587[/C][/ROW]
[ROW][C]21[/C][C]134.81[/C][C]130.515790215255[/C][C]4.29420978474545[/C][/ROW]
[ROW][C]22[/C][C]135.8[/C][C]112.352549635933[/C][C]23.4474503640670[/C][/ROW]
[ROW][C]23[/C][C]129.27[/C][C]128.375076553087[/C][C]0.894923446912506[/C][/ROW]
[ROW][C]24[/C][C]126.94[/C][C]127.190178916380[/C][C]-0.250178916379806[/C][/ROW]
[ROW][C]25[/C][C]153.45[/C][C]137.513880797157[/C][C]15.9361192028427[/C][/ROW]
[ROW][C]26[/C][C]121.86[/C][C]125.564987637191[/C][C]-3.70498763719055[/C][/ROW]
[ROW][C]27[/C][C]133.47[/C][C]131.85317145232[/C][C]1.61682854768012[/C][/ROW]
[ROW][C]28[/C][C]135.34[/C][C]132.037176005343[/C][C]3.30282399465723[/C][/ROW]
[ROW][C]29[/C][C]117.1[/C][C]133.480499633133[/C][C]-16.3804996331327[/C][/ROW]
[ROW][C]30[/C][C]120.65[/C][C]122.321714113145[/C][C]-1.67171411314526[/C][/ROW]
[ROW][C]31[/C][C]132.49[/C][C]132.606706643494[/C][C]-0.116706643493797[/C][/ROW]
[ROW][C]32[/C][C]137.6[/C][C]141.697119119792[/C][C]-4.09711911979237[/C][/ROW]
[ROW][C]33[/C][C]138.69[/C][C]137.523271304626[/C][C]1.16672869537395[/C][/ROW]
[ROW][C]34[/C][C]125.53[/C][C]133.651042052369[/C][C]-8.12104205236865[/C][/ROW]
[ROW][C]35[/C][C]133.09[/C][C]139.446908681288[/C][C]-6.35690868128815[/C][/ROW]
[ROW][C]36[/C][C]129.08[/C][C]131.377924466948[/C][C]-2.29792446694838[/C][/ROW]
[ROW][C]37[/C][C]145.94[/C][C]153.215476250509[/C][C]-7.27547625050866[/C][/ROW]
[ROW][C]38[/C][C]129.07[/C][C]137.483196767851[/C][C]-8.41319676785085[/C][/ROW]
[ROW][C]39[/C][C]139.69[/C][C]141.816516871007[/C][C]-2.12651687100658[/C][/ROW]
[ROW][C]40[/C][C]142.09[/C][C]145.348679600415[/C][C]-3.25867960041468[/C][/ROW]
[ROW][C]41[/C][C]137.29[/C][C]137.221848105831[/C][C]0.0681518941691958[/C][/ROW]
[ROW][C]42[/C][C]127.03[/C][C]131.111300659953[/C][C]-4.08130065995305[/C][/ROW]
[ROW][C]43[/C][C]137.25[/C][C]148.181600810875[/C][C]-10.9316008108748[/C][/ROW]
[ROW][C]44[/C][C]156.87[/C][C]151.874055480515[/C][C]4.99594451948473[/C][/ROW]
[ROW][C]45[/C][C]150.89[/C][C]138.269664187533[/C][C]12.6203358124671[/C][/ROW]
[ROW][C]46[/C][C]139.14[/C][C]147.272813934799[/C][C]-8.13281393479876[/C][/ROW]
[ROW][C]47[/C][C]158.3[/C][C]144.406331567409[/C][C]13.8936684325905[/C][/ROW]
[ROW][C]48[/C][C]149[/C][C]132.833184319494[/C][C]16.1668156805059[/C][/ROW]
[ROW][C]49[/C][C]158.36[/C][C]165.531923878736[/C][C]-7.1719238787355[/C][/ROW]
[ROW][C]50[/C][C]168.06[/C][C]154.455588623117[/C][C]13.6044113768828[/C][/ROW]
[ROW][C]51[/C][C]153.38[/C][C]132.796277271565[/C][C]20.5837227284355[/C][/ROW]
[ROW][C]52[/C][C]173.86[/C][C]168.444649629325[/C][C]5.41535037067507[/C][/ROW]
[ROW][C]53[/C][C]162.47[/C][C]142.762775802740[/C][C]19.7072241972595[/C][/ROW]
[ROW][C]54[/C][C]145.17[/C][C]134.812536814581[/C][C]10.3574631854193[/C][/ROW]
[ROW][C]55[/C][C]168.89[/C][C]160.002471723333[/C][C]8.88752827666701[/C][/ROW]
[ROW][C]56[/C][C]166.64[/C][C]151.472569705266[/C][C]15.167430294734[/C][/ROW]
[ROW][C]57[/C][C]140.07[/C][C]151.723961593042[/C][C]-11.6539615930419[/C][/ROW]
[ROW][C]58[/C][C]128.84[/C][C]143.162281319051[/C][C]-14.3222813190511[/C][/ROW]
[ROW][C]59[/C][C]123.41[/C][C]129.040575901888[/C][C]-5.630575901888[/C][/ROW]
[ROW][C]60[/C][C]120.3[/C][C]130.242287269414[/C][C]-9.94228726941428[/C][/ROW]
[ROW][C]61[/C][C]129.67[/C][C]140.281181395294[/C][C]-10.6111813952941[/C][/ROW]
[ROW][C]62[/C][C]118.1[/C][C]129.16191184044[/C][C]-11.0619118404401[/C][/ROW]
[ROW][C]63[/C][C]113.91[/C][C]127.786645664865[/C][C]-13.8766456648654[/C][/ROW]
[ROW][C]64[/C][C]131.09[/C][C]137.034720565809[/C][C]-5.94472056580894[/C][/ROW]
[ROW][C]65[/C][C]119.15[/C][C]119.960732320019[/C][C]-0.810732320018646[/C][/ROW]
[ROW][C]66[/C][C]122.3[/C][C]118.453767297403[/C][C]3.84623270259718[/C][/ROW]
[/TABLE]
Source: https://freestatistics.org/blog/index.php?pk=69501&T=4

Globally Unique Identifier (entire table): ba.freestatistics.org/blog/index.php?pk=69501&T=4

As an alternative you can also use a QR Code:  

The GUIDs for individual cells are displayed in the table below:

Multiple Linear Regression - Actuals, Interpolation, and Residuals
Time or IndexActualsInterpolationForecastResidualsPrediction Error
1122.74120.6554044776252.08459552237498
2109.84108.9780485292550.861951470745158
3101.99115.940872149901-13.9508721499009
4125.12124.7561807009900.363819299010295
5103.5103.0472048489810.45279515101944
6102.8106.676087925968-3.87608792596849
7118.72125.177032374755-6.4570323747553
8119.01125.216284861720-6.20628486172049
9118.61125.037312699545-6.4273126995446
10120.43113.3013130578487.12868694215156
11111.83114.631107296327-2.80110729632685
12116.79120.466425027763-3.67642502776344
13131.71124.6721332006797.03786679932062
14120.57111.8562666021468.71373339785355
15117.83110.0765165903437.75348340965728
16130.8130.6785934981190.121406501881015
17107.46110.496939289297-3.03693928929685
18112.09116.664593188950-4.57459318894966
19129.47120.8521884475438.61781155245688
20119.72129.579970832706-9.85997083270587
21134.81130.5157902152554.29420978474545
22135.8112.35254963593323.4474503640670
23129.27128.3750765530870.894923446912506
24126.94127.190178916380-0.250178916379806
25153.45137.51388079715715.9361192028427
26121.86125.564987637191-3.70498763719055
27133.47131.853171452321.61682854768012
28135.34132.0371760053433.30282399465723
29117.1133.480499633133-16.3804996331327
30120.65122.321714113145-1.67171411314526
31132.49132.606706643494-0.116706643493797
32137.6141.697119119792-4.09711911979237
33138.69137.5232713046261.16672869537395
34125.53133.651042052369-8.12104205236865
35133.09139.446908681288-6.35690868128815
36129.08131.377924466948-2.29792446694838
37145.94153.215476250509-7.27547625050866
38129.07137.483196767851-8.41319676785085
39139.69141.816516871007-2.12651687100658
40142.09145.348679600415-3.25867960041468
41137.29137.2218481058310.0681518941691958
42127.03131.111300659953-4.08130065995305
43137.25148.181600810875-10.9316008108748
44156.87151.8740554805154.99594451948473
45150.89138.26966418753312.6203358124671
46139.14147.272813934799-8.13281393479876
47158.3144.40633156740913.8936684325905
48149132.83318431949416.1668156805059
49158.36165.531923878736-7.1719238787355
50168.06154.45558862311713.6044113768828
51153.38132.79627727156520.5837227284355
52173.86168.4446496293255.41535037067507
53162.47142.76277580274019.7072241972595
54145.17134.81253681458110.3574631854193
55168.89160.0024717233338.88752827666701
56166.64151.47256970526615.167430294734
57140.07151.723961593042-11.6539615930419
58128.84143.162281319051-14.3222813190511
59123.41129.040575901888-5.630575901888
60120.3130.242287269414-9.94228726941428
61129.67140.281181395294-10.6111813952941
62118.1129.16191184044-11.0619118404401
63113.91127.786645664865-13.8766456648654
64131.09137.034720565809-5.94472056580894
65119.15119.960732320019-0.810732320018646
66122.3118.4537672974033.84623270259718


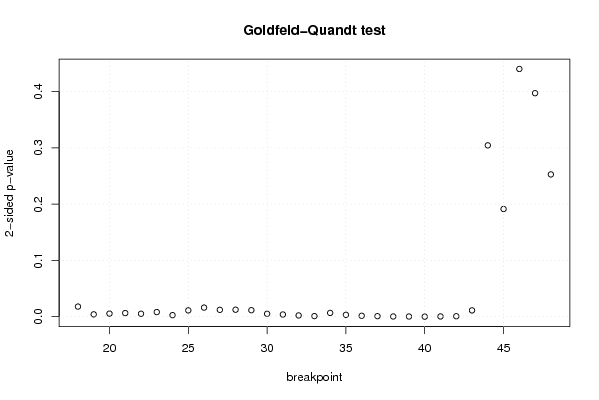
Goldfeld-Quandt test for Heteroskedasticity
p-valuesAlternative Hypothesis
breakpoint indexgreater2-sidedless
180.009027110282438630.01805422056487730.990972889717561
190.00213444551421250.0042688910284250.997865554485788
200.002793708511220090.005587417022440180.99720629148878
210.003257333066733780.006514666133467560.996742666933266
220.002658511193653120.005317022387306250.997341488806347
230.004144865553654110.008289731107308210.995855134446346
240.001403734111142260.002807468222284530.998596265888858
250.005652187340736710.01130437468147340.994347812659263
260.00813188727205470.01626377454410940.991868112727945
270.006138758577685690.01227751715537140.993861241422314
280.006236627955645790.01247325591129160.993763372044354
290.005803503139136790.01160700627827360.994196496860863
300.002640659690800730.005281319381601460.9973593403092
310.001989633311685590.003979266623371190.998010366688314
320.001167038776036110.002334077552072220.998832961223964
330.0005632367182091710.001126473436418340.99943676328179
340.003389898149975740.006779796299951490.996610101850024
350.001704265162097410.003408530324194820.998295734837903
360.0008482624973088850.001696524994617770.99915173750269
370.000496614218330180.000993228436660360.99950338578167
380.0002262741771124100.0004525483542248210.999773725822888
390.0001964792559476860.0003929585118953730.999803520744052
408.1311543453537e-050.0001626230869070740.999918688456547
410.0002618440589537940.0005236881179075880.999738155941046
420.0004493485857026330.0008986971714052670.999550651414297
430.005636870148470380.01127374029694080.99436312985153
440.1522781085699790.3045562171399590.847721891430021
450.0957229340676030.1914458681352060.904277065932397
460.2201447016659130.4402894033318260.779855298334087
470.1986115356816340.3972230713632680.801388464318366
480.1264640111723330.2529280223446650.873535988827667

\begin{tabular}{lllllllll}
\hline
Goldfeld-Quandt test for Heteroskedasticity \tabularnewline
p-values & Alternative Hypothesis \tabularnewline
breakpoint index & greater & 2-sided & less \tabularnewline
18 & 0.00902711028243863 & 0.0180542205648773 & 0.990972889717561 \tabularnewline
19 & 0.0021344455142125 & 0.004268891028425 & 0.997865554485788 \tabularnewline
20 & 0.00279370851122009 & 0.00558741702244018 & 0.99720629148878 \tabularnewline
21 & 0.00325733306673378 & 0.00651466613346756 & 0.996742666933266 \tabularnewline
22 & 0.00265851119365312 & 0.00531702238730625 & 0.997341488806347 \tabularnewline
23 & 0.00414486555365411 & 0.00828973110730821 & 0.995855134446346 \tabularnewline
24 & 0.00140373411114226 & 0.00280746822228453 & 0.998596265888858 \tabularnewline
25 & 0.00565218734073671 & 0.0113043746814734 & 0.994347812659263 \tabularnewline
26 & 0.0081318872720547 & 0.0162637745441094 & 0.991868112727945 \tabularnewline
27 & 0.00613875857768569 & 0.0122775171553714 & 0.993861241422314 \tabularnewline
28 & 0.00623662795564579 & 0.0124732559112916 & 0.993763372044354 \tabularnewline
29 & 0.00580350313913679 & 0.0116070062782736 & 0.994196496860863 \tabularnewline
30 & 0.00264065969080073 & 0.00528131938160146 & 0.9973593403092 \tabularnewline
31 & 0.00198963331168559 & 0.00397926662337119 & 0.998010366688314 \tabularnewline
32 & 0.00116703877603611 & 0.00233407755207222 & 0.998832961223964 \tabularnewline
33 & 0.000563236718209171 & 0.00112647343641834 & 0.99943676328179 \tabularnewline
34 & 0.00338989814997574 & 0.00677979629995149 & 0.996610101850024 \tabularnewline
35 & 0.00170426516209741 & 0.00340853032419482 & 0.998295734837903 \tabularnewline
36 & 0.000848262497308885 & 0.00169652499461777 & 0.99915173750269 \tabularnewline
37 & 0.00049661421833018 & 0.00099322843666036 & 0.99950338578167 \tabularnewline
38 & 0.000226274177112410 & 0.000452548354224821 & 0.999773725822888 \tabularnewline
39 & 0.000196479255947686 & 0.000392958511895373 & 0.999803520744052 \tabularnewline
40 & 8.1311543453537e-05 & 0.000162623086907074 & 0.999918688456547 \tabularnewline
41 & 0.000261844058953794 & 0.000523688117907588 & 0.999738155941046 \tabularnewline
42 & 0.000449348585702633 & 0.000898697171405267 & 0.999550651414297 \tabularnewline
43 & 0.00563687014847038 & 0.0112737402969408 & 0.99436312985153 \tabularnewline
44 & 0.152278108569979 & 0.304556217139959 & 0.847721891430021 \tabularnewline
45 & 0.095722934067603 & 0.191445868135206 & 0.904277065932397 \tabularnewline
46 & 0.220144701665913 & 0.440289403331826 & 0.779855298334087 \tabularnewline
47 & 0.198611535681634 & 0.397223071363268 & 0.801388464318366 \tabularnewline
48 & 0.126464011172333 & 0.252928022344665 & 0.873535988827667 \tabularnewline
\hline
\end{tabular}
%Source: https://freestatistics.org/blog/index.php?pk=69501&T=5

[TABLE]
[ROW][C]Goldfeld-Quandt test for Heteroskedasticity[/C][/ROW]
[ROW][C]p-values[/C][C]Alternative Hypothesis[/C][/ROW]
[ROW][C]breakpoint index[/C][C]greater[/C][C]2-sided[/C][C]less[/C][/ROW]
[ROW][C]18[/C][C]0.00902711028243863[/C][C]0.0180542205648773[/C][C]0.990972889717561[/C][/ROW]
[ROW][C]19[/C][C]0.0021344455142125[/C][C]0.004268891028425[/C][C]0.997865554485788[/C][/ROW]
[ROW][C]20[/C][C]0.00279370851122009[/C][C]0.00558741702244018[/C][C]0.99720629148878[/C][/ROW]
[ROW][C]21[/C][C]0.00325733306673378[/C][C]0.00651466613346756[/C][C]0.996742666933266[/C][/ROW]
[ROW][C]22[/C][C]0.00265851119365312[/C][C]0.00531702238730625[/C][C]0.997341488806347[/C][/ROW]
[ROW][C]23[/C][C]0.00414486555365411[/C][C]0.00828973110730821[/C][C]0.995855134446346[/C][/ROW]
[ROW][C]24[/C][C]0.00140373411114226[/C][C]0.00280746822228453[/C][C]0.998596265888858[/C][/ROW]
[ROW][C]25[/C][C]0.00565218734073671[/C][C]0.0113043746814734[/C][C]0.994347812659263[/C][/ROW]
[ROW][C]26[/C][C]0.0081318872720547[/C][C]0.0162637745441094[/C][C]0.991868112727945[/C][/ROW]
[ROW][C]27[/C][C]0.00613875857768569[/C][C]0.0122775171553714[/C][C]0.993861241422314[/C][/ROW]
[ROW][C]28[/C][C]0.00623662795564579[/C][C]0.0124732559112916[/C][C]0.993763372044354[/C][/ROW]
[ROW][C]29[/C][C]0.00580350313913679[/C][C]0.0116070062782736[/C][C]0.994196496860863[/C][/ROW]
[ROW][C]30[/C][C]0.00264065969080073[/C][C]0.00528131938160146[/C][C]0.9973593403092[/C][/ROW]
[ROW][C]31[/C][C]0.00198963331168559[/C][C]0.00397926662337119[/C][C]0.998010366688314[/C][/ROW]
[ROW][C]32[/C][C]0.00116703877603611[/C][C]0.00233407755207222[/C][C]0.998832961223964[/C][/ROW]
[ROW][C]33[/C][C]0.000563236718209171[/C][C]0.00112647343641834[/C][C]0.99943676328179[/C][/ROW]
[ROW][C]34[/C][C]0.00338989814997574[/C][C]0.00677979629995149[/C][C]0.996610101850024[/C][/ROW]
[ROW][C]35[/C][C]0.00170426516209741[/C][C]0.00340853032419482[/C][C]0.998295734837903[/C][/ROW]
[ROW][C]36[/C][C]0.000848262497308885[/C][C]0.00169652499461777[/C][C]0.99915173750269[/C][/ROW]
[ROW][C]37[/C][C]0.00049661421833018[/C][C]0.00099322843666036[/C][C]0.99950338578167[/C][/ROW]
[ROW][C]38[/C][C]0.000226274177112410[/C][C]0.000452548354224821[/C][C]0.999773725822888[/C][/ROW]
[ROW][C]39[/C][C]0.000196479255947686[/C][C]0.000392958511895373[/C][C]0.999803520744052[/C][/ROW]
[ROW][C]40[/C][C]8.1311543453537e-05[/C][C]0.000162623086907074[/C][C]0.999918688456547[/C][/ROW]
[ROW][C]41[/C][C]0.000261844058953794[/C][C]0.000523688117907588[/C][C]0.999738155941046[/C][/ROW]
[ROW][C]42[/C][C]0.000449348585702633[/C][C]0.000898697171405267[/C][C]0.999550651414297[/C][/ROW]
[ROW][C]43[/C][C]0.00563687014847038[/C][C]0.0112737402969408[/C][C]0.99436312985153[/C][/ROW]
[ROW][C]44[/C][C]0.152278108569979[/C][C]0.304556217139959[/C][C]0.847721891430021[/C][/ROW]
[ROW][C]45[/C][C]0.095722934067603[/C][C]0.191445868135206[/C][C]0.904277065932397[/C][/ROW]
[ROW][C]46[/C][C]0.220144701665913[/C][C]0.440289403331826[/C][C]0.779855298334087[/C][/ROW]
[ROW][C]47[/C][C]0.198611535681634[/C][C]0.397223071363268[/C][C]0.801388464318366[/C][/ROW]
[ROW][C]48[/C][C]0.126464011172333[/C][C]0.252928022344665[/C][C]0.873535988827667[/C][/ROW]
[/TABLE]
Source: https://freestatistics.org/blog/index.php?pk=69501&T=5

Globally Unique Identifier (entire table): ba.freestatistics.org/blog/index.php?pk=69501&T=5

As an alternative you can also use a QR Code:  

The GUIDs for individual cells are displayed in the table below:

Goldfeld-Quandt test for Heteroskedasticity
p-valuesAlternative Hypothesis
breakpoint indexgreater2-sidedless
180.009027110282438630.01805422056487730.990972889717561
190.00213444551421250.0042688910284250.997865554485788
200.002793708511220090.005587417022440180.99720629148878
210.003257333066733780.006514666133467560.996742666933266
220.002658511193653120.005317022387306250.997341488806347
230.004144865553654110.008289731107308210.995855134446346
240.001403734111142260.002807468222284530.998596265888858
250.005652187340736710.01130437468147340.994347812659263
260.00813188727205470.01626377454410940.991868112727945
270.006138758577685690.01227751715537140.993861241422314
280.006236627955645790.01247325591129160.993763372044354
290.005803503139136790.01160700627827360.994196496860863
300.002640659690800730.005281319381601460.9973593403092
310.001989633311685590.003979266623371190.998010366688314
320.001167038776036110.002334077552072220.998832961223964
330.0005632367182091710.001126473436418340.99943676328179
340.003389898149975740.006779796299951490.996610101850024
350.001704265162097410.003408530324194820.998295734837903
360.0008482624973088850.001696524994617770.99915173750269
370.000496614218330180.000993228436660360.99950338578167
380.0002262741771124100.0004525483542248210.999773725822888
390.0001964792559476860.0003929585118953730.999803520744052
408.1311543453537e-050.0001626230869070740.999918688456547
410.0002618440589537940.0005236881179075880.999738155941046
420.0004493485857026330.0008986971714052670.999550651414297
430.005636870148470380.01127374029694080.99436312985153
440.1522781085699790.3045562171399590.847721891430021
450.0957229340676030.1914458681352060.904277065932397
460.2201447016659130.4402894033318260.779855298334087
470.1986115356816340.3972230713632680.801388464318366
480.1264640111723330.2529280223446650.873535988827667


Meta Analysis of Goldfeld-Quandt test for Heteroskedasticity
Description# significant tests% significant testsOK/NOK
1% type I error level190.612903225806452NOK
5% type I error level260.838709677419355NOK
10% type I error level260.838709677419355NOK

\begin{tabular}{lllllllll}
\hline
Meta Analysis of Goldfeld-Quandt test for Heteroskedasticity \tabularnewline
Description & # significant tests & % significant tests & OK/NOK \tabularnewline
1% type I error level & 19 & 0.612903225806452 & NOK \tabularnewline
5% type I error level & 26 & 0.838709677419355 & NOK \tabularnewline
10% type I error level & 26 & 0.838709677419355 & NOK \tabularnewline
\hline
\end{tabular}
%Source: https://freestatistics.org/blog/index.php?pk=69501&T=6

[TABLE]
[ROW][C]Meta Analysis of Goldfeld-Quandt test for Heteroskedasticity[/C][/ROW]
[ROW][C]Description[/C][C]# significant tests[/C][C]% significant tests[/C][C]OK/NOK[/C][/ROW]
[ROW][C]1% type I error level[/C][C]19[/C][C]0.612903225806452[/C][C]NOK[/C][/ROW]
[ROW][C]5% type I error level[/C][C]26[/C][C]0.838709677419355[/C][C]NOK[/C][/ROW]
[ROW][C]10% type I error level[/C][C]26[/C][C]0.838709677419355[/C][C]NOK[/C][/ROW]
[/TABLE]
Source: https://freestatistics.org/blog/index.php?pk=69501&T=6

Globally Unique Identifier (entire table): ba.freestatistics.org/blog/index.php?pk=69501&T=6

As an alternative you can also use a QR Code:  

The GUIDs for individual cells are displayed in the table below:

Meta Analysis of Goldfeld-Quandt test for Heteroskedasticity
Description# significant tests% significant testsOK/NOK
1% type I error level190.612903225806452NOK
5% type I error level260.838709677419355NOK
10% type I error level260.838709677419355NOK


Parameters (Session):
par1 = 1 ; par2 = Include Monthly Dummies ; par3 = Linear Trend ;
Parameters (R input):
par1 = 1 ; par2 = Include Monthly Dummies ; par3 = Linear Trend ;
R code (references can be found in the software module):
library(lattice)
library(lmtest)
n25 <- 25 #minimum number of obs. for Goldfeld-Quandt test
par1 <- as.numeric(par1)
x <- t(y)
k <- length(x[1,])
n <- length(x[,1])
x1 <- cbind(x[,par1], x[,1:k!=par1])
mycolnames <- c(colnames(x)[par1], colnames(x)[1:k!=par1])
colnames(x1) <- mycolnames #colnames(x)[par1]
x <- x1
if (par3 == 'First Differences'){
x2 <- array(0, dim=c(n-1,k), dimnames=list(1:(n-1), paste('(1-B)',colnames(x),sep='')))
for (i in 1:n-1) {
for (j in 1:k) {
x2[i,j] <- x[i+1,j] - x[i,j]
}
}
x <- x2
}
if (par2 == 'Include Monthly Dummies'){
x2 <- array(0, dim=c(n,11), dimnames=list(1:n, paste('M', seq(1:11), sep ='')))
for (i in 1:11){
x2[seq(i,n,12),i] <- 1
}
x <- cbind(x, x2)
}
if (par2 == 'Include Quarterly Dummies'){
x2 <- array(0, dim=c(n,3), dimnames=list(1:n, paste('Q', seq(1:3), sep ='')))
for (i in 1:3){
x2[seq(i,n,4),i] <- 1
}
x <- cbind(x, x2)
}
k <- length(x[1,])
if (par3 == 'Linear Trend'){
x <- cbind(x, c(1:n))
colnames(x)[k+1] <- 't'
}
x
k <- length(x[1,])
df <- as.data.frame(x)
(mylm <- lm(df))
(mysum <- summary(mylm))
if (n > n25) {
kp3 <- k + 3
nmkm3 <- n - k - 3
gqarr <- array(NA, dim=c(nmkm3-kp3+1,3))
numgqtests <- 0
numsignificant1 <- 0
numsignificant5 <- 0
numsignificant10 <- 0
for (mypoint in kp3:nmkm3) {
j <- 0
numgqtests <- numgqtests + 1
for (myalt in c('greater', 'two.sided', 'less')) {
j <- j + 1
gqarr[mypoint-kp3+1,j] <- gqtest(mylm, point=mypoint, alternative=myalt)$p.value
}
if (gqarr[mypoint-kp3+1,2] < 0.01) numsignificant1 <- numsignificant1 + 1
if (gqarr[mypoint-kp3+1,2] < 0.05) numsignificant5 <- numsignificant5 + 1
if (gqarr[mypoint-kp3+1,2] < 0.10) numsignificant10 <- numsignificant10 + 1
}
gqarr
}
bitmap(file='test0.png')
plot(x[,1], type='l', main='Actuals and Interpolation', ylab='value of Actuals and Interpolation (dots)', xlab='time or index')
points(x[,1]-mysum$resid)
grid()
dev.off()
bitmap(file='test1.png')
plot(mysum$resid, type='b', pch=19, main='Residuals', ylab='value of Residuals', xlab='time or index')
grid()
dev.off()
bitmap(file='test2.png')
hist(mysum$resid, main='Residual Histogram', xlab='values of Residuals')
grid()
dev.off()
bitmap(file='test3.png')
densityplot(~mysum$resid,col='black',main='Residual Density Plot', xlab='values of Residuals')
dev.off()
bitmap(file='test4.png')
qqnorm(mysum$resid, main='Residual Normal Q-Q Plot')
qqline(mysum$resid)
grid()
dev.off()
(myerror <- as.ts(mysum$resid))
bitmap(file='test5.png')
dum <- cbind(lag(myerror,k=1),myerror)
dum
dum1 <- dum[2:length(myerror),]
dum1
z <- as.data.frame(dum1)
z
plot(z,main=paste('Residual Lag plot, lowess, and regression line'), ylab='values of Residuals', xlab='lagged values of Residuals')
lines(lowess(z))
abline(lm(z))
grid()
dev.off()
bitmap(file='test6.png')
acf(mysum$resid, lag.max=length(mysum$resid)/2, main='Residual Autocorrelation Function')
grid()
dev.off()
bitmap(file='test7.png')
pacf(mysum$resid, lag.max=length(mysum$resid)/2, main='Residual Partial Autocorrelation Function')
grid()
dev.off()
bitmap(file='test8.png')
opar <- par(mfrow = c(2,2), oma = c(0, 0, 1.1, 0))
plot(mylm, las = 1, sub='Residual Diagnostics')
par(opar)
dev.off()
if (n > n25) {
bitmap(file='test9.png')
plot(kp3:nmkm3,gqarr[,2], main='Goldfeld-Quandt test',ylab='2-sided p-value',xlab='breakpoint')
grid()
dev.off()
}
load(file='createtable')
a<-table.start()
a<-table.row.start(a)
a<-table.element(a, 'Multiple Linear Regression - Estimated Regression Equation', 1, TRUE)
a<-table.row.end(a)
myeq <- colnames(x)[1]
myeq <- paste(myeq, '[t] = ', sep='')
for (i in 1:k){
if (mysum$coefficients[i,1] > 0) myeq <- paste(myeq, '+', '')
myeq <- paste(myeq, mysum$coefficients[i,1], sep=' ')
if (rownames(mysum$coefficients)[i] != '(Intercept)') {
myeq <- paste(myeq, rownames(mysum$coefficients)[i], sep='')
if (rownames(mysum$coefficients)[i] != 't') myeq <- paste(myeq, '[t]', sep='')
}
}
myeq <- paste(myeq, ' + e[t]')
a<-table.row.start(a)
a<-table.element(a, myeq)
a<-table.row.end(a)
a<-table.end(a)
table.save(a,file='mytable1.tab')
a<-table.start()
a<-table.row.start(a)
a<-table.element(a,hyperlink('ols1.htm','Multiple Linear Regression - Ordinary Least Squares',''), 6, TRUE)
a<-table.row.end(a)
a<-table.row.start(a)
a<-table.element(a,'Variable',header=TRUE)
a<-table.element(a,'Parameter',header=TRUE)
a<-table.element(a,'S.D.',header=TRUE)
a<-table.element(a,'T-STAT
H0: parameter = 0',header=TRUE)
a<-table.element(a,'2-tail p-value',header=TRUE)
a<-table.element(a,'1-tail p-value',header=TRUE)
a<-table.row.end(a)
for (i in 1:k){
a<-table.row.start(a)
a<-table.element(a,rownames(mysum$coefficients)[i],header=TRUE)
a<-table.element(a,mysum$coefficients[i,1])
a<-table.element(a, round(mysum$coefficients[i,2],6))
a<-table.element(a, round(mysum$coefficients[i,3],4))
a<-table.element(a, round(mysum$coefficients[i,4],6))
a<-table.element(a, round(mysum$coefficients[i,4]/2,6))
a<-table.row.end(a)
}
a<-table.end(a)
table.save(a,file='mytable2.tab')
a<-table.start()
a<-table.row.start(a)
a<-table.element(a, 'Multiple Linear Regression - Regression Statistics', 2, TRUE)
a<-table.row.end(a)
a<-table.row.start(a)
a<-table.element(a, 'Multiple R',1,TRUE)
a<-table.element(a, sqrt(mysum$r.squared))
a<-table.row.end(a)
a<-table.row.start(a)
a<-table.element(a, 'R-squared',1,TRUE)
a<-table.element(a, mysum$r.squared)
a<-table.row.end(a)
a<-table.row.start(a)
a<-table.element(a, 'Adjusted R-squared',1,TRUE)
a<-table.element(a, mysum$adj.r.squared)
a<-table.row.end(a)
a<-table.row.start(a)
a<-table.element(a, 'F-TEST (value)',1,TRUE)
a<-table.element(a, mysum$fstatistic[1])
a<-table.row.end(a)
a<-table.row.start(a)
a<-table.element(a, 'F-TEST (DF numerator)',1,TRUE)
a<-table.element(a, mysum$fstatistic[2])
a<-table.row.end(a)
a<-table.row.start(a)
a<-table.element(a, 'F-TEST (DF denominator)',1,TRUE)
a<-table.element(a, mysum$fstatistic[3])
a<-table.row.end(a)
a<-table.row.start(a)
a<-table.element(a, 'p-value',1,TRUE)
a<-table.element(a, 1-pf(mysum$fstatistic[1],mysum$fstatistic[2],mysum$fstatistic[3]))
a<-table.row.end(a)
a<-table.row.start(a)
a<-table.element(a, 'Multiple Linear Regression - Residual Statistics', 2, TRUE)
a<-table.row.end(a)
a<-table.row.start(a)
a<-table.element(a, 'Residual Standard Deviation',1,TRUE)
a<-table.element(a, mysum$sigma)
a<-table.row.end(a)
a<-table.row.start(a)
a<-table.element(a, 'Sum Squared Residuals',1,TRUE)
a<-table.element(a, sum(myerror*myerror))
a<-table.row.end(a)
a<-table.end(a)
table.save(a,file='mytable3.tab')
a<-table.start()
a<-table.row.start(a)
a<-table.element(a, 'Multiple Linear Regression - Actuals, Interpolation, and Residuals', 4, TRUE)
a<-table.row.end(a)
a<-table.row.start(a)
a<-table.element(a, 'Time or Index', 1, TRUE)
a<-table.element(a, 'Actuals', 1, TRUE)
a<-table.element(a, 'Interpolation
Forecast', 1, TRUE)
a<-table.element(a, 'Residuals
Prediction Error', 1, TRUE)
a<-table.row.end(a)
for (i in 1:n) {
a<-table.row.start(a)
a<-table.element(a,i, 1, TRUE)
a<-table.element(a,x[i])
a<-table.element(a,x[i]-mysum$resid[i])
a<-table.element(a,mysum$resid[i])
a<-table.row.end(a)
}
a<-table.end(a)
table.save(a,file='mytable4.tab')
if (n > n25) {
a<-table.start()
a<-table.row.start(a)
a<-table.element(a,'Goldfeld-Quandt test for Heteroskedasticity',4,TRUE)
a<-table.row.end(a)
a<-table.row.start(a)
a<-table.element(a,'p-values',header=TRUE)
a<-table.element(a,'Alternative Hypothesis',3,header=TRUE)
a<-table.row.end(a)
a<-table.row.start(a)
a<-table.element(a,'breakpoint index',header=TRUE)
a<-table.element(a,'greater',header=TRUE)
a<-table.element(a,'2-sided',header=TRUE)
a<-table.element(a,'less',header=TRUE)
a<-table.row.end(a)
for (mypoint in kp3:nmkm3) {
a<-table.row.start(a)
a<-table.element(a,mypoint,header=TRUE)
a<-table.element(a,gqarr[mypoint-kp3+1,1])
a<-table.element(a,gqarr[mypoint-kp3+1,2])
a<-table.element(a,gqarr[mypoint-kp3+1,3])
a<-table.row.end(a)
}
a<-table.end(a)
table.save(a,file='mytable5.tab')
a<-table.start()
a<-table.row.start(a)
a<-table.element(a,'Meta Analysis of Goldfeld-Quandt test for Heteroskedasticity',4,TRUE)
a<-table.row.end(a)
a<-table.row.start(a)
a<-table.element(a,'Description',header=TRUE)
a<-table.element(a,'# significant tests',header=TRUE)
a<-table.element(a,'% significant tests',header=TRUE)
a<-table.element(a,'OK/NOK',header=TRUE)
a<-table.row.end(a)
a<-table.row.start(a)
a<-table.element(a,'1% type I error level',header=TRUE)
a<-table.element(a,numsignificant1)
a<-table.element(a,numsignificant1/numgqtests)
if (numsignificant1/numgqtests < 0.01) dum <- 'OK' else dum <- 'NOK'
a<-table.element(a,dum)
a<-table.row.end(a)
a<-table.row.start(a)
a<-table.element(a,'5% type I error level',header=TRUE)
a<-table.element(a,numsignificant5)
a<-table.element(a,numsignificant5/numgqtests)
if (numsignificant5/numgqtests < 0.05) dum <- 'OK' else dum <- 'NOK'
a<-table.element(a,dum)
a<-table.row.end(a)
a<-table.row.start(a)
a<-table.element(a,'10% type I error level',header=TRUE)
a<-table.element(a,numsignificant10)
a<-table.element(a,numsignificant10/numgqtests)
if (numsignificant10/numgqtests < 0.1) dum <- 'OK' else dum <- 'NOK'
a<-table.element(a,dum)
a<-table.row.end(a)
a<-table.end(a)
table.save(a,file='mytable6.tab')
}