Free Statistics
of Irreproducible Research!
Description of Statistical Computation | |||||||||||||||||||||||||||||||||||||||
|---|---|---|---|---|---|---|---|---|---|---|---|---|---|---|---|---|---|---|---|---|---|---|---|---|---|---|---|---|---|---|---|---|---|---|---|---|---|---|---|
| Author's title | |||||||||||||||||||||||||||||||||||||||
| Author | *The author of this computation has been verified* | ||||||||||||||||||||||||||||||||||||||
| R Software Module | rwasp_pairs.wasp | ||||||||||||||||||||||||||||||||||||||
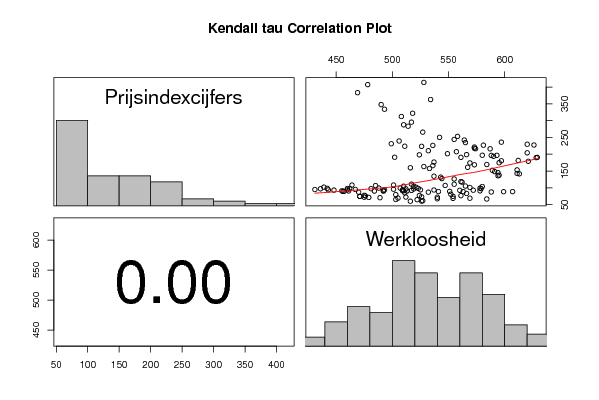
| Title produced by software | Kendall tau Correlation Matrix | ||||||||||||||||||||||||||||||||||||||
| Date of computation | Sat, 19 Dec 2009 05:47:04 -0700 | ||||||||||||||||||||||||||||||||||||||
| Cite this page as follows | Statistical Computations at FreeStatistics.org, Office for Research Development and Education, URL https://freestatistics.org/blog/index.php?v=date/2009/Dec/19/t12612271300d3ktz0mn7di899.htm/, Retrieved Fri, 03 May 2024 20:23:44 +0000 | ||||||||||||||||||||||||||||||||||||||
| Statistical Computations at FreeStatistics.org, Office for Research Development and Education, URL https://freestatistics.org/blog/index.php?pk=69557, Retrieved Fri, 03 May 2024 20:23:44 +0000 | |||||||||||||||||||||||||||||||||||||||
| QR Codes: | |||||||||||||||||||||||||||||||||||||||
|
| |||||||||||||||||||||||||||||||||||||||
| Original text written by user: | |||||||||||||||||||||||||||||||||||||||
| IsPrivate? | No (this computation is public) | ||||||||||||||||||||||||||||||||||||||
| User-defined keywords | |||||||||||||||||||||||||||||||||||||||
| Estimated Impact | 107 | ||||||||||||||||||||||||||||||||||||||
Tree of Dependent Computations | |||||||||||||||||||||||||||||||||||||||
| Family? (F = Feedback message, R = changed R code, M = changed R Module, P = changed Parameters, D = changed Data) | |||||||||||||||||||||||||||||||||||||||
| - [Kendall tau Correlation Matrix] [Kendall tau Corre...] [2008-12-21 14:29:04] [9d9b7f5939a0141f3b220bbc5743a411] - M D [Kendall tau Correlation Matrix] [Kendall Tau Corre...] [2009-12-19 12:47:04] [986e3c28a4248c495afaef9fd432264f] [Current] | |||||||||||||||||||||||||||||||||||||||
| Feedback Forum | |||||||||||||||||||||||||||||||||||||||
Post a new message | |||||||||||||||||||||||||||||||||||||||
Dataset | |||||||||||||||||||||||||||||||||||||||
| Dataseries X: | |||||||||||||||||||||||||||||||||||||||
97,8 579 93 572 92,5 560 89,4 551 93,6 537 89 541 87,7 588 88,8 607 88,5 599 91,1 578 88,8 563 83,3 566 76,8 561 74,5 554 72,1 540 73,2 526 72,6 512 69,4 505 68,7 554 66,9 584 69,1 569 67,5 540 64,8 522 60,6 526 61,7 527 60,2 516 65,3 503 70,7 489 71,5 479 72 475 77 524 81 552 87,1 532 85,6 511 90,2 492 92,4 492 93,9 493 97,5 481 98,1 462 89,6 457 98,4 442 102 439 99,2 488 101,8 521 108,3 501 106,7 485 108,2 464 94,2 460 95,1 467 98,1 460 93,2 448 94 443 97,2 436 95 431 90,5 484 91,6 510 90,5 513 79,9 503 74,9 471 74,3 471 75,9 476 77,7 475 86,9 470 90,7 461 91 455 89,5 456 92,5 517 94,1 525 98,5 523 96,8 519 91,2 509 97,1 512 104,9 519 110,9 517 104,8 510 94,1 509 95,8 501 99,3 507 101,1 569 104 580 99 578 105,4 565 107,1 547 110,7 555 117,1 562 118,7 561 126,5 555 127,5 544 134,6 537 131,8 543 135,9 594 142,7 611 141,7 613 153,4 611 145 594 137,7 595 148,3 591 152,2 589 169,4 584 168,6 573 161,1 567 174,1 569 179 621 190,6 629 190 628 181,6 612 174,8 595 180,5 597 196,8 593 193,8 590 197 580 216,3 574 221,4 573 217,9 573 229,7 620 227,4 626 204,2 620 196,6 588 198,8 566 207,5 557 190,7 561 201,6 549 210,5 532 223,5 526 223,8 511 231,2 499 244 555 234,7 565 250,2 542 265,7 527 287,6 510 283,3 514 295,4 517 312,3 508 333,8 493 347,7 490 383,2 469 407,1 478 413,6 528 362,7 534 321,9 518 239,4 506 191 502 159,7 516 163,4 528 157,6 533 166,2 536 176,7 537 198,3 524 226,2 536 216,2 587 235,9 597 226,9 581 242,3 564 253,1 558 | |||||||||||||||||||||||||||||||||||||||
Tables (Output of Computation) | |||||||||||||||||||||||||||||||||||||||
| |||||||||||||||||||||||||||||||||||||||
Figures (Output of Computation) | |||||||||||||||||||||||||||||||||||||||
Input Parameters & R Code | |||||||||||||||||||||||||||||||||||||||
| Parameters (Session): | |||||||||||||||||||||||||||||||||||||||
| Parameters (R input): | |||||||||||||||||||||||||||||||||||||||
| R code (references can be found in the software module): | |||||||||||||||||||||||||||||||||||||||
panel.tau <- function(x, y, digits=2, prefix='', cex.cor) | |||||||||||||||||||||||||||||||||||||||