Free Statistics
of Irreproducible Research!
Description of Statistical Computation | |||||||||||||||||||||||||||||||||||||||
|---|---|---|---|---|---|---|---|---|---|---|---|---|---|---|---|---|---|---|---|---|---|---|---|---|---|---|---|---|---|---|---|---|---|---|---|---|---|---|---|
| Author's title | |||||||||||||||||||||||||||||||||||||||
| Author | *The author of this computation has been verified* | ||||||||||||||||||||||||||||||||||||||
| R Software Module | rwasp_pairs.wasp | ||||||||||||||||||||||||||||||||||||||
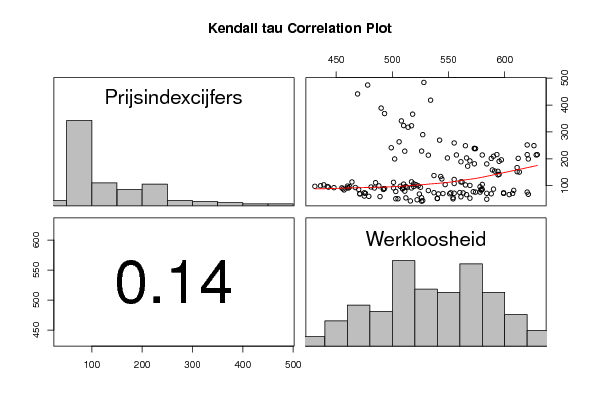
| Title produced by software | Kendall tau Correlation Matrix | ||||||||||||||||||||||||||||||||||||||
| Date of computation | Sat, 19 Dec 2009 06:56:33 -0700 | ||||||||||||||||||||||||||||||||||||||
| Cite this page as follows | Statistical Computations at FreeStatistics.org, Office for Research Development and Education, URL https://freestatistics.org/blog/index.php?v=date/2009/Dec/19/t12612311217m5hk1sead4uo2f.htm/, Retrieved Fri, 03 May 2024 17:19:44 +0000 | ||||||||||||||||||||||||||||||||||||||
| Statistical Computations at FreeStatistics.org, Office for Research Development and Education, URL https://freestatistics.org/blog/index.php?pk=69595, Retrieved Fri, 03 May 2024 17:19:44 +0000 | |||||||||||||||||||||||||||||||||||||||
| QR Codes: | |||||||||||||||||||||||||||||||||||||||
|
| |||||||||||||||||||||||||||||||||||||||
| Original text written by user: | |||||||||||||||||||||||||||||||||||||||
| IsPrivate? | No (this computation is public) | ||||||||||||||||||||||||||||||||||||||
| User-defined keywords | |||||||||||||||||||||||||||||||||||||||
| Estimated Impact | 115 | ||||||||||||||||||||||||||||||||||||||
Tree of Dependent Computations | |||||||||||||||||||||||||||||||||||||||
| Family? (F = Feedback message, R = changed R code, M = changed R Module, P = changed Parameters, D = changed Data) | |||||||||||||||||||||||||||||||||||||||
| - [Kendall tau Correlation Matrix] [Kendall tau Corre...] [2008-12-21 14:29:04] [9d9b7f5939a0141f3b220bbc5743a411] - M D [Kendall tau Correlation Matrix] [Kendall Tau Corre...] [2009-12-19 13:56:33] [986e3c28a4248c495afaef9fd432264f] [Current] | |||||||||||||||||||||||||||||||||||||||
| Feedback Forum | |||||||||||||||||||||||||||||||||||||||
Post a new message | |||||||||||||||||||||||||||||||||||||||
Dataset | |||||||||||||||||||||||||||||||||||||||
| Dataseries X: | |||||||||||||||||||||||||||||||||||||||
67.8 621 66.9 604 71.5 584 75.9 574 71.9 555 70.7 545 73.5 599 76.1 620 82.5 608 87.1 590 83.2 579 86.1 580 85.9 579 77.4 572 74.4 560 69.9 551 73.8 537 69.2 541 69.7 588 71 607 71.2 599 75.8 578 73 563 66.4 566 58.6 561 55.5 554 52.6 540 54.9 526 54.6 512 51.2 505 50.9 554 49.6 584 53.4 569 52 540 47.5 522 42.1 526 44.5 527 43.2 516 51.4 503 59.4 489 60.3 479 61.4 475 68.8 524 73.6 552 81.8 532 79.6 511 85.8 492 88.1 492 89.1 493 95 481 96.2 462 84.2 457 96.9 442 103.1 439 99.3 488 103.5 521 112.4 501 111.1 485 113.7 464 92 460 93 467 98.4 460 92.6 448 94.6 443 99.5 436 97.6 431 91.3 484 93.6 510 93.1 513 78.4 503 70.2 471 69.3 471 71.1 476 73.5 475 85.9 470 91.5 461 91.8 455 88.3 456 91.3 517 94 525 99.3 523 96.7 519 88 509 96.7 512 106.8 519 114.3 517 105.7 510 90.1 509 91.6 501 97.7 507 100.8 569 104.6 580 95.9 578 102.7 565 104 547 107.9 555 113.8 562 113.8 561 123.1 555 125.1 544 137.6 537 134 543 140.3 594 152.1 611 150.6 613 167.3 611 153.2 594 142 595 154.4 591 158.5 589 180.9 584 181.3 573 172.4 567 192 569 199.3 621 215.4 629 214.3 628 201.5 612 190.5 595 196 597 215.7 593 209.4 590 214.1 580 237.8 574 239 573 237.8 573 251.5 620 248.8 626 215.4 620 201.2 588 203.1 566 214.2 557 188.9 561 203 549 213.3 532 228.5 526 228.2 511 240.9 499 258.8 555 248.5 565 269.2 542 289.6 527 323.4 510 317.2 514 322.8 517 340.9 508 368.2 493 388.5 490 441.2 469 474.3 478 483.9 528 417.9 534 365.9 518 263 506 199.4 502 | |||||||||||||||||||||||||||||||||||||||
Tables (Output of Computation) | |||||||||||||||||||||||||||||||||||||||
| |||||||||||||||||||||||||||||||||||||||
Figures (Output of Computation) | |||||||||||||||||||||||||||||||||||||||
Input Parameters & R Code | |||||||||||||||||||||||||||||||||||||||
| Parameters (Session): | |||||||||||||||||||||||||||||||||||||||
| Parameters (R input): | |||||||||||||||||||||||||||||||||||||||
| R code (references can be found in the software module): | |||||||||||||||||||||||||||||||||||||||
panel.tau <- function(x, y, digits=2, prefix='', cex.cor) | |||||||||||||||||||||||||||||||||||||||