Free Statistics

of Irreproducible Research!

Author's title

Author*The author of this computation has been verified*
R Software Modulerwasp_smp.wasp
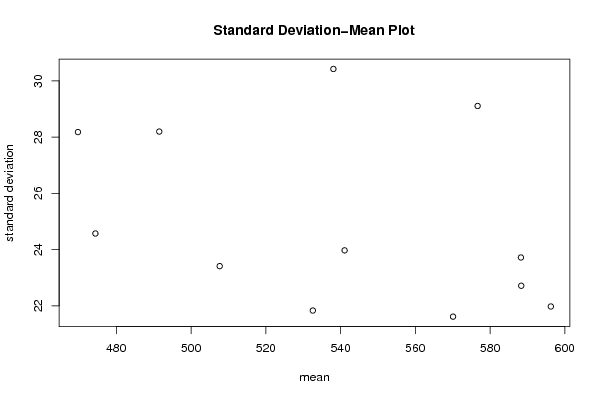
Title produced by softwareStandard Deviation-Mean Plot
Date of computationSat, 19 Dec 2009 09:56:08 -0700
Cite this page as followsStatistical Computations at FreeStatistics.org, Office for Research Development and Education, URL https://freestatistics.org/blog/index.php?v=date/2009/Dec/19/t1261241854vbk316w5emz93h7.htm/, Retrieved Sat, 04 May 2024 00:42:17 +0000
Statistical Computations at FreeStatistics.org, Office for Research Development and Education, URL https://freestatistics.org/blog/index.php?pk=69703, Retrieved Sat, 04 May 2024 00:42:17 +0000
QR Codes:

Original text written by user:
IsPrivate?No (this computation is public)
User-defined keywords
Estimated Impact108
Family? (F = Feedback message, R = changed R code, M = changed R Module, P = changed Parameters, D = changed Data)
-     [Standard Deviation-Mean Plot] [Standard Deviatio...] [2008-12-21 15:20:27] [005278dde49cfd8c32bf201feaeb19d6]
-    D  [Standard Deviation-Mean Plot] [Standard Deviatio...] [2008-12-23 16:19:40] [9d9b7f5939a0141f3b220bbc5743a411]
-  M D      [Standard Deviation-Mean Plot] [Standard Deviatio...] [2009-12-19 16:56:08] [986e3c28a4248c495afaef9fd432264f] [Current]
Feedback Forum

Post a new message
Dataseries X:
621.0
604.0
584.0
574.0
555.0
545.0
599.0
620.0
608.0
590.0
579.0
580.0
579.0
572.0
560.0
551.0
537.0
541.0
588.0
607.0
599.0
578.0
563.0
566.0
561.0
554.0
540.0
526.0
512.0
505.0
554.0
584.0
569.0
540.0
522.0
526.0
527.0
516.0
503.0
489.0
479.0
475.0
524.0
552.0
532.0
511.0
492.0
492.0
493.0
481.0
462.0
457.0
442.0
439.0
488.0
521.0
501.0
485.0
464.0
460.0
467.0
460.0
448.0
443.0
436.0
431.0
484.0
510.0
513.0
503.0
471.0
471.0
476.0
475.0
470.0
461.0
455.0
456.0
517.0
525.0
523.0
519.0
509.0
512.0
519.0
517.0
510.0
509.0
501.0
507.0
569.0
580.0
578.0
565.0
547.0
555.0
562.0
561.0
555.0
544.0
537.0
543.0
594.0
611.0
613.0
611.0
594.0
595.0
591.0
589.0
584.0
573.0
567.0
569.0
621.0
629.0
628.0
612.0
595.0
597.0
593.0
590.0
580.0
574.0
573.0
573.0
620.0
626.0
620.0
588.0
566.0
557.0
561.0
549.0
532.0
526.0
511.0
499.0
555.0
565.0
542.0
527.0
510.0
514.0
517.0
508.0
493.0
490.0
469.0
478.0
528.0
534.0
518.0
506.0
502.0


Summary of computational transaction
Raw Inputview raw input (R code)
Raw Outputview raw output of R engine
Computing time2 seconds
R Server'Gwilym Jenkins' @ 72.249.127.135

\begin{tabular}{lllllllll}
\hline
Summary of computational transaction \tabularnewline
Raw Input & view raw input (R code)  \tabularnewline
Raw Output & view raw output of R engine  \tabularnewline
Computing time & 2 seconds \tabularnewline
R Server & 'Gwilym Jenkins' @ 72.249.127.135 \tabularnewline
\hline
\end{tabular}
%Source: https://freestatistics.org/blog/index.php?pk=69703&T=0

[TABLE]
[ROW][C]Summary of computational transaction[/C][/ROW]
[ROW][C]Raw Input[/C][C]view raw input (R code) [/C][/ROW]
[ROW][C]Raw Output[/C][C]view raw output of R engine [/C][/ROW]
[ROW][C]Computing time[/C][C]2 seconds[/C][/ROW]
[ROW][C]R Server[/C][C]'Gwilym Jenkins' @ 72.249.127.135[/C][/ROW]
[/TABLE]
Source: https://freestatistics.org/blog/index.php?pk=69703&T=0

Globally Unique Identifier (entire table): ba.freestatistics.org/blog/index.php?pk=69703&T=0

As an alternative you can also use a QR Code:  

The GUIDs for individual cells are displayed in the table below:

Summary of computational transaction
Raw Inputview raw input (R code)
Raw Outputview raw output of R engine
Computing time2 seconds
R Server'Gwilym Jenkins' @ 72.249.127.135


Standard Deviation-Mean Plot
SectionMeanStandard DeviationRange
1588.2523.718519806644476
2570.08333333333321.614213897901670
3541.08333333333323.971416059106579
4507.66666666666723.4106942669577
5474.41666666666724.570708108837682
6469.7528.178408884689182
7491.528.195744359743470
8538.08333333333330.42265403918479
9576.66666666666729.10586736641876
10596.2521.975709731014862
11588.33333333333322.712965193448269
12532.58333333333321.831829696083466

\begin{tabular}{lllllllll}
\hline
Standard Deviation-Mean Plot \tabularnewline
Section & Mean & Standard Deviation & Range \tabularnewline
1 & 588.25 & 23.7185198066444 & 76 \tabularnewline
2 & 570.083333333333 & 21.6142138979016 & 70 \tabularnewline
3 & 541.083333333333 & 23.9714160591065 & 79 \tabularnewline
4 & 507.666666666667 & 23.41069426695 & 77 \tabularnewline
5 & 474.416666666667 & 24.5707081088376 & 82 \tabularnewline
6 & 469.75 & 28.1784088846891 & 82 \tabularnewline
7 & 491.5 & 28.1957443597434 & 70 \tabularnewline
8 & 538.083333333333 & 30.422654039184 & 79 \tabularnewline
9 & 576.666666666667 & 29.105867366418 & 76 \tabularnewline
10 & 596.25 & 21.9757097310148 & 62 \tabularnewline
11 & 588.333333333333 & 22.7129651934482 & 69 \tabularnewline
12 & 532.583333333333 & 21.8318296960834 & 66 \tabularnewline
\hline
\end{tabular}
%Source: https://freestatistics.org/blog/index.php?pk=69703&T=1

[TABLE]
[ROW][C]Standard Deviation-Mean Plot[/C][/ROW]
[ROW][C]Section[/C][C]Mean[/C][C]Standard Deviation[/C][C]Range[/C][/ROW]
[ROW][C]1[/C][C]588.25[/C][C]23.7185198066444[/C][C]76[/C][/ROW]
[ROW][C]2[/C][C]570.083333333333[/C][C]21.6142138979016[/C][C]70[/C][/ROW]
[ROW][C]3[/C][C]541.083333333333[/C][C]23.9714160591065[/C][C]79[/C][/ROW]
[ROW][C]4[/C][C]507.666666666667[/C][C]23.41069426695[/C][C]77[/C][/ROW]
[ROW][C]5[/C][C]474.416666666667[/C][C]24.5707081088376[/C][C]82[/C][/ROW]
[ROW][C]6[/C][C]469.75[/C][C]28.1784088846891[/C][C]82[/C][/ROW]
[ROW][C]7[/C][C]491.5[/C][C]28.1957443597434[/C][C]70[/C][/ROW]
[ROW][C]8[/C][C]538.083333333333[/C][C]30.422654039184[/C][C]79[/C][/ROW]
[ROW][C]9[/C][C]576.666666666667[/C][C]29.105867366418[/C][C]76[/C][/ROW]
[ROW][C]10[/C][C]596.25[/C][C]21.9757097310148[/C][C]62[/C][/ROW]
[ROW][C]11[/C][C]588.333333333333[/C][C]22.7129651934482[/C][C]69[/C][/ROW]
[ROW][C]12[/C][C]532.583333333333[/C][C]21.8318296960834[/C][C]66[/C][/ROW]
[/TABLE]
Source: https://freestatistics.org/blog/index.php?pk=69703&T=1

Globally Unique Identifier (entire table): ba.freestatistics.org/blog/index.php?pk=69703&T=1

As an alternative you can also use a QR Code:  

The GUIDs for individual cells are displayed in the table below:

Standard Deviation-Mean Plot
SectionMeanStandard DeviationRange
1588.2523.718519806644476
2570.08333333333321.614213897901670
3541.08333333333323.971416059106579
4507.66666666666723.4106942669577
5474.41666666666724.570708108837682
6469.7528.178408884689182
7491.528.195744359743470
8538.08333333333330.42265403918479
9576.66666666666729.10586736641876
10596.2521.975709731014862
11588.33333333333322.712965193448269
12532.58333333333321.831829696083466


Regression: S.E.(k) = alpha + beta * Mean(k)
alpha38.7357619867392
beta-0.0255025348688504
S.D.0.020215625988774
T-STAT-1.2615258554453
p-value0.235751854466778

\begin{tabular}{lllllllll}
\hline
Regression: S.E.(k) = alpha + beta * Mean(k) \tabularnewline
alpha & 38.7357619867392 \tabularnewline
beta & -0.0255025348688504 \tabularnewline
S.D. & 0.020215625988774 \tabularnewline
T-STAT & -1.2615258554453 \tabularnewline
p-value & 0.235751854466778 \tabularnewline
\hline
\end{tabular}
%Source: https://freestatistics.org/blog/index.php?pk=69703&T=2

[TABLE]
[ROW][C]Regression: S.E.(k) = alpha + beta * Mean(k)[/C][/ROW]
[ROW][C]alpha[/C][C]38.7357619867392[/C][/ROW]
[ROW][C]beta[/C][C]-0.0255025348688504[/C][/ROW]
[ROW][C]S.D.[/C][C]0.020215625988774[/C][/ROW]
[ROW][C]T-STAT[/C][C]-1.2615258554453[/C][/ROW]
[ROW][C]p-value[/C][C]0.235751854466778[/C][/ROW]
[/TABLE]
Source: https://freestatistics.org/blog/index.php?pk=69703&T=2

Globally Unique Identifier (entire table): ba.freestatistics.org/blog/index.php?pk=69703&T=2

As an alternative you can also use a QR Code:  

The GUIDs for individual cells are displayed in the table below:

Regression: S.E.(k) = alpha + beta * Mean(k)
alpha38.7357619867392
beta-0.0255025348688504
S.D.0.020215625988774
T-STAT-1.2615258554453
p-value0.235751854466778


Regression: ln S.E.(k) = alpha + beta * ln Mean(k)
alpha6.67490323906841
beta-0.55093500961385
S.D.0.416383460686854
T-STAT-1.32314335613870
p-value0.215242862851659
Lambda1.55093500961385

\begin{tabular}{lllllllll}
\hline
Regression: ln S.E.(k) = alpha + beta * ln Mean(k) \tabularnewline
alpha & 6.67490323906841 \tabularnewline
beta & -0.55093500961385 \tabularnewline
S.D. & 0.416383460686854 \tabularnewline
T-STAT & -1.32314335613870 \tabularnewline
p-value & 0.215242862851659 \tabularnewline
Lambda & 1.55093500961385 \tabularnewline
\hline
\end{tabular}
%Source: https://freestatistics.org/blog/index.php?pk=69703&T=3

[TABLE]
[ROW][C]Regression: ln S.E.(k) = alpha + beta * ln Mean(k)[/C][/ROW]
[ROW][C]alpha[/C][C]6.67490323906841[/C][/ROW]
[ROW][C]beta[/C][C]-0.55093500961385[/C][/ROW]
[ROW][C]S.D.[/C][C]0.416383460686854[/C][/ROW]
[ROW][C]T-STAT[/C][C]-1.32314335613870[/C][/ROW]
[ROW][C]p-value[/C][C]0.215242862851659[/C][/ROW]
[ROW][C]Lambda[/C][C]1.55093500961385[/C][/ROW]
[/TABLE]
Source: https://freestatistics.org/blog/index.php?pk=69703&T=3

Globally Unique Identifier (entire table): ba.freestatistics.org/blog/index.php?pk=69703&T=3

As an alternative you can also use a QR Code:  

The GUIDs for individual cells are displayed in the table below:

Regression: ln S.E.(k) = alpha + beta * ln Mean(k)
alpha6.67490323906841
beta-0.55093500961385
S.D.0.416383460686854
T-STAT-1.32314335613870
p-value0.215242862851659
Lambda1.55093500961385


Parameters (Session):
par1 = 12 ;
Parameters (R input):
par1 = 12 ;
R code (references can be found in the software module):
par1 <- as.numeric(par1)
(n <- length(x))
(np <- floor(n / par1))
arr <- array(NA,dim=c(par1,np))
j <- 0
k <- 1
for (i in 1:(np*par1))
{
j = j + 1
arr[j,k] <- x[i]
if (j == par1) {
j = 0
k=k+1
}
}
arr
arr.mean <- array(NA,dim=np)
arr.sd <- array(NA,dim=np)
arr.range <- array(NA,dim=np)
for (j in 1:np)
{
arr.mean[j] <- mean(arr[,j],na.rm=TRUE)
arr.sd[j] <- sd(arr[,j],na.rm=TRUE)
arr.range[j] <- max(arr[,j],na.rm=TRUE) - min(arr[,j],na.rm=TRUE)
}
arr.mean
arr.sd
arr.range
(lm1 <- lm(arr.sd~arr.mean))
(lnlm1 <- lm(log(arr.sd)~log(arr.mean)))
(lm2 <- lm(arr.range~arr.mean))
bitmap(file='test1.png')
plot(arr.mean,arr.sd,main='Standard Deviation-Mean Plot',xlab='mean',ylab='standard deviation')
dev.off()
bitmap(file='test2.png')
plot(arr.mean,arr.range,main='Range-Mean Plot',xlab='mean',ylab='range')
dev.off()
load(file='createtable')
a<-table.start()
a<-table.row.start(a)
a<-table.element(a,'Standard Deviation-Mean Plot',4,TRUE)
a<-table.row.end(a)
a<-table.row.start(a)
a<-table.element(a,'Section',header=TRUE)
a<-table.element(a,'Mean',header=TRUE)
a<-table.element(a,'Standard Deviation',header=TRUE)
a<-table.element(a,'Range',header=TRUE)
a<-table.row.end(a)
for (j in 1:np) {
a<-table.row.start(a)
a<-table.element(a,j,header=TRUE)
a<-table.element(a,arr.mean[j])
a<-table.element(a,arr.sd[j] )
a<-table.element(a,arr.range[j] )
a<-table.row.end(a)
}
a<-table.end(a)
table.save(a,file='mytable.tab')
a<-table.start()
a<-table.row.start(a)
a<-table.element(a,'Regression: S.E.(k) = alpha + beta * Mean(k)',2,TRUE)
a<-table.row.end(a)
a<-table.row.start(a)
a<-table.element(a,'alpha',header=TRUE)
a<-table.element(a,lm1$coefficients[[1]])
a<-table.row.end(a)
a<-table.row.start(a)
a<-table.element(a,'beta',header=TRUE)
a<-table.element(a,lm1$coefficients[[2]])
a<-table.row.end(a)
a<-table.row.start(a)
a<-table.element(a,'S.D.',header=TRUE)
a<-table.element(a,summary(lm1)$coefficients[2,2])
a<-table.row.end(a)
a<-table.row.start(a)
a<-table.element(a,'T-STAT',header=TRUE)
a<-table.element(a,summary(lm1)$coefficients[2,3])
a<-table.row.end(a)
a<-table.row.start(a)
a<-table.element(a,'p-value',header=TRUE)
a<-table.element(a,summary(lm1)$coefficients[2,4])
a<-table.row.end(a)
a<-table.end(a)
table.save(a,file='mytable1.tab')
a<-table.start()
a<-table.row.start(a)
a<-table.element(a,'Regression: ln S.E.(k) = alpha + beta * ln Mean(k)',2,TRUE)
a<-table.row.end(a)
a<-table.row.start(a)
a<-table.element(a,'alpha',header=TRUE)
a<-table.element(a,lnlm1$coefficients[[1]])
a<-table.row.end(a)
a<-table.row.start(a)
a<-table.element(a,'beta',header=TRUE)
a<-table.element(a,lnlm1$coefficients[[2]])
a<-table.row.end(a)
a<-table.row.start(a)
a<-table.element(a,'S.D.',header=TRUE)
a<-table.element(a,summary(lnlm1)$coefficients[2,2])
a<-table.row.end(a)
a<-table.row.start(a)
a<-table.element(a,'T-STAT',header=TRUE)
a<-table.element(a,summary(lnlm1)$coefficients[2,3])
a<-table.row.end(a)
a<-table.row.start(a)
a<-table.element(a,'p-value',header=TRUE)
a<-table.element(a,summary(lnlm1)$coefficients[2,4])
a<-table.row.end(a)
a<-table.row.start(a)
a<-table.element(a,'Lambda',header=TRUE)
a<-table.element(a,1-lnlm1$coefficients[[2]])
a<-table.row.end(a)
a<-table.end(a)
table.save(a,file='mytable2.tab')