Free Statistics

of Irreproducible Research!

Author's title

Author*The author of this computation has been verified*
R Software Modulerwasp_multipleregression.wasp
Title produced by softwareMultiple Regression
Date of computationSat, 19 Dec 2009 15:03:45 -0700
Cite this page as followsStatistical Computations at FreeStatistics.org, Office for Research Development and Education, URL https://freestatistics.org/blog/index.php?v=date/2009/Dec/19/t1261261657bvbxzhrttk5snrv.htm/, Retrieved Sat, 04 May 2024 05:28:50 +0000
Statistical Computations at FreeStatistics.org, Office for Research Development and Education, URL https://freestatistics.org/blog/index.php?pk=69761, Retrieved Sat, 04 May 2024 05:28:50 +0000
QR Codes:

Original text written by user:
IsPrivate?No (this computation is public)
User-defined keywords
Estimated Impact113
Family? (F = Feedback message, R = changed R code, M = changed R Module, P = changed Parameters, D = changed Data)
-     [Multiple Regression] [Q1 The Seatbeltlaw] [2007-11-14 19:27:43] [8cd6641b921d30ebe00b648d1481bba0]
- RMPD  [Multiple Regression] [Seatbelt] [2009-11-12 13:54:52] [b98453cac15ba1066b407e146608df68]
-    D      [Multiple Regression] [] [2009-12-19 22:03:45] [aa8eb70c35ea8a87edcd21d6427e653e] [Current]
Feedback Forum

Post a new message
Dataseries X:
2849.27	10872
2921.44	10625
2981.85	10407
3080.58	10463
3106.22	10556
3119.31	10646
3061.26	10702
3097.31	11353
3161.69	11346
3257.16	11451
3277.01	11964
3295.32	12574
3363.99	13031
3494.17	13812
3667.03	14544
3813.06	14931
3917.96	14886
3895.51	16005
3801.06	17064
3570.12	15168
3701.61	16050
3862.27	15839
3970.1	15137
4138.52	14954
4199.75	15648
4290.89	15305
4443.91	15579
4502.64	16348
4356.98	15928
4591.27	16171
4696.96	15937
4621.4	15713
4562.84	15594
4202.52	15683
4296.49	16438
4435.23	17032
4105.18	17696
4116.68	17745
3844.49	19394
3720.98	20148
3674.4	20108
3857.62	18584
3801.06	18441
3504.37	18391
3032.6	19178
3047.03	18079
2962.34	18483
2197.82	19644
2014.45	19195
1862.83	19650
1905.41	20830
1810.99	23595
1670.07	22937
1864.44	21814
2052.02	21928
2029.6	21777
2070.83	21383
2293.41	21467
2443.27	22052
2513.17	22680


Summary of computational transaction
Raw Inputview raw input (R code)
Raw Outputview raw output of R engine
Computing time6 seconds
R Server'Gwilym Jenkins' @ 72.249.127.135

\begin{tabular}{lllllllll}
\hline
Summary of computational transaction \tabularnewline
Raw Input & view raw input (R code)  \tabularnewline
Raw Output & view raw output of R engine  \tabularnewline
Computing time & 6 seconds \tabularnewline
R Server & 'Gwilym Jenkins' @ 72.249.127.135 \tabularnewline
\hline
\end{tabular}
%Source: https://freestatistics.org/blog/index.php?pk=69761&T=0

[TABLE]
[ROW][C]Summary of computational transaction[/C][/ROW]
[ROW][C]Raw Input[/C][C]view raw input (R code) [/C][/ROW]
[ROW][C]Raw Output[/C][C]view raw output of R engine [/C][/ROW]
[ROW][C]Computing time[/C][C]6 seconds[/C][/ROW]
[ROW][C]R Server[/C][C]'Gwilym Jenkins' @ 72.249.127.135[/C][/ROW]
[/TABLE]
Source: https://freestatistics.org/blog/index.php?pk=69761&T=0

Globally Unique Identifier (entire table): ba.freestatistics.org/blog/index.php?pk=69761&T=0

As an alternative you can also use a QR Code:  

The GUIDs for individual cells are displayed in the table below:

Summary of computational transaction
Raw Inputview raw input (R code)
Raw Outputview raw output of R engine
Computing time6 seconds
R Server'Gwilym Jenkins' @ 72.249.127.135


Multiple Linear Regression - Estimated Regression Equation
Y[t] = + 4873.48426583216 -0.0912345121119826X[t] + e[t]

\begin{tabular}{lllllllll}
\hline
Multiple Linear Regression - Estimated Regression Equation \tabularnewline
Y[t] =  +  4873.48426583216 -0.0912345121119826X[t]  + e[t] \tabularnewline
\hline
\end{tabular}
%Source: https://freestatistics.org/blog/index.php?pk=69761&T=1

[TABLE]
[ROW][C]Multiple Linear Regression - Estimated Regression Equation[/C][/ROW]
[ROW][C]Y[t] =  +  4873.48426583216 -0.0912345121119826X[t]  + e[t][/C][/ROW]
[/TABLE]
Source: https://freestatistics.org/blog/index.php?pk=69761&T=1

Globally Unique Identifier (entire table): ba.freestatistics.org/blog/index.php?pk=69761&T=1

As an alternative you can also use a QR Code:  

The GUIDs for individual cells are displayed in the table below:

Multiple Linear Regression - Estimated Regression Equation
Y[t] = + 4873.48426583216 -0.0912345121119826X[t] + e[t]


Multiple Linear Regression - Ordinary Least Squares
VariableParameterS.D.T-STATH0: parameter = 02-tail p-value1-tail p-value
(Intercept)4873.48426583216471.89945810.327400
X-0.09123451211198260.027897-3.27050.001810.000905

\begin{tabular}{lllllllll}
\hline
Multiple Linear Regression - Ordinary Least Squares \tabularnewline
Variable & Parameter & S.D. & T-STATH0: parameter = 0 & 2-tail p-value & 1-tail p-value \tabularnewline
(Intercept) & 4873.48426583216 & 471.899458 & 10.3274 & 0 & 0 \tabularnewline
X & -0.0912345121119826 & 0.027897 & -3.2705 & 0.00181 & 0.000905 \tabularnewline
\hline
\end{tabular}
%Source: https://freestatistics.org/blog/index.php?pk=69761&T=2

[TABLE]
[ROW][C]Multiple Linear Regression - Ordinary Least Squares[/C][/ROW]
[ROW][C]Variable[/C][C]Parameter[/C][C]S.D.[/C][C]T-STATH0: parameter = 0[/C][C]2-tail p-value[/C][C]1-tail p-value[/C][/ROW]
[ROW][C](Intercept)[/C][C]4873.48426583216[/C][C]471.899458[/C][C]10.3274[/C][C]0[/C][C]0[/C][/ROW]
[ROW][C]X[/C][C]-0.0912345121119826[/C][C]0.027897[/C][C]-3.2705[/C][C]0.00181[/C][C]0.000905[/C][/ROW]
[/TABLE]
Source: https://freestatistics.org/blog/index.php?pk=69761&T=2

Globally Unique Identifier (entire table): ba.freestatistics.org/blog/index.php?pk=69761&T=2

As an alternative you can also use a QR Code:  

The GUIDs for individual cells are displayed in the table below:

Multiple Linear Regression - Ordinary Least Squares
VariableParameterS.D.T-STATH0: parameter = 02-tail p-value1-tail p-value
(Intercept)4873.48426583216471.89945810.327400
X-0.09123451211198260.027897-3.27050.001810.000905


Multiple Linear Regression - Regression Statistics
Multiple R0.394587913596563
R-squared0.155699621556489
Adjusted R-squared0.141142718479877
F-TEST (value)10.6959303594349
F-TEST (DF numerator)1
F-TEST (DF denominator)58
p-value0.00180963210723251
Multiple Linear Regression - Residual Statistics
Residual Standard Deviation790.355869791833
Sum Squared Residuals36230419.2530355

\begin{tabular}{lllllllll}
\hline
Multiple Linear Regression - Regression Statistics \tabularnewline
Multiple R & 0.394587913596563 \tabularnewline
R-squared & 0.155699621556489 \tabularnewline
Adjusted R-squared & 0.141142718479877 \tabularnewline
F-TEST (value) & 10.6959303594349 \tabularnewline
F-TEST (DF numerator) & 1 \tabularnewline
F-TEST (DF denominator) & 58 \tabularnewline
p-value & 0.00180963210723251 \tabularnewline
Multiple Linear Regression - Residual Statistics \tabularnewline
Residual Standard Deviation & 790.355869791833 \tabularnewline
Sum Squared Residuals & 36230419.2530355 \tabularnewline
\hline
\end{tabular}
%Source: https://freestatistics.org/blog/index.php?pk=69761&T=3

[TABLE]
[ROW][C]Multiple Linear Regression - Regression Statistics[/C][/ROW]
[ROW][C]Multiple R[/C][C]0.394587913596563[/C][/ROW]
[ROW][C]R-squared[/C][C]0.155699621556489[/C][/ROW]
[ROW][C]Adjusted R-squared[/C][C]0.141142718479877[/C][/ROW]
[ROW][C]F-TEST (value)[/C][C]10.6959303594349[/C][/ROW]
[ROW][C]F-TEST (DF numerator)[/C][C]1[/C][/ROW]
[ROW][C]F-TEST (DF denominator)[/C][C]58[/C][/ROW]
[ROW][C]p-value[/C][C]0.00180963210723251[/C][/ROW]
[ROW][C]Multiple Linear Regression - Residual Statistics[/C][/ROW]
[ROW][C]Residual Standard Deviation[/C][C]790.355869791833[/C][/ROW]
[ROW][C]Sum Squared Residuals[/C][C]36230419.2530355[/C][/ROW]
[/TABLE]
Source: https://freestatistics.org/blog/index.php?pk=69761&T=3

Globally Unique Identifier (entire table): ba.freestatistics.org/blog/index.php?pk=69761&T=3

As an alternative you can also use a QR Code:  

The GUIDs for individual cells are displayed in the table below:

Multiple Linear Regression - Regression Statistics
Multiple R0.394587913596563
R-squared0.155699621556489
Adjusted R-squared0.141142718479877
F-TEST (value)10.6959303594349
F-TEST (DF numerator)1
F-TEST (DF denominator)58
p-value0.00180963210723251
Multiple Linear Regression - Residual Statistics
Residual Standard Deviation790.355869791833
Sum Squared Residuals36230419.2530355


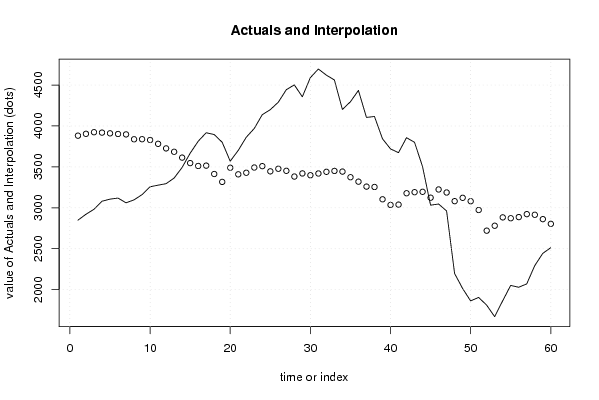
Multiple Linear Regression - Actuals, Interpolation, and Residuals
Time or IndexActualsInterpolationForecastResidualsPrediction Error
12849.273881.5826501507-1032.31265015070
22921.443904.11757464235-982.677574642347
32981.853924.00669828276-942.15669828276
43080.583918.89756560449-838.317565604488
53106.223910.41275597807-804.192755978074
63119.313902.20164988800-782.891649887995
73061.263897.09251720972-835.832517209724
83097.313837.69884982482-740.388849824824
93161.693838.33749140961-676.647491409607
103257.163828.75786763785-571.59786763785
113277.013781.9545629244-504.944562924402
123295.323726.30151053609-430.981510536093
133363.993684.60733850092-320.617338500917
143494.173613.35318454146-119.183184541458
153667.033546.56952167549120.460478324513
163813.063511.26176548815301.798234511850
173917.963515.36731853319402.592681466811
183895.513413.27589947988482.23410052012
193801.063316.65855115329484.401448846709
203570.123489.6391861176180.48081388239
213701.613409.17034643484292.439653565159
223862.273428.42082849047433.849171509530
233970.13492.46745599308477.632544006919
244138.523509.16337170957629.356628290426
254199.753445.84662030386753.903379696142
264290.893477.14005795827813.749942041732
274443.913452.14180163958991.768198360415
284502.643381.982461825471120.65753817453
294356.983420.3009569125936.679043087497
304591.273398.130970469291193.13902953071
314696.963419.479846303491277.48015369650
324621.43439.916377016581181.48362298342
334562.843450.773283957911112.06671604209
344202.523442.65341237994759.866587620062
354296.493373.77135573539922.718644264608
364435.233319.578055540871115.65194445913
374105.183258.99833949852846.181660501483
384116.683254.52784840503862.15215159497
393844.493104.08213793237740.407862067629
403720.983035.29131579994685.688684200064
413674.43038.94069628442635.459303715585
423857.623177.98209274308679.637907256923
433801.063191.02862797509610.03137202491
443504.373195.59035358069308.77964641931
453032.63123.78879254856-91.1887925485595
463047.033224.05552135963-177.025521359628
472962.343187.19677846639-224.856778466387
482197.823081.27350990438-883.453509904375
492014.453122.23780584266-1107.78780584266
501862.833080.72610283170-1217.89610283170
511905.412973.06937853956-1067.65937853956
521810.992720.80595254993-909.815952549932
531670.072780.83826151962-1110.76826151962
541864.442883.29461862137-1018.85461862137
552052.022872.89388424061-820.873884240607
562029.62886.67029556952-857.070295569517
572070.832922.61669334164-851.786693341638
582293.412914.95299432423-621.542994324231
592443.272861.58080473872-418.310804738721
602513.172804.28553113240-291.115531132396

\begin{tabular}{lllllllll}
\hline
Multiple Linear Regression - Actuals, Interpolation, and Residuals \tabularnewline
Time or Index & Actuals & InterpolationForecast & ResidualsPrediction Error \tabularnewline
1 & 2849.27 & 3881.5826501507 & -1032.31265015070 \tabularnewline
2 & 2921.44 & 3904.11757464235 & -982.677574642347 \tabularnewline
3 & 2981.85 & 3924.00669828276 & -942.15669828276 \tabularnewline
4 & 3080.58 & 3918.89756560449 & -838.317565604488 \tabularnewline
5 & 3106.22 & 3910.41275597807 & -804.192755978074 \tabularnewline
6 & 3119.31 & 3902.20164988800 & -782.891649887995 \tabularnewline
7 & 3061.26 & 3897.09251720972 & -835.832517209724 \tabularnewline
8 & 3097.31 & 3837.69884982482 & -740.388849824824 \tabularnewline
9 & 3161.69 & 3838.33749140961 & -676.647491409607 \tabularnewline
10 & 3257.16 & 3828.75786763785 & -571.59786763785 \tabularnewline
11 & 3277.01 & 3781.9545629244 & -504.944562924402 \tabularnewline
12 & 3295.32 & 3726.30151053609 & -430.981510536093 \tabularnewline
13 & 3363.99 & 3684.60733850092 & -320.617338500917 \tabularnewline
14 & 3494.17 & 3613.35318454146 & -119.183184541458 \tabularnewline
15 & 3667.03 & 3546.56952167549 & 120.460478324513 \tabularnewline
16 & 3813.06 & 3511.26176548815 & 301.798234511850 \tabularnewline
17 & 3917.96 & 3515.36731853319 & 402.592681466811 \tabularnewline
18 & 3895.51 & 3413.27589947988 & 482.23410052012 \tabularnewline
19 & 3801.06 & 3316.65855115329 & 484.401448846709 \tabularnewline
20 & 3570.12 & 3489.63918611761 & 80.48081388239 \tabularnewline
21 & 3701.61 & 3409.17034643484 & 292.439653565159 \tabularnewline
22 & 3862.27 & 3428.42082849047 & 433.849171509530 \tabularnewline
23 & 3970.1 & 3492.46745599308 & 477.632544006919 \tabularnewline
24 & 4138.52 & 3509.16337170957 & 629.356628290426 \tabularnewline
25 & 4199.75 & 3445.84662030386 & 753.903379696142 \tabularnewline
26 & 4290.89 & 3477.14005795827 & 813.749942041732 \tabularnewline
27 & 4443.91 & 3452.14180163958 & 991.768198360415 \tabularnewline
28 & 4502.64 & 3381.98246182547 & 1120.65753817453 \tabularnewline
29 & 4356.98 & 3420.3009569125 & 936.679043087497 \tabularnewline
30 & 4591.27 & 3398.13097046929 & 1193.13902953071 \tabularnewline
31 & 4696.96 & 3419.47984630349 & 1277.48015369650 \tabularnewline
32 & 4621.4 & 3439.91637701658 & 1181.48362298342 \tabularnewline
33 & 4562.84 & 3450.77328395791 & 1112.06671604209 \tabularnewline
34 & 4202.52 & 3442.65341237994 & 759.866587620062 \tabularnewline
35 & 4296.49 & 3373.77135573539 & 922.718644264608 \tabularnewline
36 & 4435.23 & 3319.57805554087 & 1115.65194445913 \tabularnewline
37 & 4105.18 & 3258.99833949852 & 846.181660501483 \tabularnewline
38 & 4116.68 & 3254.52784840503 & 862.15215159497 \tabularnewline
39 & 3844.49 & 3104.08213793237 & 740.407862067629 \tabularnewline
40 & 3720.98 & 3035.29131579994 & 685.688684200064 \tabularnewline
41 & 3674.4 & 3038.94069628442 & 635.459303715585 \tabularnewline
42 & 3857.62 & 3177.98209274308 & 679.637907256923 \tabularnewline
43 & 3801.06 & 3191.02862797509 & 610.03137202491 \tabularnewline
44 & 3504.37 & 3195.59035358069 & 308.77964641931 \tabularnewline
45 & 3032.6 & 3123.78879254856 & -91.1887925485595 \tabularnewline
46 & 3047.03 & 3224.05552135963 & -177.025521359628 \tabularnewline
47 & 2962.34 & 3187.19677846639 & -224.856778466387 \tabularnewline
48 & 2197.82 & 3081.27350990438 & -883.453509904375 \tabularnewline
49 & 2014.45 & 3122.23780584266 & -1107.78780584266 \tabularnewline
50 & 1862.83 & 3080.72610283170 & -1217.89610283170 \tabularnewline
51 & 1905.41 & 2973.06937853956 & -1067.65937853956 \tabularnewline
52 & 1810.99 & 2720.80595254993 & -909.815952549932 \tabularnewline
53 & 1670.07 & 2780.83826151962 & -1110.76826151962 \tabularnewline
54 & 1864.44 & 2883.29461862137 & -1018.85461862137 \tabularnewline
55 & 2052.02 & 2872.89388424061 & -820.873884240607 \tabularnewline
56 & 2029.6 & 2886.67029556952 & -857.070295569517 \tabularnewline
57 & 2070.83 & 2922.61669334164 & -851.786693341638 \tabularnewline
58 & 2293.41 & 2914.95299432423 & -621.542994324231 \tabularnewline
59 & 2443.27 & 2861.58080473872 & -418.310804738721 \tabularnewline
60 & 2513.17 & 2804.28553113240 & -291.115531132396 \tabularnewline
\hline
\end{tabular}
%Source: https://freestatistics.org/blog/index.php?pk=69761&T=4

[TABLE]
[ROW][C]Multiple Linear Regression - Actuals, Interpolation, and Residuals[/C][/ROW]
[ROW][C]Time or Index[/C][C]Actuals[/C][C]InterpolationForecast[/C][C]ResidualsPrediction Error[/C][/ROW]
[ROW][C]1[/C][C]2849.27[/C][C]3881.5826501507[/C][C]-1032.31265015070[/C][/ROW]
[ROW][C]2[/C][C]2921.44[/C][C]3904.11757464235[/C][C]-982.677574642347[/C][/ROW]
[ROW][C]3[/C][C]2981.85[/C][C]3924.00669828276[/C][C]-942.15669828276[/C][/ROW]
[ROW][C]4[/C][C]3080.58[/C][C]3918.89756560449[/C][C]-838.317565604488[/C][/ROW]
[ROW][C]5[/C][C]3106.22[/C][C]3910.41275597807[/C][C]-804.192755978074[/C][/ROW]
[ROW][C]6[/C][C]3119.31[/C][C]3902.20164988800[/C][C]-782.891649887995[/C][/ROW]
[ROW][C]7[/C][C]3061.26[/C][C]3897.09251720972[/C][C]-835.832517209724[/C][/ROW]
[ROW][C]8[/C][C]3097.31[/C][C]3837.69884982482[/C][C]-740.388849824824[/C][/ROW]
[ROW][C]9[/C][C]3161.69[/C][C]3838.33749140961[/C][C]-676.647491409607[/C][/ROW]
[ROW][C]10[/C][C]3257.16[/C][C]3828.75786763785[/C][C]-571.59786763785[/C][/ROW]
[ROW][C]11[/C][C]3277.01[/C][C]3781.9545629244[/C][C]-504.944562924402[/C][/ROW]
[ROW][C]12[/C][C]3295.32[/C][C]3726.30151053609[/C][C]-430.981510536093[/C][/ROW]
[ROW][C]13[/C][C]3363.99[/C][C]3684.60733850092[/C][C]-320.617338500917[/C][/ROW]
[ROW][C]14[/C][C]3494.17[/C][C]3613.35318454146[/C][C]-119.183184541458[/C][/ROW]
[ROW][C]15[/C][C]3667.03[/C][C]3546.56952167549[/C][C]120.460478324513[/C][/ROW]
[ROW][C]16[/C][C]3813.06[/C][C]3511.26176548815[/C][C]301.798234511850[/C][/ROW]
[ROW][C]17[/C][C]3917.96[/C][C]3515.36731853319[/C][C]402.592681466811[/C][/ROW]
[ROW][C]18[/C][C]3895.51[/C][C]3413.27589947988[/C][C]482.23410052012[/C][/ROW]
[ROW][C]19[/C][C]3801.06[/C][C]3316.65855115329[/C][C]484.401448846709[/C][/ROW]
[ROW][C]20[/C][C]3570.12[/C][C]3489.63918611761[/C][C]80.48081388239[/C][/ROW]
[ROW][C]21[/C][C]3701.61[/C][C]3409.17034643484[/C][C]292.439653565159[/C][/ROW]
[ROW][C]22[/C][C]3862.27[/C][C]3428.42082849047[/C][C]433.849171509530[/C][/ROW]
[ROW][C]23[/C][C]3970.1[/C][C]3492.46745599308[/C][C]477.632544006919[/C][/ROW]
[ROW][C]24[/C][C]4138.52[/C][C]3509.16337170957[/C][C]629.356628290426[/C][/ROW]
[ROW][C]25[/C][C]4199.75[/C][C]3445.84662030386[/C][C]753.903379696142[/C][/ROW]
[ROW][C]26[/C][C]4290.89[/C][C]3477.14005795827[/C][C]813.749942041732[/C][/ROW]
[ROW][C]27[/C][C]4443.91[/C][C]3452.14180163958[/C][C]991.768198360415[/C][/ROW]
[ROW][C]28[/C][C]4502.64[/C][C]3381.98246182547[/C][C]1120.65753817453[/C][/ROW]
[ROW][C]29[/C][C]4356.98[/C][C]3420.3009569125[/C][C]936.679043087497[/C][/ROW]
[ROW][C]30[/C][C]4591.27[/C][C]3398.13097046929[/C][C]1193.13902953071[/C][/ROW]
[ROW][C]31[/C][C]4696.96[/C][C]3419.47984630349[/C][C]1277.48015369650[/C][/ROW]
[ROW][C]32[/C][C]4621.4[/C][C]3439.91637701658[/C][C]1181.48362298342[/C][/ROW]
[ROW][C]33[/C][C]4562.84[/C][C]3450.77328395791[/C][C]1112.06671604209[/C][/ROW]
[ROW][C]34[/C][C]4202.52[/C][C]3442.65341237994[/C][C]759.866587620062[/C][/ROW]
[ROW][C]35[/C][C]4296.49[/C][C]3373.77135573539[/C][C]922.718644264608[/C][/ROW]
[ROW][C]36[/C][C]4435.23[/C][C]3319.57805554087[/C][C]1115.65194445913[/C][/ROW]
[ROW][C]37[/C][C]4105.18[/C][C]3258.99833949852[/C][C]846.181660501483[/C][/ROW]
[ROW][C]38[/C][C]4116.68[/C][C]3254.52784840503[/C][C]862.15215159497[/C][/ROW]
[ROW][C]39[/C][C]3844.49[/C][C]3104.08213793237[/C][C]740.407862067629[/C][/ROW]
[ROW][C]40[/C][C]3720.98[/C][C]3035.29131579994[/C][C]685.688684200064[/C][/ROW]
[ROW][C]41[/C][C]3674.4[/C][C]3038.94069628442[/C][C]635.459303715585[/C][/ROW]
[ROW][C]42[/C][C]3857.62[/C][C]3177.98209274308[/C][C]679.637907256923[/C][/ROW]
[ROW][C]43[/C][C]3801.06[/C][C]3191.02862797509[/C][C]610.03137202491[/C][/ROW]
[ROW][C]44[/C][C]3504.37[/C][C]3195.59035358069[/C][C]308.77964641931[/C][/ROW]
[ROW][C]45[/C][C]3032.6[/C][C]3123.78879254856[/C][C]-91.1887925485595[/C][/ROW]
[ROW][C]46[/C][C]3047.03[/C][C]3224.05552135963[/C][C]-177.025521359628[/C][/ROW]
[ROW][C]47[/C][C]2962.34[/C][C]3187.19677846639[/C][C]-224.856778466387[/C][/ROW]
[ROW][C]48[/C][C]2197.82[/C][C]3081.27350990438[/C][C]-883.453509904375[/C][/ROW]
[ROW][C]49[/C][C]2014.45[/C][C]3122.23780584266[/C][C]-1107.78780584266[/C][/ROW]
[ROW][C]50[/C][C]1862.83[/C][C]3080.72610283170[/C][C]-1217.89610283170[/C][/ROW]
[ROW][C]51[/C][C]1905.41[/C][C]2973.06937853956[/C][C]-1067.65937853956[/C][/ROW]
[ROW][C]52[/C][C]1810.99[/C][C]2720.80595254993[/C][C]-909.815952549932[/C][/ROW]
[ROW][C]53[/C][C]1670.07[/C][C]2780.83826151962[/C][C]-1110.76826151962[/C][/ROW]
[ROW][C]54[/C][C]1864.44[/C][C]2883.29461862137[/C][C]-1018.85461862137[/C][/ROW]
[ROW][C]55[/C][C]2052.02[/C][C]2872.89388424061[/C][C]-820.873884240607[/C][/ROW]
[ROW][C]56[/C][C]2029.6[/C][C]2886.67029556952[/C][C]-857.070295569517[/C][/ROW]
[ROW][C]57[/C][C]2070.83[/C][C]2922.61669334164[/C][C]-851.786693341638[/C][/ROW]
[ROW][C]58[/C][C]2293.41[/C][C]2914.95299432423[/C][C]-621.542994324231[/C][/ROW]
[ROW][C]59[/C][C]2443.27[/C][C]2861.58080473872[/C][C]-418.310804738721[/C][/ROW]
[ROW][C]60[/C][C]2513.17[/C][C]2804.28553113240[/C][C]-291.115531132396[/C][/ROW]
[/TABLE]
Source: https://freestatistics.org/blog/index.php?pk=69761&T=4

Globally Unique Identifier (entire table): ba.freestatistics.org/blog/index.php?pk=69761&T=4

As an alternative you can also use a QR Code:  

The GUIDs for individual cells are displayed in the table below:

Multiple Linear Regression - Actuals, Interpolation, and Residuals
Time or IndexActualsInterpolationForecastResidualsPrediction Error
12849.273881.5826501507-1032.31265015070
22921.443904.11757464235-982.677574642347
32981.853924.00669828276-942.15669828276
43080.583918.89756560449-838.317565604488
53106.223910.41275597807-804.192755978074
63119.313902.20164988800-782.891649887995
73061.263897.09251720972-835.832517209724
83097.313837.69884982482-740.388849824824
93161.693838.33749140961-676.647491409607
103257.163828.75786763785-571.59786763785
113277.013781.9545629244-504.944562924402
123295.323726.30151053609-430.981510536093
133363.993684.60733850092-320.617338500917
143494.173613.35318454146-119.183184541458
153667.033546.56952167549120.460478324513
163813.063511.26176548815301.798234511850
173917.963515.36731853319402.592681466811
183895.513413.27589947988482.23410052012
193801.063316.65855115329484.401448846709
203570.123489.6391861176180.48081388239
213701.613409.17034643484292.439653565159
223862.273428.42082849047433.849171509530
233970.13492.46745599308477.632544006919
244138.523509.16337170957629.356628290426
254199.753445.84662030386753.903379696142
264290.893477.14005795827813.749942041732
274443.913452.14180163958991.768198360415
284502.643381.982461825471120.65753817453
294356.983420.3009569125936.679043087497
304591.273398.130970469291193.13902953071
314696.963419.479846303491277.48015369650
324621.43439.916377016581181.48362298342
334562.843450.773283957911112.06671604209
344202.523442.65341237994759.866587620062
354296.493373.77135573539922.718644264608
364435.233319.578055540871115.65194445913
374105.183258.99833949852846.181660501483
384116.683254.52784840503862.15215159497
393844.493104.08213793237740.407862067629
403720.983035.29131579994685.688684200064
413674.43038.94069628442635.459303715585
423857.623177.98209274308679.637907256923
433801.063191.02862797509610.03137202491
443504.373195.59035358069308.77964641931
453032.63123.78879254856-91.1887925485595
463047.033224.05552135963-177.025521359628
472962.343187.19677846639-224.856778466387
482197.823081.27350990438-883.453509904375
492014.453122.23780584266-1107.78780584266
501862.833080.72610283170-1217.89610283170
511905.412973.06937853956-1067.65937853956
521810.992720.80595254993-909.815952549932
531670.072780.83826151962-1110.76826151962
541864.442883.29461862137-1018.85461862137
552052.022872.89388424061-820.873884240607
562029.62886.67029556952-857.070295569517
572070.832922.61669334164-851.786693341638
582293.412914.95299432423-621.542994324231
592443.272861.58080473872-418.310804738721
602513.172804.28553113240-291.115531132396


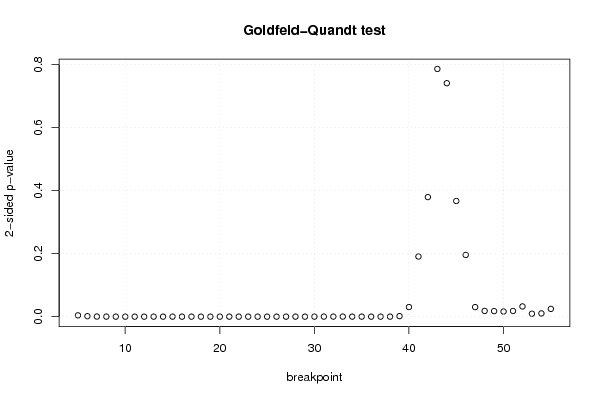
Goldfeld-Quandt test for Heteroskedasticity
p-valuesAlternative Hypothesis
breakpoint indexgreater2-sidedless
50.002069388486259040.004138776972518080.997930611513741
60.0007543269380708940.001508653876141790.99924567306193
70.0001493366787538310.0002986733575076610.999850663321246
85.86829119425709e-050.0001173658238851420.999941317088057
91.6316718708843e-053.2633437417686e-050.999983683281291
106.99960628329258e-061.39992125665852e-050.999993000393717
111.8418555949296e-063.6837111898592e-060.999998158144405
125.80679816245523e-071.16135963249105e-060.999999419320184
131.93623428407487e-073.87246856814974e-070.999999806376572
145.7271513881778e-081.14543027763556e-070.999999942728486
151.59318855053961e-083.18637710107922e-080.999999984068114
166.3159592473467e-091.26319184946934e-080.99999999368404
176.77083383233271e-091.35416676646654e-080.999999993229166
181.54855290508850e-093.09710581017699e-090.999999998451447
197.95654953357986e-091.59130990671597e-080.99999999204345
207.81103201674215e-091.56220640334843e-080.999999992188968
214.00375786556223e-098.00751573112447e-090.999999995996242
221.23467451434066e-092.46934902868133e-090.999999998765325
233.67289010885263e-097.34578021770525e-090.99999999632711
249.8273452178026e-081.96546904356052e-070.999999901726548
252.53562938149857e-075.07125876299715e-070.999999746437062
261.65474066886487e-063.30948133772974e-060.999998345259331
279.7091604913074e-061.94183209826148e-050.999990290839509
281.49945169891228e-052.99890339782457e-050.99998500548301
291.22395087155627e-052.44790174311254e-050.999987760491284
302.25989135986825e-054.51978271973650e-050.999977401086401
316.91318127393004e-050.0001382636254786010.99993086818726
320.0001118907104465870.0002237814208931730.999888109289553
330.0001251053553982770.0002502107107965530.999874894644602
346.37826069104518e-050.0001275652138209040.99993621739309
352.86026743238173e-055.72053486476346e-050.999971397325676
361.72145029393680e-053.44290058787359e-050.99998278549706
372.49511376559358e-054.99022753118716e-050.999975048862344
383.54302898201639e-057.08605796403278e-050.99996456971018
390.0008040114236304510.001608022847260900.99919598857637
400.01524334470708310.03048668941416630.984756655292917
410.0953682892944840.1907365785889680.904631710705516
420.1896282956548450.3792565913096910.810371704345155
430.3928524293768550.785704858753710.607147570623146
440.6297327472756830.7405345054486340.370267252724317
450.8165132483352480.3669735033295050.183486751664752
460.9021085465940850.1957829068118310.0978914534059153
470.9848732711380750.03025345772384940.0151267288619247
480.9909017752934440.01819644941311280.00909822470655642
490.9911975065560330.01760498688793420.00880249344396708
500.9918313461575350.01633730768493040.0081686538424652
510.9909801996293360.01803960074132820.00901980037066411
520.9837822515992210.03243549680155760.0162177484007788
530.9953389777763710.00932204444725750.00466102222362875
540.9948239509665070.01035209806698560.00517604903349278
550.987725005913320.02454998817336130.0122749940866806

\begin{tabular}{lllllllll}
\hline
Goldfeld-Quandt test for Heteroskedasticity \tabularnewline
p-values & Alternative Hypothesis \tabularnewline
breakpoint index & greater & 2-sided & less \tabularnewline
5 & 0.00206938848625904 & 0.00413877697251808 & 0.997930611513741 \tabularnewline
6 & 0.000754326938070894 & 0.00150865387614179 & 0.99924567306193 \tabularnewline
7 & 0.000149336678753831 & 0.000298673357507661 & 0.999850663321246 \tabularnewline
8 & 5.86829119425709e-05 & 0.000117365823885142 & 0.999941317088057 \tabularnewline
9 & 1.6316718708843e-05 & 3.2633437417686e-05 & 0.999983683281291 \tabularnewline
10 & 6.99960628329258e-06 & 1.39992125665852e-05 & 0.999993000393717 \tabularnewline
11 & 1.8418555949296e-06 & 3.6837111898592e-06 & 0.999998158144405 \tabularnewline
12 & 5.80679816245523e-07 & 1.16135963249105e-06 & 0.999999419320184 \tabularnewline
13 & 1.93623428407487e-07 & 3.87246856814974e-07 & 0.999999806376572 \tabularnewline
14 & 5.7271513881778e-08 & 1.14543027763556e-07 & 0.999999942728486 \tabularnewline
15 & 1.59318855053961e-08 & 3.18637710107922e-08 & 0.999999984068114 \tabularnewline
16 & 6.3159592473467e-09 & 1.26319184946934e-08 & 0.99999999368404 \tabularnewline
17 & 6.77083383233271e-09 & 1.35416676646654e-08 & 0.999999993229166 \tabularnewline
18 & 1.54855290508850e-09 & 3.09710581017699e-09 & 0.999999998451447 \tabularnewline
19 & 7.95654953357986e-09 & 1.59130990671597e-08 & 0.99999999204345 \tabularnewline
20 & 7.81103201674215e-09 & 1.56220640334843e-08 & 0.999999992188968 \tabularnewline
21 & 4.00375786556223e-09 & 8.00751573112447e-09 & 0.999999995996242 \tabularnewline
22 & 1.23467451434066e-09 & 2.46934902868133e-09 & 0.999999998765325 \tabularnewline
23 & 3.67289010885263e-09 & 7.34578021770525e-09 & 0.99999999632711 \tabularnewline
24 & 9.8273452178026e-08 & 1.96546904356052e-07 & 0.999999901726548 \tabularnewline
25 & 2.53562938149857e-07 & 5.07125876299715e-07 & 0.999999746437062 \tabularnewline
26 & 1.65474066886487e-06 & 3.30948133772974e-06 & 0.999998345259331 \tabularnewline
27 & 9.7091604913074e-06 & 1.94183209826148e-05 & 0.999990290839509 \tabularnewline
28 & 1.49945169891228e-05 & 2.99890339782457e-05 & 0.99998500548301 \tabularnewline
29 & 1.22395087155627e-05 & 2.44790174311254e-05 & 0.999987760491284 \tabularnewline
30 & 2.25989135986825e-05 & 4.51978271973650e-05 & 0.999977401086401 \tabularnewline
31 & 6.91318127393004e-05 & 0.000138263625478601 & 0.99993086818726 \tabularnewline
32 & 0.000111890710446587 & 0.000223781420893173 & 0.999888109289553 \tabularnewline
33 & 0.000125105355398277 & 0.000250210710796553 & 0.999874894644602 \tabularnewline
34 & 6.37826069104518e-05 & 0.000127565213820904 & 0.99993621739309 \tabularnewline
35 & 2.86026743238173e-05 & 5.72053486476346e-05 & 0.999971397325676 \tabularnewline
36 & 1.72145029393680e-05 & 3.44290058787359e-05 & 0.99998278549706 \tabularnewline
37 & 2.49511376559358e-05 & 4.99022753118716e-05 & 0.999975048862344 \tabularnewline
38 & 3.54302898201639e-05 & 7.08605796403278e-05 & 0.99996456971018 \tabularnewline
39 & 0.000804011423630451 & 0.00160802284726090 & 0.99919598857637 \tabularnewline
40 & 0.0152433447070831 & 0.0304866894141663 & 0.984756655292917 \tabularnewline
41 & 0.095368289294484 & 0.190736578588968 & 0.904631710705516 \tabularnewline
42 & 0.189628295654845 & 0.379256591309691 & 0.810371704345155 \tabularnewline
43 & 0.392852429376855 & 0.78570485875371 & 0.607147570623146 \tabularnewline
44 & 0.629732747275683 & 0.740534505448634 & 0.370267252724317 \tabularnewline
45 & 0.816513248335248 & 0.366973503329505 & 0.183486751664752 \tabularnewline
46 & 0.902108546594085 & 0.195782906811831 & 0.0978914534059153 \tabularnewline
47 & 0.984873271138075 & 0.0302534577238494 & 0.0151267288619247 \tabularnewline
48 & 0.990901775293444 & 0.0181964494131128 & 0.00909822470655642 \tabularnewline
49 & 0.991197506556033 & 0.0176049868879342 & 0.00880249344396708 \tabularnewline
50 & 0.991831346157535 & 0.0163373076849304 & 0.0081686538424652 \tabularnewline
51 & 0.990980199629336 & 0.0180396007413282 & 0.00901980037066411 \tabularnewline
52 & 0.983782251599221 & 0.0324354968015576 & 0.0162177484007788 \tabularnewline
53 & 0.995338977776371 & 0.0093220444472575 & 0.00466102222362875 \tabularnewline
54 & 0.994823950966507 & 0.0103520980669856 & 0.00517604903349278 \tabularnewline
55 & 0.98772500591332 & 0.0245499881733613 & 0.0122749940866806 \tabularnewline
\hline
\end{tabular}
%Source: https://freestatistics.org/blog/index.php?pk=69761&T=5

[TABLE]
[ROW][C]Goldfeld-Quandt test for Heteroskedasticity[/C][/ROW]
[ROW][C]p-values[/C][C]Alternative Hypothesis[/C][/ROW]
[ROW][C]breakpoint index[/C][C]greater[/C][C]2-sided[/C][C]less[/C][/ROW]
[ROW][C]5[/C][C]0.00206938848625904[/C][C]0.00413877697251808[/C][C]0.997930611513741[/C][/ROW]
[ROW][C]6[/C][C]0.000754326938070894[/C][C]0.00150865387614179[/C][C]0.99924567306193[/C][/ROW]
[ROW][C]7[/C][C]0.000149336678753831[/C][C]0.000298673357507661[/C][C]0.999850663321246[/C][/ROW]
[ROW][C]8[/C][C]5.86829119425709e-05[/C][C]0.000117365823885142[/C][C]0.999941317088057[/C][/ROW]
[ROW][C]9[/C][C]1.6316718708843e-05[/C][C]3.2633437417686e-05[/C][C]0.999983683281291[/C][/ROW]
[ROW][C]10[/C][C]6.99960628329258e-06[/C][C]1.39992125665852e-05[/C][C]0.999993000393717[/C][/ROW]
[ROW][C]11[/C][C]1.8418555949296e-06[/C][C]3.6837111898592e-06[/C][C]0.999998158144405[/C][/ROW]
[ROW][C]12[/C][C]5.80679816245523e-07[/C][C]1.16135963249105e-06[/C][C]0.999999419320184[/C][/ROW]
[ROW][C]13[/C][C]1.93623428407487e-07[/C][C]3.87246856814974e-07[/C][C]0.999999806376572[/C][/ROW]
[ROW][C]14[/C][C]5.7271513881778e-08[/C][C]1.14543027763556e-07[/C][C]0.999999942728486[/C][/ROW]
[ROW][C]15[/C][C]1.59318855053961e-08[/C][C]3.18637710107922e-08[/C][C]0.999999984068114[/C][/ROW]
[ROW][C]16[/C][C]6.3159592473467e-09[/C][C]1.26319184946934e-08[/C][C]0.99999999368404[/C][/ROW]
[ROW][C]17[/C][C]6.77083383233271e-09[/C][C]1.35416676646654e-08[/C][C]0.999999993229166[/C][/ROW]
[ROW][C]18[/C][C]1.54855290508850e-09[/C][C]3.09710581017699e-09[/C][C]0.999999998451447[/C][/ROW]
[ROW][C]19[/C][C]7.95654953357986e-09[/C][C]1.59130990671597e-08[/C][C]0.99999999204345[/C][/ROW]
[ROW][C]20[/C][C]7.81103201674215e-09[/C][C]1.56220640334843e-08[/C][C]0.999999992188968[/C][/ROW]
[ROW][C]21[/C][C]4.00375786556223e-09[/C][C]8.00751573112447e-09[/C][C]0.999999995996242[/C][/ROW]
[ROW][C]22[/C][C]1.23467451434066e-09[/C][C]2.46934902868133e-09[/C][C]0.999999998765325[/C][/ROW]
[ROW][C]23[/C][C]3.67289010885263e-09[/C][C]7.34578021770525e-09[/C][C]0.99999999632711[/C][/ROW]
[ROW][C]24[/C][C]9.8273452178026e-08[/C][C]1.96546904356052e-07[/C][C]0.999999901726548[/C][/ROW]
[ROW][C]25[/C][C]2.53562938149857e-07[/C][C]5.07125876299715e-07[/C][C]0.999999746437062[/C][/ROW]
[ROW][C]26[/C][C]1.65474066886487e-06[/C][C]3.30948133772974e-06[/C][C]0.999998345259331[/C][/ROW]
[ROW][C]27[/C][C]9.7091604913074e-06[/C][C]1.94183209826148e-05[/C][C]0.999990290839509[/C][/ROW]
[ROW][C]28[/C][C]1.49945169891228e-05[/C][C]2.99890339782457e-05[/C][C]0.99998500548301[/C][/ROW]
[ROW][C]29[/C][C]1.22395087155627e-05[/C][C]2.44790174311254e-05[/C][C]0.999987760491284[/C][/ROW]
[ROW][C]30[/C][C]2.25989135986825e-05[/C][C]4.51978271973650e-05[/C][C]0.999977401086401[/C][/ROW]
[ROW][C]31[/C][C]6.91318127393004e-05[/C][C]0.000138263625478601[/C][C]0.99993086818726[/C][/ROW]
[ROW][C]32[/C][C]0.000111890710446587[/C][C]0.000223781420893173[/C][C]0.999888109289553[/C][/ROW]
[ROW][C]33[/C][C]0.000125105355398277[/C][C]0.000250210710796553[/C][C]0.999874894644602[/C][/ROW]
[ROW][C]34[/C][C]6.37826069104518e-05[/C][C]0.000127565213820904[/C][C]0.99993621739309[/C][/ROW]
[ROW][C]35[/C][C]2.86026743238173e-05[/C][C]5.72053486476346e-05[/C][C]0.999971397325676[/C][/ROW]
[ROW][C]36[/C][C]1.72145029393680e-05[/C][C]3.44290058787359e-05[/C][C]0.99998278549706[/C][/ROW]
[ROW][C]37[/C][C]2.49511376559358e-05[/C][C]4.99022753118716e-05[/C][C]0.999975048862344[/C][/ROW]
[ROW][C]38[/C][C]3.54302898201639e-05[/C][C]7.08605796403278e-05[/C][C]0.99996456971018[/C][/ROW]
[ROW][C]39[/C][C]0.000804011423630451[/C][C]0.00160802284726090[/C][C]0.99919598857637[/C][/ROW]
[ROW][C]40[/C][C]0.0152433447070831[/C][C]0.0304866894141663[/C][C]0.984756655292917[/C][/ROW]
[ROW][C]41[/C][C]0.095368289294484[/C][C]0.190736578588968[/C][C]0.904631710705516[/C][/ROW]
[ROW][C]42[/C][C]0.189628295654845[/C][C]0.379256591309691[/C][C]0.810371704345155[/C][/ROW]
[ROW][C]43[/C][C]0.392852429376855[/C][C]0.78570485875371[/C][C]0.607147570623146[/C][/ROW]
[ROW][C]44[/C][C]0.629732747275683[/C][C]0.740534505448634[/C][C]0.370267252724317[/C][/ROW]
[ROW][C]45[/C][C]0.816513248335248[/C][C]0.366973503329505[/C][C]0.183486751664752[/C][/ROW]
[ROW][C]46[/C][C]0.902108546594085[/C][C]0.195782906811831[/C][C]0.0978914534059153[/C][/ROW]
[ROW][C]47[/C][C]0.984873271138075[/C][C]0.0302534577238494[/C][C]0.0151267288619247[/C][/ROW]
[ROW][C]48[/C][C]0.990901775293444[/C][C]0.0181964494131128[/C][C]0.00909822470655642[/C][/ROW]
[ROW][C]49[/C][C]0.991197506556033[/C][C]0.0176049868879342[/C][C]0.00880249344396708[/C][/ROW]
[ROW][C]50[/C][C]0.991831346157535[/C][C]0.0163373076849304[/C][C]0.0081686538424652[/C][/ROW]
[ROW][C]51[/C][C]0.990980199629336[/C][C]0.0180396007413282[/C][C]0.00901980037066411[/C][/ROW]
[ROW][C]52[/C][C]0.983782251599221[/C][C]0.0324354968015576[/C][C]0.0162177484007788[/C][/ROW]
[ROW][C]53[/C][C]0.995338977776371[/C][C]0.0093220444472575[/C][C]0.00466102222362875[/C][/ROW]
[ROW][C]54[/C][C]0.994823950966507[/C][C]0.0103520980669856[/C][C]0.00517604903349278[/C][/ROW]
[ROW][C]55[/C][C]0.98772500591332[/C][C]0.0245499881733613[/C][C]0.0122749940866806[/C][/ROW]
[/TABLE]
Source: https://freestatistics.org/blog/index.php?pk=69761&T=5

Globally Unique Identifier (entire table): ba.freestatistics.org/blog/index.php?pk=69761&T=5

As an alternative you can also use a QR Code:  

The GUIDs for individual cells are displayed in the table below:

Goldfeld-Quandt test for Heteroskedasticity
p-valuesAlternative Hypothesis
breakpoint indexgreater2-sidedless
50.002069388486259040.004138776972518080.997930611513741
60.0007543269380708940.001508653876141790.99924567306193
70.0001493366787538310.0002986733575076610.999850663321246
85.86829119425709e-050.0001173658238851420.999941317088057
91.6316718708843e-053.2633437417686e-050.999983683281291
106.99960628329258e-061.39992125665852e-050.999993000393717
111.8418555949296e-063.6837111898592e-060.999998158144405
125.80679816245523e-071.16135963249105e-060.999999419320184
131.93623428407487e-073.87246856814974e-070.999999806376572
145.7271513881778e-081.14543027763556e-070.999999942728486
151.59318855053961e-083.18637710107922e-080.999999984068114
166.3159592473467e-091.26319184946934e-080.99999999368404
176.77083383233271e-091.35416676646654e-080.999999993229166
181.54855290508850e-093.09710581017699e-090.999999998451447
197.95654953357986e-091.59130990671597e-080.99999999204345
207.81103201674215e-091.56220640334843e-080.999999992188968
214.00375786556223e-098.00751573112447e-090.999999995996242
221.23467451434066e-092.46934902868133e-090.999999998765325
233.67289010885263e-097.34578021770525e-090.99999999632711
249.8273452178026e-081.96546904356052e-070.999999901726548
252.53562938149857e-075.07125876299715e-070.999999746437062
261.65474066886487e-063.30948133772974e-060.999998345259331
279.7091604913074e-061.94183209826148e-050.999990290839509
281.49945169891228e-052.99890339782457e-050.99998500548301
291.22395087155627e-052.44790174311254e-050.999987760491284
302.25989135986825e-054.51978271973650e-050.999977401086401
316.91318127393004e-050.0001382636254786010.99993086818726
320.0001118907104465870.0002237814208931730.999888109289553
330.0001251053553982770.0002502107107965530.999874894644602
346.37826069104518e-050.0001275652138209040.99993621739309
352.86026743238173e-055.72053486476346e-050.999971397325676
361.72145029393680e-053.44290058787359e-050.99998278549706
372.49511376559358e-054.99022753118716e-050.999975048862344
383.54302898201639e-057.08605796403278e-050.99996456971018
390.0008040114236304510.001608022847260900.99919598857637
400.01524334470708310.03048668941416630.984756655292917
410.0953682892944840.1907365785889680.904631710705516
420.1896282956548450.3792565913096910.810371704345155
430.3928524293768550.785704858753710.607147570623146
440.6297327472756830.7405345054486340.370267252724317
450.8165132483352480.3669735033295050.183486751664752
460.9021085465940850.1957829068118310.0978914534059153
470.9848732711380750.03025345772384940.0151267288619247
480.9909017752934440.01819644941311280.00909822470655642
490.9911975065560330.01760498688793420.00880249344396708
500.9918313461575350.01633730768493040.0081686538424652
510.9909801996293360.01803960074132820.00901980037066411
520.9837822515992210.03243549680155760.0162177484007788
530.9953389777763710.00932204444725750.00466102222362875
540.9948239509665070.01035209806698560.00517604903349278
550.987725005913320.02454998817336130.0122749940866806


Meta Analysis of Goldfeld-Quandt test for Heteroskedasticity
Description# significant tests% significant testsOK/NOK
1% type I error level360.705882352941177NOK
5% type I error level450.88235294117647NOK
10% type I error level450.88235294117647NOK

\begin{tabular}{lllllllll}
\hline
Meta Analysis of Goldfeld-Quandt test for Heteroskedasticity \tabularnewline
Description & # significant tests & % significant tests & OK/NOK \tabularnewline
1% type I error level & 36 & 0.705882352941177 & NOK \tabularnewline
5% type I error level & 45 & 0.88235294117647 & NOK \tabularnewline
10% type I error level & 45 & 0.88235294117647 & NOK \tabularnewline
\hline
\end{tabular}
%Source: https://freestatistics.org/blog/index.php?pk=69761&T=6

[TABLE]
[ROW][C]Meta Analysis of Goldfeld-Quandt test for Heteroskedasticity[/C][/ROW]
[ROW][C]Description[/C][C]# significant tests[/C][C]% significant tests[/C][C]OK/NOK[/C][/ROW]
[ROW][C]1% type I error level[/C][C]36[/C][C]0.705882352941177[/C][C]NOK[/C][/ROW]
[ROW][C]5% type I error level[/C][C]45[/C][C]0.88235294117647[/C][C]NOK[/C][/ROW]
[ROW][C]10% type I error level[/C][C]45[/C][C]0.88235294117647[/C][C]NOK[/C][/ROW]
[/TABLE]
Source: https://freestatistics.org/blog/index.php?pk=69761&T=6

Globally Unique Identifier (entire table): ba.freestatistics.org/blog/index.php?pk=69761&T=6

As an alternative you can also use a QR Code:  

The GUIDs for individual cells are displayed in the table below:

Meta Analysis of Goldfeld-Quandt test for Heteroskedasticity
Description# significant tests% significant testsOK/NOK
1% type I error level360.705882352941177NOK
5% type I error level450.88235294117647NOK
10% type I error level450.88235294117647NOK


Parameters (Session):
par1 = 1 ; par2 = Do not include Seasonal Dummies ; par3 = No Linear Trend ;
Parameters (R input):
par1 = 1 ; par2 = Do not include Seasonal Dummies ; par3 = No Linear Trend ;
R code (references can be found in the software module):
library(lattice)
library(lmtest)
n25 <- 25 #minimum number of obs. for Goldfeld-Quandt test
par1 <- as.numeric(par1)
x <- t(y)
k <- length(x[1,])
n <- length(x[,1])
x1 <- cbind(x[,par1], x[,1:k!=par1])
mycolnames <- c(colnames(x)[par1], colnames(x)[1:k!=par1])
colnames(x1) <- mycolnames #colnames(x)[par1]
x <- x1
if (par3 == 'First Differences'){
x2 <- array(0, dim=c(n-1,k), dimnames=list(1:(n-1), paste('(1-B)',colnames(x),sep='')))
for (i in 1:n-1) {
for (j in 1:k) {
x2[i,j] <- x[i+1,j] - x[i,j]
}
}
x <- x2
}
if (par2 == 'Include Monthly Dummies'){
x2 <- array(0, dim=c(n,11), dimnames=list(1:n, paste('M', seq(1:11), sep ='')))
for (i in 1:11){
x2[seq(i,n,12),i] <- 1
}
x <- cbind(x, x2)
}
if (par2 == 'Include Quarterly Dummies'){
x2 <- array(0, dim=c(n,3), dimnames=list(1:n, paste('Q', seq(1:3), sep ='')))
for (i in 1:3){
x2[seq(i,n,4),i] <- 1
}
x <- cbind(x, x2)
}
k <- length(x[1,])
if (par3 == 'Linear Trend'){
x <- cbind(x, c(1:n))
colnames(x)[k+1] <- 't'
}
x
k <- length(x[1,])
df <- as.data.frame(x)
(mylm <- lm(df))
(mysum <- summary(mylm))
if (n > n25) {
kp3 <- k + 3
nmkm3 <- n - k - 3
gqarr <- array(NA, dim=c(nmkm3-kp3+1,3))
numgqtests <- 0
numsignificant1 <- 0
numsignificant5 <- 0
numsignificant10 <- 0
for (mypoint in kp3:nmkm3) {
j <- 0
numgqtests <- numgqtests + 1
for (myalt in c('greater', 'two.sided', 'less')) {
j <- j + 1
gqarr[mypoint-kp3+1,j] <- gqtest(mylm, point=mypoint, alternative=myalt)$p.value
}
if (gqarr[mypoint-kp3+1,2] < 0.01) numsignificant1 <- numsignificant1 + 1
if (gqarr[mypoint-kp3+1,2] < 0.05) numsignificant5 <- numsignificant5 + 1
if (gqarr[mypoint-kp3+1,2] < 0.10) numsignificant10 <- numsignificant10 + 1
}
gqarr
}
bitmap(file='test0.png')
plot(x[,1], type='l', main='Actuals and Interpolation', ylab='value of Actuals and Interpolation (dots)', xlab='time or index')
points(x[,1]-mysum$resid)
grid()
dev.off()
bitmap(file='test1.png')
plot(mysum$resid, type='b', pch=19, main='Residuals', ylab='value of Residuals', xlab='time or index')
grid()
dev.off()
bitmap(file='test2.png')
hist(mysum$resid, main='Residual Histogram', xlab='values of Residuals')
grid()
dev.off()
bitmap(file='test3.png')
densityplot(~mysum$resid,col='black',main='Residual Density Plot', xlab='values of Residuals')
dev.off()
bitmap(file='test4.png')
qqnorm(mysum$resid, main='Residual Normal Q-Q Plot')
qqline(mysum$resid)
grid()
dev.off()
(myerror <- as.ts(mysum$resid))
bitmap(file='test5.png')
dum <- cbind(lag(myerror,k=1),myerror)
dum
dum1 <- dum[2:length(myerror),]
dum1
z <- as.data.frame(dum1)
z
plot(z,main=paste('Residual Lag plot, lowess, and regression line'), ylab='values of Residuals', xlab='lagged values of Residuals')
lines(lowess(z))
abline(lm(z))
grid()
dev.off()
bitmap(file='test6.png')
acf(mysum$resid, lag.max=length(mysum$resid)/2, main='Residual Autocorrelation Function')
grid()
dev.off()
bitmap(file='test7.png')
pacf(mysum$resid, lag.max=length(mysum$resid)/2, main='Residual Partial Autocorrelation Function')
grid()
dev.off()
bitmap(file='test8.png')
opar <- par(mfrow = c(2,2), oma = c(0, 0, 1.1, 0))
plot(mylm, las = 1, sub='Residual Diagnostics')
par(opar)
dev.off()
if (n > n25) {
bitmap(file='test9.png')
plot(kp3:nmkm3,gqarr[,2], main='Goldfeld-Quandt test',ylab='2-sided p-value',xlab='breakpoint')
grid()
dev.off()
}
load(file='createtable')
a<-table.start()
a<-table.row.start(a)
a<-table.element(a, 'Multiple Linear Regression - Estimated Regression Equation', 1, TRUE)
a<-table.row.end(a)
myeq <- colnames(x)[1]
myeq <- paste(myeq, '[t] = ', sep='')
for (i in 1:k){
if (mysum$coefficients[i,1] > 0) myeq <- paste(myeq, '+', '')
myeq <- paste(myeq, mysum$coefficients[i,1], sep=' ')
if (rownames(mysum$coefficients)[i] != '(Intercept)') {
myeq <- paste(myeq, rownames(mysum$coefficients)[i], sep='')
if (rownames(mysum$coefficients)[i] != 't') myeq <- paste(myeq, '[t]', sep='')
}
}
myeq <- paste(myeq, ' + e[t]')
a<-table.row.start(a)
a<-table.element(a, myeq)
a<-table.row.end(a)
a<-table.end(a)
table.save(a,file='mytable1.tab')
a<-table.start()
a<-table.row.start(a)
a<-table.element(a,hyperlink('ols1.htm','Multiple Linear Regression - Ordinary Least Squares',''), 6, TRUE)
a<-table.row.end(a)
a<-table.row.start(a)
a<-table.element(a,'Variable',header=TRUE)
a<-table.element(a,'Parameter',header=TRUE)
a<-table.element(a,'S.D.',header=TRUE)
a<-table.element(a,'T-STAT
H0: parameter = 0',header=TRUE)
a<-table.element(a,'2-tail p-value',header=TRUE)
a<-table.element(a,'1-tail p-value',header=TRUE)
a<-table.row.end(a)
for (i in 1:k){
a<-table.row.start(a)
a<-table.element(a,rownames(mysum$coefficients)[i],header=TRUE)
a<-table.element(a,mysum$coefficients[i,1])
a<-table.element(a, round(mysum$coefficients[i,2],6))
a<-table.element(a, round(mysum$coefficients[i,3],4))
a<-table.element(a, round(mysum$coefficients[i,4],6))
a<-table.element(a, round(mysum$coefficients[i,4]/2,6))
a<-table.row.end(a)
}
a<-table.end(a)
table.save(a,file='mytable2.tab')
a<-table.start()
a<-table.row.start(a)
a<-table.element(a, 'Multiple Linear Regression - Regression Statistics', 2, TRUE)
a<-table.row.end(a)
a<-table.row.start(a)
a<-table.element(a, 'Multiple R',1,TRUE)
a<-table.element(a, sqrt(mysum$r.squared))
a<-table.row.end(a)
a<-table.row.start(a)
a<-table.element(a, 'R-squared',1,TRUE)
a<-table.element(a, mysum$r.squared)
a<-table.row.end(a)
a<-table.row.start(a)
a<-table.element(a, 'Adjusted R-squared',1,TRUE)
a<-table.element(a, mysum$adj.r.squared)
a<-table.row.end(a)
a<-table.row.start(a)
a<-table.element(a, 'F-TEST (value)',1,TRUE)
a<-table.element(a, mysum$fstatistic[1])
a<-table.row.end(a)
a<-table.row.start(a)
a<-table.element(a, 'F-TEST (DF numerator)',1,TRUE)
a<-table.element(a, mysum$fstatistic[2])
a<-table.row.end(a)
a<-table.row.start(a)
a<-table.element(a, 'F-TEST (DF denominator)',1,TRUE)
a<-table.element(a, mysum$fstatistic[3])
a<-table.row.end(a)
a<-table.row.start(a)
a<-table.element(a, 'p-value',1,TRUE)
a<-table.element(a, 1-pf(mysum$fstatistic[1],mysum$fstatistic[2],mysum$fstatistic[3]))
a<-table.row.end(a)
a<-table.row.start(a)
a<-table.element(a, 'Multiple Linear Regression - Residual Statistics', 2, TRUE)
a<-table.row.end(a)
a<-table.row.start(a)
a<-table.element(a, 'Residual Standard Deviation',1,TRUE)
a<-table.element(a, mysum$sigma)
a<-table.row.end(a)
a<-table.row.start(a)
a<-table.element(a, 'Sum Squared Residuals',1,TRUE)
a<-table.element(a, sum(myerror*myerror))
a<-table.row.end(a)
a<-table.end(a)
table.save(a,file='mytable3.tab')
a<-table.start()
a<-table.row.start(a)
a<-table.element(a, 'Multiple Linear Regression - Actuals, Interpolation, and Residuals', 4, TRUE)
a<-table.row.end(a)
a<-table.row.start(a)
a<-table.element(a, 'Time or Index', 1, TRUE)
a<-table.element(a, 'Actuals', 1, TRUE)
a<-table.element(a, 'Interpolation
Forecast', 1, TRUE)
a<-table.element(a, 'Residuals
Prediction Error', 1, TRUE)
a<-table.row.end(a)
for (i in 1:n) {
a<-table.row.start(a)
a<-table.element(a,i, 1, TRUE)
a<-table.element(a,x[i])
a<-table.element(a,x[i]-mysum$resid[i])
a<-table.element(a,mysum$resid[i])
a<-table.row.end(a)
}
a<-table.end(a)
table.save(a,file='mytable4.tab')
if (n > n25) {
a<-table.start()
a<-table.row.start(a)
a<-table.element(a,'Goldfeld-Quandt test for Heteroskedasticity',4,TRUE)
a<-table.row.end(a)
a<-table.row.start(a)
a<-table.element(a,'p-values',header=TRUE)
a<-table.element(a,'Alternative Hypothesis',3,header=TRUE)
a<-table.row.end(a)
a<-table.row.start(a)
a<-table.element(a,'breakpoint index',header=TRUE)
a<-table.element(a,'greater',header=TRUE)
a<-table.element(a,'2-sided',header=TRUE)
a<-table.element(a,'less',header=TRUE)
a<-table.row.end(a)
for (mypoint in kp3:nmkm3) {
a<-table.row.start(a)
a<-table.element(a,mypoint,header=TRUE)
a<-table.element(a,gqarr[mypoint-kp3+1,1])
a<-table.element(a,gqarr[mypoint-kp3+1,2])
a<-table.element(a,gqarr[mypoint-kp3+1,3])
a<-table.row.end(a)
}
a<-table.end(a)
table.save(a,file='mytable5.tab')
a<-table.start()
a<-table.row.start(a)
a<-table.element(a,'Meta Analysis of Goldfeld-Quandt test for Heteroskedasticity',4,TRUE)
a<-table.row.end(a)
a<-table.row.start(a)
a<-table.element(a,'Description',header=TRUE)
a<-table.element(a,'# significant tests',header=TRUE)
a<-table.element(a,'% significant tests',header=TRUE)
a<-table.element(a,'OK/NOK',header=TRUE)
a<-table.row.end(a)
a<-table.row.start(a)
a<-table.element(a,'1% type I error level',header=TRUE)
a<-table.element(a,numsignificant1)
a<-table.element(a,numsignificant1/numgqtests)
if (numsignificant1/numgqtests < 0.01) dum <- 'OK' else dum <- 'NOK'
a<-table.element(a,dum)
a<-table.row.end(a)
a<-table.row.start(a)
a<-table.element(a,'5% type I error level',header=TRUE)
a<-table.element(a,numsignificant5)
a<-table.element(a,numsignificant5/numgqtests)
if (numsignificant5/numgqtests < 0.05) dum <- 'OK' else dum <- 'NOK'
a<-table.element(a,dum)
a<-table.row.end(a)
a<-table.row.start(a)
a<-table.element(a,'10% type I error level',header=TRUE)
a<-table.element(a,numsignificant10)
a<-table.element(a,numsignificant10/numgqtests)
if (numsignificant10/numgqtests < 0.1) dum <- 'OK' else dum <- 'NOK'
a<-table.element(a,dum)
a<-table.row.end(a)
a<-table.end(a)
table.save(a,file='mytable6.tab')
}