Free Statistics

of Irreproducible Research!

Author's title

Author*The author of this computation has been verified*
R Software Modulerwasp_autocorrelation.wasp
Title produced by software(Partial) Autocorrelation Function
Date of computationSun, 20 Dec 2009 03:04:05 -0700
Cite this page as followsStatistical Computations at FreeStatistics.org, Office for Research Development and Education, URL https://freestatistics.org/blog/index.php?v=date/2009/Dec/20/t1261303597yrgq85lysb48lw9.htm/, Retrieved Sat, 27 Apr 2024 06:35:48 +0000
Statistical Computations at FreeStatistics.org, Office for Research Development and Education, URL https://freestatistics.org/blog/index.php?pk=69812, Retrieved Sat, 27 Apr 2024 06:35:48 +0000
QR Codes:

Original text written by user:
IsPrivate?No (this computation is public)
User-defined keywords
Estimated Impact135
Family? (F = Feedback message, R = changed R code, M = changed R Module, P = changed Parameters, D = changed Data)
-     [(Partial) Autocorrelation Function] [Paper: Differenti...] [2009-12-20 09:54:01] [1d635fe1113b56bab3f378c464a289bc]
-   P     [(Partial) Autocorrelation Function] [Paper: Differenti...] [2009-12-20 10:04:05] [762da55b2e2304daaed24a7cc507d14d] [Current]
Feedback Forum

Post a new message
Dataseries X:
90.2
90
88.8
85.8
84.2
80
77.8
76.8
86.4
89.2
86.2
84.6
83.2
83.2
82.6
79.8
77.2
74.8
73
73
83.6
85.6
84.8
84.2
83.4
84.6
84.6
83.8
81.2
79.6
78
78.2
88.8
92
91
91.2
90.4
91.8
92.2
90.2
88.6
87.8
86
87.2
97.6
101.2
100.4
100.2
100.2
103
104.2
104
102.4
101.8
101
102.2
114
118.4
118.8
117.2
117.2
118.4
118.8
117.2
114.4
112.6
111
110.8
120.2
124.4
123.4
121.2
119
119.8
120
118.4
115
113.4
111
111
121.6
126.2
125.8
124.8
122
123.2
124.2
120.8
116.8
114.8
111
109
119.8
124
121.6
118
115.8
116
115.8
114.4
112
110.2
107.4
108.2
117.6
121.4
119.8
115.6
112.6
113.2
112.2
110.8
108
105.2
102.4
101
110.8
116.8
113.8
108
104.4
105.2
105.4
103.2
100.6
97.8
95.8
95
104.8
110.4
106.4
102.2
98.4
98.4
98.6
96.2
92.4
91.4
88.4
87.8
97.6
104.2
100.2
97
92.8
92
93.4
92
89.6
88.6
87.2
86.2
96.8
102
102.6
100.6
94.2
94.2
95.2
95
94
92.2
91
91.2
103.4
105
104.6
103.8
101.8
102.4
103.8
103.4
102
101.8
100.2
101.4
113.8
116
115.6
113
109.4
111
112.4
112.2
111
108.8
107.4
108.6
118.8
122.2
122.6
122.2
118.8
119
118.2
117.8
116.8
114.6
113.4
113.8
124.2
125.8
125.6
122.4
119
119.4
118.6
118
116
114.8
114.6
114.6
124
125.2
124
117.6
113.2
111.4
112.2
109.8
106.4
105.2
102.2
99.8
111
113
108.4
105.4
102
102.8
103.4
101.6
98.6
98
93.8
95.6
105.6
106.8
103.6
101.2
100.4
103.2
105.6
106.6
107.2
107.4
104.8
107.2
117.4
119.4
116.2
112.8
111.6


Summary of computational transaction
Raw Inputview raw input (R code)
Raw Outputview raw output of R engine
Computing time2 seconds
R Server'Gwilym Jenkins' @ 72.249.127.135

\begin{tabular}{lllllllll}
\hline
Summary of computational transaction \tabularnewline
Raw Input & view raw input (R code)  \tabularnewline
Raw Output & view raw output of R engine  \tabularnewline
Computing time & 2 seconds \tabularnewline
R Server & 'Gwilym Jenkins' @ 72.249.127.135 \tabularnewline
\hline
\end{tabular}
%Source: https://freestatistics.org/blog/index.php?pk=69812&T=0

[TABLE]
[ROW][C]Summary of computational transaction[/C][/ROW]
[ROW][C]Raw Input[/C][C]view raw input (R code) [/C][/ROW]
[ROW][C]Raw Output[/C][C]view raw output of R engine [/C][/ROW]
[ROW][C]Computing time[/C][C]2 seconds[/C][/ROW]
[ROW][C]R Server[/C][C]'Gwilym Jenkins' @ 72.249.127.135[/C][/ROW]
[/TABLE]
Source: https://freestatistics.org/blog/index.php?pk=69812&T=0

Globally Unique Identifier (entire table): ba.freestatistics.org/blog/index.php?pk=69812&T=0

As an alternative you can also use a QR Code:  

The GUIDs for individual cells are displayed in the table below:

Summary of computational transaction
Raw Inputview raw input (R code)
Raw Outputview raw output of R engine
Computing time2 seconds
R Server'Gwilym Jenkins' @ 72.249.127.135


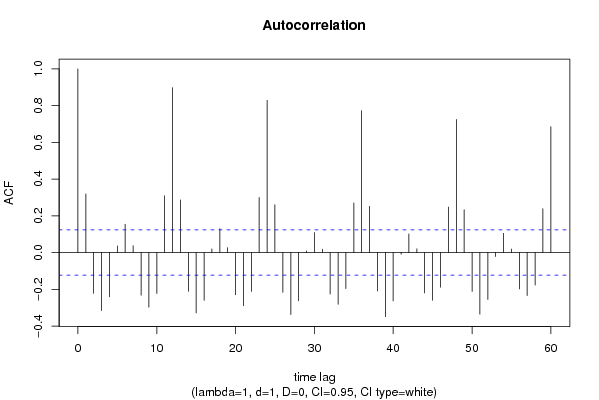
Autocorrelation Function
Time lag kACF(k)T-STATP-value
10.3190925.06540
2-0.22163-3.51830.000258
3-0.315653-5.01081e-06
4-0.241207-3.8298.1e-05
50.0363540.57710.282193
60.1543962.4510.007464
70.0374540.59460.276333
8-0.232087-3.68430.00014
9-0.297548-4.72342e-06
10-0.222888-3.53820.00024
110.3089654.90471e-06
120.89789214.25360
130.2866614.55064e-06
14-0.211213-3.35290.000461
15-0.328743-5.21860
16-0.259816-4.12452.5e-05
170.0195110.30970.378514
180.1300492.06450.019998
190.0267910.42530.335492
20-0.230358-3.65680.000155
21-0.290188-4.60663e-06
22-0.211556-3.35830.000453
230.300294.7672e-06
240.82935713.16560
250.2604624.13472.4e-05
26-0.21642-3.43560.000346
27-0.337967-5.36510
28-0.262709-4.17042.1e-05
290.008660.13750.445384
300.1091321.73240.042212
310.0181590.28830.38669
32-0.226334-3.59290.000197
33-0.281775-4.4736e-06
34-0.196251-3.11540.001025
350.2701564.28861.3e-05
360.77243112.2620
370.2519383.99944.2e-05
38-0.2088-3.31460.000526
39-0.349039-5.54080
40-0.26333-4.18022e-05
41-0.008981-0.14260.443374
420.1017751.61560.053714
430.0203560.32310.373427
44-0.219783-3.48890.000286
45-0.259891-4.12562.5e-05
46-0.18857-2.99350.001516
470.2476273.9315.5e-05
480.72501911.50930
490.2334013.70510.00013
50-0.211725-3.3610.000449
51-0.335444-5.3250
52-0.25535-4.05363.4e-05
53-0.02167-0.3440.365564
540.1046121.66070.049013
550.0190470.30240.38131
56-0.198215-3.14660.000925
57-0.234486-3.72230.000122
58-0.176964-2.80920.002678
590.2386593.78869.5e-05
600.68547710.88160

\begin{tabular}{lllllllll}
\hline
Autocorrelation Function \tabularnewline
Time lag k & ACF(k) & T-STAT & P-value \tabularnewline
1 & 0.319092 & 5.0654 & 0 \tabularnewline
2 & -0.22163 & -3.5183 & 0.000258 \tabularnewline
3 & -0.315653 & -5.0108 & 1e-06 \tabularnewline
4 & -0.241207 & -3.829 & 8.1e-05 \tabularnewline
5 & 0.036354 & 0.5771 & 0.282193 \tabularnewline
6 & 0.154396 & 2.451 & 0.007464 \tabularnewline
7 & 0.037454 & 0.5946 & 0.276333 \tabularnewline
8 & -0.232087 & -3.6843 & 0.00014 \tabularnewline
9 & -0.297548 & -4.7234 & 2e-06 \tabularnewline
10 & -0.222888 & -3.5382 & 0.00024 \tabularnewline
11 & 0.308965 & 4.9047 & 1e-06 \tabularnewline
12 & 0.897892 & 14.2536 & 0 \tabularnewline
13 & 0.286661 & 4.5506 & 4e-06 \tabularnewline
14 & -0.211213 & -3.3529 & 0.000461 \tabularnewline
15 & -0.328743 & -5.2186 & 0 \tabularnewline
16 & -0.259816 & -4.1245 & 2.5e-05 \tabularnewline
17 & 0.019511 & 0.3097 & 0.378514 \tabularnewline
18 & 0.130049 & 2.0645 & 0.019998 \tabularnewline
19 & 0.026791 & 0.4253 & 0.335492 \tabularnewline
20 & -0.230358 & -3.6568 & 0.000155 \tabularnewline
21 & -0.290188 & -4.6066 & 3e-06 \tabularnewline
22 & -0.211556 & -3.3583 & 0.000453 \tabularnewline
23 & 0.30029 & 4.767 & 2e-06 \tabularnewline
24 & 0.829357 & 13.1656 & 0 \tabularnewline
25 & 0.260462 & 4.1347 & 2.4e-05 \tabularnewline
26 & -0.21642 & -3.4356 & 0.000346 \tabularnewline
27 & -0.337967 & -5.3651 & 0 \tabularnewline
28 & -0.262709 & -4.1704 & 2.1e-05 \tabularnewline
29 & 0.00866 & 0.1375 & 0.445384 \tabularnewline
30 & 0.109132 & 1.7324 & 0.042212 \tabularnewline
31 & 0.018159 & 0.2883 & 0.38669 \tabularnewline
32 & -0.226334 & -3.5929 & 0.000197 \tabularnewline
33 & -0.281775 & -4.473 & 6e-06 \tabularnewline
34 & -0.196251 & -3.1154 & 0.001025 \tabularnewline
35 & 0.270156 & 4.2886 & 1.3e-05 \tabularnewline
36 & 0.772431 & 12.262 & 0 \tabularnewline
37 & 0.251938 & 3.9994 & 4.2e-05 \tabularnewline
38 & -0.2088 & -3.3146 & 0.000526 \tabularnewline
39 & -0.349039 & -5.5408 & 0 \tabularnewline
40 & -0.26333 & -4.1802 & 2e-05 \tabularnewline
41 & -0.008981 & -0.1426 & 0.443374 \tabularnewline
42 & 0.101775 & 1.6156 & 0.053714 \tabularnewline
43 & 0.020356 & 0.3231 & 0.373427 \tabularnewline
44 & -0.219783 & -3.4889 & 0.000286 \tabularnewline
45 & -0.259891 & -4.1256 & 2.5e-05 \tabularnewline
46 & -0.18857 & -2.9935 & 0.001516 \tabularnewline
47 & 0.247627 & 3.931 & 5.5e-05 \tabularnewline
48 & 0.725019 & 11.5093 & 0 \tabularnewline
49 & 0.233401 & 3.7051 & 0.00013 \tabularnewline
50 & -0.211725 & -3.361 & 0.000449 \tabularnewline
51 & -0.335444 & -5.325 & 0 \tabularnewline
52 & -0.25535 & -4.0536 & 3.4e-05 \tabularnewline
53 & -0.02167 & -0.344 & 0.365564 \tabularnewline
54 & 0.104612 & 1.6607 & 0.049013 \tabularnewline
55 & 0.019047 & 0.3024 & 0.38131 \tabularnewline
56 & -0.198215 & -3.1466 & 0.000925 \tabularnewline
57 & -0.234486 & -3.7223 & 0.000122 \tabularnewline
58 & -0.176964 & -2.8092 & 0.002678 \tabularnewline
59 & 0.238659 & 3.7886 & 9.5e-05 \tabularnewline
60 & 0.685477 & 10.8816 & 0 \tabularnewline
\hline
\end{tabular}
%Source: https://freestatistics.org/blog/index.php?pk=69812&T=1

[TABLE]
[ROW][C]Autocorrelation Function[/C][/ROW]
[ROW][C]Time lag k[/C][C]ACF(k)[/C][C]T-STAT[/C][C]P-value[/C][/ROW]
[ROW][C]1[/C][C]0.319092[/C][C]5.0654[/C][C]0[/C][/ROW]
[ROW][C]2[/C][C]-0.22163[/C][C]-3.5183[/C][C]0.000258[/C][/ROW]
[ROW][C]3[/C][C]-0.315653[/C][C]-5.0108[/C][C]1e-06[/C][/ROW]
[ROW][C]4[/C][C]-0.241207[/C][C]-3.829[/C][C]8.1e-05[/C][/ROW]
[ROW][C]5[/C][C]0.036354[/C][C]0.5771[/C][C]0.282193[/C][/ROW]
[ROW][C]6[/C][C]0.154396[/C][C]2.451[/C][C]0.007464[/C][/ROW]
[ROW][C]7[/C][C]0.037454[/C][C]0.5946[/C][C]0.276333[/C][/ROW]
[ROW][C]8[/C][C]-0.232087[/C][C]-3.6843[/C][C]0.00014[/C][/ROW]
[ROW][C]9[/C][C]-0.297548[/C][C]-4.7234[/C][C]2e-06[/C][/ROW]
[ROW][C]10[/C][C]-0.222888[/C][C]-3.5382[/C][C]0.00024[/C][/ROW]
[ROW][C]11[/C][C]0.308965[/C][C]4.9047[/C][C]1e-06[/C][/ROW]
[ROW][C]12[/C][C]0.897892[/C][C]14.2536[/C][C]0[/C][/ROW]
[ROW][C]13[/C][C]0.286661[/C][C]4.5506[/C][C]4e-06[/C][/ROW]
[ROW][C]14[/C][C]-0.211213[/C][C]-3.3529[/C][C]0.000461[/C][/ROW]
[ROW][C]15[/C][C]-0.328743[/C][C]-5.2186[/C][C]0[/C][/ROW]
[ROW][C]16[/C][C]-0.259816[/C][C]-4.1245[/C][C]2.5e-05[/C][/ROW]
[ROW][C]17[/C][C]0.019511[/C][C]0.3097[/C][C]0.378514[/C][/ROW]
[ROW][C]18[/C][C]0.130049[/C][C]2.0645[/C][C]0.019998[/C][/ROW]
[ROW][C]19[/C][C]0.026791[/C][C]0.4253[/C][C]0.335492[/C][/ROW]
[ROW][C]20[/C][C]-0.230358[/C][C]-3.6568[/C][C]0.000155[/C][/ROW]
[ROW][C]21[/C][C]-0.290188[/C][C]-4.6066[/C][C]3e-06[/C][/ROW]
[ROW][C]22[/C][C]-0.211556[/C][C]-3.3583[/C][C]0.000453[/C][/ROW]
[ROW][C]23[/C][C]0.30029[/C][C]4.767[/C][C]2e-06[/C][/ROW]
[ROW][C]24[/C][C]0.829357[/C][C]13.1656[/C][C]0[/C][/ROW]
[ROW][C]25[/C][C]0.260462[/C][C]4.1347[/C][C]2.4e-05[/C][/ROW]
[ROW][C]26[/C][C]-0.21642[/C][C]-3.4356[/C][C]0.000346[/C][/ROW]
[ROW][C]27[/C][C]-0.337967[/C][C]-5.3651[/C][C]0[/C][/ROW]
[ROW][C]28[/C][C]-0.262709[/C][C]-4.1704[/C][C]2.1e-05[/C][/ROW]
[ROW][C]29[/C][C]0.00866[/C][C]0.1375[/C][C]0.445384[/C][/ROW]
[ROW][C]30[/C][C]0.109132[/C][C]1.7324[/C][C]0.042212[/C][/ROW]
[ROW][C]31[/C][C]0.018159[/C][C]0.2883[/C][C]0.38669[/C][/ROW]
[ROW][C]32[/C][C]-0.226334[/C][C]-3.5929[/C][C]0.000197[/C][/ROW]
[ROW][C]33[/C][C]-0.281775[/C][C]-4.473[/C][C]6e-06[/C][/ROW]
[ROW][C]34[/C][C]-0.196251[/C][C]-3.1154[/C][C]0.001025[/C][/ROW]
[ROW][C]35[/C][C]0.270156[/C][C]4.2886[/C][C]1.3e-05[/C][/ROW]
[ROW][C]36[/C][C]0.772431[/C][C]12.262[/C][C]0[/C][/ROW]
[ROW][C]37[/C][C]0.251938[/C][C]3.9994[/C][C]4.2e-05[/C][/ROW]
[ROW][C]38[/C][C]-0.2088[/C][C]-3.3146[/C][C]0.000526[/C][/ROW]
[ROW][C]39[/C][C]-0.349039[/C][C]-5.5408[/C][C]0[/C][/ROW]
[ROW][C]40[/C][C]-0.26333[/C][C]-4.1802[/C][C]2e-05[/C][/ROW]
[ROW][C]41[/C][C]-0.008981[/C][C]-0.1426[/C][C]0.443374[/C][/ROW]
[ROW][C]42[/C][C]0.101775[/C][C]1.6156[/C][C]0.053714[/C][/ROW]
[ROW][C]43[/C][C]0.020356[/C][C]0.3231[/C][C]0.373427[/C][/ROW]
[ROW][C]44[/C][C]-0.219783[/C][C]-3.4889[/C][C]0.000286[/C][/ROW]
[ROW][C]45[/C][C]-0.259891[/C][C]-4.1256[/C][C]2.5e-05[/C][/ROW]
[ROW][C]46[/C][C]-0.18857[/C][C]-2.9935[/C][C]0.001516[/C][/ROW]
[ROW][C]47[/C][C]0.247627[/C][C]3.931[/C][C]5.5e-05[/C][/ROW]
[ROW][C]48[/C][C]0.725019[/C][C]11.5093[/C][C]0[/C][/ROW]
[ROW][C]49[/C][C]0.233401[/C][C]3.7051[/C][C]0.00013[/C][/ROW]
[ROW][C]50[/C][C]-0.211725[/C][C]-3.361[/C][C]0.000449[/C][/ROW]
[ROW][C]51[/C][C]-0.335444[/C][C]-5.325[/C][C]0[/C][/ROW]
[ROW][C]52[/C][C]-0.25535[/C][C]-4.0536[/C][C]3.4e-05[/C][/ROW]
[ROW][C]53[/C][C]-0.02167[/C][C]-0.344[/C][C]0.365564[/C][/ROW]
[ROW][C]54[/C][C]0.104612[/C][C]1.6607[/C][C]0.049013[/C][/ROW]
[ROW][C]55[/C][C]0.019047[/C][C]0.3024[/C][C]0.38131[/C][/ROW]
[ROW][C]56[/C][C]-0.198215[/C][C]-3.1466[/C][C]0.000925[/C][/ROW]
[ROW][C]57[/C][C]-0.234486[/C][C]-3.7223[/C][C]0.000122[/C][/ROW]
[ROW][C]58[/C][C]-0.176964[/C][C]-2.8092[/C][C]0.002678[/C][/ROW]
[ROW][C]59[/C][C]0.238659[/C][C]3.7886[/C][C]9.5e-05[/C][/ROW]
[ROW][C]60[/C][C]0.685477[/C][C]10.8816[/C][C]0[/C][/ROW]
[/TABLE]
Source: https://freestatistics.org/blog/index.php?pk=69812&T=1

Globally Unique Identifier (entire table): ba.freestatistics.org/blog/index.php?pk=69812&T=1

As an alternative you can also use a QR Code:  

The GUIDs for individual cells are displayed in the table below:

Autocorrelation Function
Time lag kACF(k)T-STATP-value
10.3190925.06540
2-0.22163-3.51830.000258
3-0.315653-5.01081e-06
4-0.241207-3.8298.1e-05
50.0363540.57710.282193
60.1543962.4510.007464
70.0374540.59460.276333
8-0.232087-3.68430.00014
9-0.297548-4.72342e-06
10-0.222888-3.53820.00024
110.3089654.90471e-06
120.89789214.25360
130.2866614.55064e-06
14-0.211213-3.35290.000461
15-0.328743-5.21860
16-0.259816-4.12452.5e-05
170.0195110.30970.378514
180.1300492.06450.019998
190.0267910.42530.335492
20-0.230358-3.65680.000155
21-0.290188-4.60663e-06
22-0.211556-3.35830.000453
230.300294.7672e-06
240.82935713.16560
250.2604624.13472.4e-05
26-0.21642-3.43560.000346
27-0.337967-5.36510
28-0.262709-4.17042.1e-05
290.008660.13750.445384
300.1091321.73240.042212
310.0181590.28830.38669
32-0.226334-3.59290.000197
33-0.281775-4.4736e-06
34-0.196251-3.11540.001025
350.2701564.28861.3e-05
360.77243112.2620
370.2519383.99944.2e-05
38-0.2088-3.31460.000526
39-0.349039-5.54080
40-0.26333-4.18022e-05
41-0.008981-0.14260.443374
420.1017751.61560.053714
430.0203560.32310.373427
44-0.219783-3.48890.000286
45-0.259891-4.12562.5e-05
46-0.18857-2.99350.001516
470.2476273.9315.5e-05
480.72501911.50930
490.2334013.70510.00013
50-0.211725-3.3610.000449
51-0.335444-5.3250
52-0.25535-4.05363.4e-05
53-0.02167-0.3440.365564
540.1046121.66070.049013
550.0190470.30240.38131
56-0.198215-3.14660.000925
57-0.234486-3.72230.000122
58-0.176964-2.80920.002678
590.2386593.78869.5e-05
600.68547710.88160


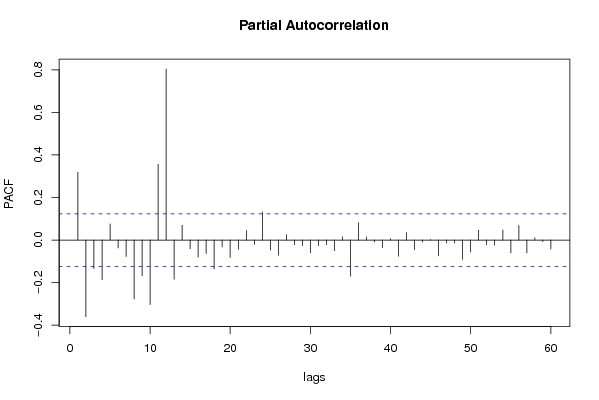
Partial Autocorrelation Function
Time lag kPACF(k)T-STATP-value
10.3190925.06540
2-0.360117-5.71670
3-0.133753-2.12330.017353
4-0.187157-2.9710.001627
50.0759551.20580.114522
6-0.036964-0.58680.278939
7-0.076762-1.21860.112077
8-0.277149-4.39968e-06
9-0.168193-2.670.004039
10-0.303558-4.81881e-06
110.3563865.65750
120.80453112.77150
13-0.183964-2.92030.001907
140.0693911.10150.135855
15-0.040271-0.63930.261611
16-0.079737-1.26580.103378
17-0.063714-1.01140.156392
18-0.136058-2.15990.015864
19-0.0321-0.50960.305398
20-0.081791-1.29840.097671
21-0.0433-0.68740.246242
220.0444250.70520.240658
23-0.02044-0.32450.372923
240.1322992.10020.018354
25-0.047548-0.75480.225535
26-0.070991-1.12690.13042
270.0257790.40920.341361
28-0.021705-0.34460.365355
29-0.026481-0.42040.337285
30-0.060243-0.95630.169913
31-0.026306-0.41760.338297
32-0.021568-0.34240.366173
33-0.050198-0.79690.213138
340.0149990.23810.405996
35-0.170177-2.70150.003686
360.0813431.29130.098896
370.0142030.22550.410901
38-0.009111-0.14460.442559
39-0.035604-0.56520.286222
400.006440.10220.459327
41-0.075837-1.20390.114883
420.0351030.55720.288926
43-0.044625-0.70840.239677
44-0.009623-0.15280.439357
450.001580.02510.490002
46-0.074174-1.17750.120057
47-0.013575-0.21550.41478
48-0.013263-0.21050.41671
49-0.091379-1.45060.074067
50-0.055713-0.88440.188656
510.0456580.72480.234624
52-0.02255-0.3580.360334
53-0.022737-0.36090.359221
540.0473420.75150.226519
55-0.059956-0.95180.171061
560.0683761.08540.139381
57-0.059819-0.94960.171613
580.0110810.17590.430256
59-0.00692-0.10990.456306
60-0.042302-0.67150.251251

\begin{tabular}{lllllllll}
\hline
Partial Autocorrelation Function \tabularnewline
Time lag k & PACF(k) & T-STAT & P-value \tabularnewline
1 & 0.319092 & 5.0654 & 0 \tabularnewline
2 & -0.360117 & -5.7167 & 0 \tabularnewline
3 & -0.133753 & -2.1233 & 0.017353 \tabularnewline
4 & -0.187157 & -2.971 & 0.001627 \tabularnewline
5 & 0.075955 & 1.2058 & 0.114522 \tabularnewline
6 & -0.036964 & -0.5868 & 0.278939 \tabularnewline
7 & -0.076762 & -1.2186 & 0.112077 \tabularnewline
8 & -0.277149 & -4.3996 & 8e-06 \tabularnewline
9 & -0.168193 & -2.67 & 0.004039 \tabularnewline
10 & -0.303558 & -4.8188 & 1e-06 \tabularnewline
11 & 0.356386 & 5.6575 & 0 \tabularnewline
12 & 0.804531 & 12.7715 & 0 \tabularnewline
13 & -0.183964 & -2.9203 & 0.001907 \tabularnewline
14 & 0.069391 & 1.1015 & 0.135855 \tabularnewline
15 & -0.040271 & -0.6393 & 0.261611 \tabularnewline
16 & -0.079737 & -1.2658 & 0.103378 \tabularnewline
17 & -0.063714 & -1.0114 & 0.156392 \tabularnewline
18 & -0.136058 & -2.1599 & 0.015864 \tabularnewline
19 & -0.0321 & -0.5096 & 0.305398 \tabularnewline
20 & -0.081791 & -1.2984 & 0.097671 \tabularnewline
21 & -0.0433 & -0.6874 & 0.246242 \tabularnewline
22 & 0.044425 & 0.7052 & 0.240658 \tabularnewline
23 & -0.02044 & -0.3245 & 0.372923 \tabularnewline
24 & 0.132299 & 2.1002 & 0.018354 \tabularnewline
25 & -0.047548 & -0.7548 & 0.225535 \tabularnewline
26 & -0.070991 & -1.1269 & 0.13042 \tabularnewline
27 & 0.025779 & 0.4092 & 0.341361 \tabularnewline
28 & -0.021705 & -0.3446 & 0.365355 \tabularnewline
29 & -0.026481 & -0.4204 & 0.337285 \tabularnewline
30 & -0.060243 & -0.9563 & 0.169913 \tabularnewline
31 & -0.026306 & -0.4176 & 0.338297 \tabularnewline
32 & -0.021568 & -0.3424 & 0.366173 \tabularnewline
33 & -0.050198 & -0.7969 & 0.213138 \tabularnewline
34 & 0.014999 & 0.2381 & 0.405996 \tabularnewline
35 & -0.170177 & -2.7015 & 0.003686 \tabularnewline
36 & 0.081343 & 1.2913 & 0.098896 \tabularnewline
37 & 0.014203 & 0.2255 & 0.410901 \tabularnewline
38 & -0.009111 & -0.1446 & 0.442559 \tabularnewline
39 & -0.035604 & -0.5652 & 0.286222 \tabularnewline
40 & 0.00644 & 0.1022 & 0.459327 \tabularnewline
41 & -0.075837 & -1.2039 & 0.114883 \tabularnewline
42 & 0.035103 & 0.5572 & 0.288926 \tabularnewline
43 & -0.044625 & -0.7084 & 0.239677 \tabularnewline
44 & -0.009623 & -0.1528 & 0.439357 \tabularnewline
45 & 0.00158 & 0.0251 & 0.490002 \tabularnewline
46 & -0.074174 & -1.1775 & 0.120057 \tabularnewline
47 & -0.013575 & -0.2155 & 0.41478 \tabularnewline
48 & -0.013263 & -0.2105 & 0.41671 \tabularnewline
49 & -0.091379 & -1.4506 & 0.074067 \tabularnewline
50 & -0.055713 & -0.8844 & 0.188656 \tabularnewline
51 & 0.045658 & 0.7248 & 0.234624 \tabularnewline
52 & -0.02255 & -0.358 & 0.360334 \tabularnewline
53 & -0.022737 & -0.3609 & 0.359221 \tabularnewline
54 & 0.047342 & 0.7515 & 0.226519 \tabularnewline
55 & -0.059956 & -0.9518 & 0.171061 \tabularnewline
56 & 0.068376 & 1.0854 & 0.139381 \tabularnewline
57 & -0.059819 & -0.9496 & 0.171613 \tabularnewline
58 & 0.011081 & 0.1759 & 0.430256 \tabularnewline
59 & -0.00692 & -0.1099 & 0.456306 \tabularnewline
60 & -0.042302 & -0.6715 & 0.251251 \tabularnewline
\hline
\end{tabular}
%Source: https://freestatistics.org/blog/index.php?pk=69812&T=2

[TABLE]
[ROW][C]Partial Autocorrelation Function[/C][/ROW]
[ROW][C]Time lag k[/C][C]PACF(k)[/C][C]T-STAT[/C][C]P-value[/C][/ROW]
[ROW][C]1[/C][C]0.319092[/C][C]5.0654[/C][C]0[/C][/ROW]
[ROW][C]2[/C][C]-0.360117[/C][C]-5.7167[/C][C]0[/C][/ROW]
[ROW][C]3[/C][C]-0.133753[/C][C]-2.1233[/C][C]0.017353[/C][/ROW]
[ROW][C]4[/C][C]-0.187157[/C][C]-2.971[/C][C]0.001627[/C][/ROW]
[ROW][C]5[/C][C]0.075955[/C][C]1.2058[/C][C]0.114522[/C][/ROW]
[ROW][C]6[/C][C]-0.036964[/C][C]-0.5868[/C][C]0.278939[/C][/ROW]
[ROW][C]7[/C][C]-0.076762[/C][C]-1.2186[/C][C]0.112077[/C][/ROW]
[ROW][C]8[/C][C]-0.277149[/C][C]-4.3996[/C][C]8e-06[/C][/ROW]
[ROW][C]9[/C][C]-0.168193[/C][C]-2.67[/C][C]0.004039[/C][/ROW]
[ROW][C]10[/C][C]-0.303558[/C][C]-4.8188[/C][C]1e-06[/C][/ROW]
[ROW][C]11[/C][C]0.356386[/C][C]5.6575[/C][C]0[/C][/ROW]
[ROW][C]12[/C][C]0.804531[/C][C]12.7715[/C][C]0[/C][/ROW]
[ROW][C]13[/C][C]-0.183964[/C][C]-2.9203[/C][C]0.001907[/C][/ROW]
[ROW][C]14[/C][C]0.069391[/C][C]1.1015[/C][C]0.135855[/C][/ROW]
[ROW][C]15[/C][C]-0.040271[/C][C]-0.6393[/C][C]0.261611[/C][/ROW]
[ROW][C]16[/C][C]-0.079737[/C][C]-1.2658[/C][C]0.103378[/C][/ROW]
[ROW][C]17[/C][C]-0.063714[/C][C]-1.0114[/C][C]0.156392[/C][/ROW]
[ROW][C]18[/C][C]-0.136058[/C][C]-2.1599[/C][C]0.015864[/C][/ROW]
[ROW][C]19[/C][C]-0.0321[/C][C]-0.5096[/C][C]0.305398[/C][/ROW]
[ROW][C]20[/C][C]-0.081791[/C][C]-1.2984[/C][C]0.097671[/C][/ROW]
[ROW][C]21[/C][C]-0.0433[/C][C]-0.6874[/C][C]0.246242[/C][/ROW]
[ROW][C]22[/C][C]0.044425[/C][C]0.7052[/C][C]0.240658[/C][/ROW]
[ROW][C]23[/C][C]-0.02044[/C][C]-0.3245[/C][C]0.372923[/C][/ROW]
[ROW][C]24[/C][C]0.132299[/C][C]2.1002[/C][C]0.018354[/C][/ROW]
[ROW][C]25[/C][C]-0.047548[/C][C]-0.7548[/C][C]0.225535[/C][/ROW]
[ROW][C]26[/C][C]-0.070991[/C][C]-1.1269[/C][C]0.13042[/C][/ROW]
[ROW][C]27[/C][C]0.025779[/C][C]0.4092[/C][C]0.341361[/C][/ROW]
[ROW][C]28[/C][C]-0.021705[/C][C]-0.3446[/C][C]0.365355[/C][/ROW]
[ROW][C]29[/C][C]-0.026481[/C][C]-0.4204[/C][C]0.337285[/C][/ROW]
[ROW][C]30[/C][C]-0.060243[/C][C]-0.9563[/C][C]0.169913[/C][/ROW]
[ROW][C]31[/C][C]-0.026306[/C][C]-0.4176[/C][C]0.338297[/C][/ROW]
[ROW][C]32[/C][C]-0.021568[/C][C]-0.3424[/C][C]0.366173[/C][/ROW]
[ROW][C]33[/C][C]-0.050198[/C][C]-0.7969[/C][C]0.213138[/C][/ROW]
[ROW][C]34[/C][C]0.014999[/C][C]0.2381[/C][C]0.405996[/C][/ROW]
[ROW][C]35[/C][C]-0.170177[/C][C]-2.7015[/C][C]0.003686[/C][/ROW]
[ROW][C]36[/C][C]0.081343[/C][C]1.2913[/C][C]0.098896[/C][/ROW]
[ROW][C]37[/C][C]0.014203[/C][C]0.2255[/C][C]0.410901[/C][/ROW]
[ROW][C]38[/C][C]-0.009111[/C][C]-0.1446[/C][C]0.442559[/C][/ROW]
[ROW][C]39[/C][C]-0.035604[/C][C]-0.5652[/C][C]0.286222[/C][/ROW]
[ROW][C]40[/C][C]0.00644[/C][C]0.1022[/C][C]0.459327[/C][/ROW]
[ROW][C]41[/C][C]-0.075837[/C][C]-1.2039[/C][C]0.114883[/C][/ROW]
[ROW][C]42[/C][C]0.035103[/C][C]0.5572[/C][C]0.288926[/C][/ROW]
[ROW][C]43[/C][C]-0.044625[/C][C]-0.7084[/C][C]0.239677[/C][/ROW]
[ROW][C]44[/C][C]-0.009623[/C][C]-0.1528[/C][C]0.439357[/C][/ROW]
[ROW][C]45[/C][C]0.00158[/C][C]0.0251[/C][C]0.490002[/C][/ROW]
[ROW][C]46[/C][C]-0.074174[/C][C]-1.1775[/C][C]0.120057[/C][/ROW]
[ROW][C]47[/C][C]-0.013575[/C][C]-0.2155[/C][C]0.41478[/C][/ROW]
[ROW][C]48[/C][C]-0.013263[/C][C]-0.2105[/C][C]0.41671[/C][/ROW]
[ROW][C]49[/C][C]-0.091379[/C][C]-1.4506[/C][C]0.074067[/C][/ROW]
[ROW][C]50[/C][C]-0.055713[/C][C]-0.8844[/C][C]0.188656[/C][/ROW]
[ROW][C]51[/C][C]0.045658[/C][C]0.7248[/C][C]0.234624[/C][/ROW]
[ROW][C]52[/C][C]-0.02255[/C][C]-0.358[/C][C]0.360334[/C][/ROW]
[ROW][C]53[/C][C]-0.022737[/C][C]-0.3609[/C][C]0.359221[/C][/ROW]
[ROW][C]54[/C][C]0.047342[/C][C]0.7515[/C][C]0.226519[/C][/ROW]
[ROW][C]55[/C][C]-0.059956[/C][C]-0.9518[/C][C]0.171061[/C][/ROW]
[ROW][C]56[/C][C]0.068376[/C][C]1.0854[/C][C]0.139381[/C][/ROW]
[ROW][C]57[/C][C]-0.059819[/C][C]-0.9496[/C][C]0.171613[/C][/ROW]
[ROW][C]58[/C][C]0.011081[/C][C]0.1759[/C][C]0.430256[/C][/ROW]
[ROW][C]59[/C][C]-0.00692[/C][C]-0.1099[/C][C]0.456306[/C][/ROW]
[ROW][C]60[/C][C]-0.042302[/C][C]-0.6715[/C][C]0.251251[/C][/ROW]
[/TABLE]
Source: https://freestatistics.org/blog/index.php?pk=69812&T=2

Globally Unique Identifier (entire table): ba.freestatistics.org/blog/index.php?pk=69812&T=2

As an alternative you can also use a QR Code:  

The GUIDs for individual cells are displayed in the table below:

Partial Autocorrelation Function
Time lag kPACF(k)T-STATP-value
10.3190925.06540
2-0.360117-5.71670
3-0.133753-2.12330.017353
4-0.187157-2.9710.001627
50.0759551.20580.114522
6-0.036964-0.58680.278939
7-0.076762-1.21860.112077
8-0.277149-4.39968e-06
9-0.168193-2.670.004039
10-0.303558-4.81881e-06
110.3563865.65750
120.80453112.77150
13-0.183964-2.92030.001907
140.0693911.10150.135855
15-0.040271-0.63930.261611
16-0.079737-1.26580.103378
17-0.063714-1.01140.156392
18-0.136058-2.15990.015864
19-0.0321-0.50960.305398
20-0.081791-1.29840.097671
21-0.0433-0.68740.246242
220.0444250.70520.240658
23-0.02044-0.32450.372923
240.1322992.10020.018354
25-0.047548-0.75480.225535
26-0.070991-1.12690.13042
270.0257790.40920.341361
28-0.021705-0.34460.365355
29-0.026481-0.42040.337285
30-0.060243-0.95630.169913
31-0.026306-0.41760.338297
32-0.021568-0.34240.366173
33-0.050198-0.79690.213138
340.0149990.23810.405996
35-0.170177-2.70150.003686
360.0813431.29130.098896
370.0142030.22550.410901
38-0.009111-0.14460.442559
39-0.035604-0.56520.286222
400.006440.10220.459327
41-0.075837-1.20390.114883
420.0351030.55720.288926
43-0.044625-0.70840.239677
44-0.009623-0.15280.439357
450.001580.02510.490002
46-0.074174-1.17750.120057
47-0.013575-0.21550.41478
48-0.013263-0.21050.41671
49-0.091379-1.45060.074067
50-0.055713-0.88440.188656
510.0456580.72480.234624
52-0.02255-0.3580.360334
53-0.022737-0.36090.359221
540.0473420.75150.226519
55-0.059956-0.95180.171061
560.0683761.08540.139381
57-0.059819-0.94960.171613
580.0110810.17590.430256
59-0.00692-0.10990.456306
60-0.042302-0.67150.251251


Parameters (Session):
par1 = 60 ; par2 = 1 ; par3 = 1 ; par4 = 0 ; par5 = 12 ; par6 = White Noise ; par7 = 0.95 ;
Parameters (R input):
par1 = 60 ; par2 = 1 ; par3 = 1 ; par4 = 0 ; par5 = 12 ; par6 = White Noise ; par7 = 0.95 ;
R code (references can be found in the software module):
if (par1 == 'Default') {
par1 = 10*log10(length(x))
} else {
par1 <- as.numeric(par1)
}
par2 <- as.numeric(par2)
par3 <- as.numeric(par3)
par4 <- as.numeric(par4)
par5 <- as.numeric(par5)
if (par6 == 'White Noise') par6 <- 'white' else par6 <- 'ma'
par7 <- as.numeric(par7)
if (par2 == 0) {
x <- log(x)
} else {
x <- (x ^ par2 - 1) / par2
}
if (par3 > 0) x <- diff(x,lag=1,difference=par3)
if (par4 > 0) x <- diff(x,lag=par5,difference=par4)
bitmap(file='pic1.png')
racf <- acf(x, par1, main='Autocorrelation', xlab='time lag', ylab='ACF', ci.type=par6, ci=par7, sub=paste('(lambda=',par2,', d=',par3,', D=',par4,', CI=', par7, ', CI type=',par6,')',sep=''))
dev.off()
bitmap(file='pic2.png')
rpacf <- pacf(x,par1,main='Partial Autocorrelation',xlab='lags',ylab='PACF')
dev.off()
(myacf <- c(racf$acf))
(mypacf <- c(rpacf$acf))
lengthx <- length(x)
sqrtn <- sqrt(lengthx)
load(file='createtable')
a<-table.start()
a<-table.row.start(a)
a<-table.element(a,'Autocorrelation Function',4,TRUE)
a<-table.row.end(a)
a<-table.row.start(a)
a<-table.element(a,'Time lag k',header=TRUE)
a<-table.element(a,hyperlink('basics.htm','ACF(k)','click here for more information about the Autocorrelation Function'),header=TRUE)
a<-table.element(a,'T-STAT',header=TRUE)
a<-table.element(a,'P-value',header=TRUE)
a<-table.row.end(a)
for (i in 2:(par1+1)) {
a<-table.row.start(a)
a<-table.element(a,i-1,header=TRUE)
a<-table.element(a,round(myacf[i],6))
mytstat <- myacf[i]*sqrtn
a<-table.element(a,round(mytstat,4))
a<-table.element(a,round(1-pt(abs(mytstat),lengthx),6))
a<-table.row.end(a)
}
a<-table.end(a)
table.save(a,file='mytable.tab')
a<-table.start()
a<-table.row.start(a)
a<-table.element(a,'Partial Autocorrelation Function',4,TRUE)
a<-table.row.end(a)
a<-table.row.start(a)
a<-table.element(a,'Time lag k',header=TRUE)
a<-table.element(a,hyperlink('basics.htm','PACF(k)','click here for more information about the Partial Autocorrelation Function'),header=TRUE)
a<-table.element(a,'T-STAT',header=TRUE)
a<-table.element(a,'P-value',header=TRUE)
a<-table.row.end(a)
for (i in 1:par1) {
a<-table.row.start(a)
a<-table.element(a,i,header=TRUE)
a<-table.element(a,round(mypacf[i],6))
mytstat <- mypacf[i]*sqrtn
a<-table.element(a,round(mytstat,4))
a<-table.element(a,round(1-pt(abs(mytstat),lengthx),6))
a<-table.row.end(a)
}
a<-table.end(a)
table.save(a,file='mytable1.tab')