Free Statistics

of Irreproducible Research!

Author's title

Author*The author of this computation has been verified*
R Software Modulerwasp_autocorrelation.wasp
Title produced by software(Partial) Autocorrelation Function
Date of computationSun, 20 Dec 2009 03:17:27 -0700
Cite this page as followsStatistical Computations at FreeStatistics.org, Office for Research Development and Education, URL https://freestatistics.org/blog/index.php?v=date/2009/Dec/20/t1261304380qjf8vn4k5o6yaki.htm/, Retrieved Sat, 27 Apr 2024 09:33:33 +0000
Statistical Computations at FreeStatistics.org, Office for Research Development and Education, URL https://freestatistics.org/blog/index.php?pk=69816, Retrieved Sat, 27 Apr 2024 09:33:33 +0000
QR Codes:

Original text written by user:
IsPrivate?No (this computation is public)
User-defined keywords
Estimated Impact126
Family? (F = Feedback message, R = changed R code, M = changed R Module, P = changed Parameters, D = changed Data)
-     [(Partial) Autocorrelation Function] [Paper: Differenti...] [2009-12-20 09:54:01] [1d635fe1113b56bab3f378c464a289bc]
-   P     [(Partial) Autocorrelation Function] [Paper: Differenti...] [2009-12-20 10:17:27] [762da55b2e2304daaed24a7cc507d14d] [Current]
Feedback Forum

Post a new message
Dataseries X:
90.2
90
88.8
85.8
84.2
80
77.8
76.8
86.4
89.2
86.2
84.6
83.2
83.2
82.6
79.8
77.2
74.8
73
73
83.6
85.6
84.8
84.2
83.4
84.6
84.6
83.8
81.2
79.6
78
78.2
88.8
92
91
91.2
90.4
91.8
92.2
90.2
88.6
87.8
86
87.2
97.6
101.2
100.4
100.2
100.2
103
104.2
104
102.4
101.8
101
102.2
114
118.4
118.8
117.2
117.2
118.4
118.8
117.2
114.4
112.6
111
110.8
120.2
124.4
123.4
121.2
119
119.8
120
118.4
115
113.4
111
111
121.6
126.2
125.8
124.8
122
123.2
124.2
120.8
116.8
114.8
111
109
119.8
124
121.6
118
115.8
116
115.8
114.4
112
110.2
107.4
108.2
117.6
121.4
119.8
115.6
112.6
113.2
112.2
110.8
108
105.2
102.4
101
110.8
116.8
113.8
108
104.4
105.2
105.4
103.2
100.6
97.8
95.8
95
104.8
110.4
106.4
102.2
98.4
98.4
98.6
96.2
92.4
91.4
88.4
87.8
97.6
104.2
100.2
97
92.8
92
93.4
92
89.6
88.6
87.2
86.2
96.8
102
102.6
100.6
94.2
94.2
95.2
95
94
92.2
91
91.2
103.4
105
104.6
103.8
101.8
102.4
103.8
103.4
102
101.8
100.2
101.4
113.8
116
115.6
113
109.4
111
112.4
112.2
111
108.8
107.4
108.6
118.8
122.2
122.6
122.2
118.8
119
118.2
117.8
116.8
114.6
113.4
113.8
124.2
125.8
125.6
122.4
119
119.4
118.6
118
116
114.8
114.6
114.6
124
125.2
124
117.6
113.2
111.4
112.2
109.8
106.4
105.2
102.2
99.8
111
113
108.4
105.4
102
102.8
103.4
101.6
98.6
98
93.8
95.6
105.6
106.8
103.6
101.2
100.4
103.2
105.6
106.6
107.2
107.4
104.8
107.2
117.4
119.4
116.2
112.8
111.6


Summary of computational transaction
Raw Inputview raw input (R code)
Raw Outputview raw output of R engine
Computing time2 seconds
R Server'Gwilym Jenkins' @ 72.249.127.135

\begin{tabular}{lllllllll}
\hline
Summary of computational transaction \tabularnewline
Raw Input & view raw input (R code)  \tabularnewline
Raw Output & view raw output of R engine  \tabularnewline
Computing time & 2 seconds \tabularnewline
R Server & 'Gwilym Jenkins' @ 72.249.127.135 \tabularnewline
\hline
\end{tabular}
%Source: https://freestatistics.org/blog/index.php?pk=69816&T=0

[TABLE]
[ROW][C]Summary of computational transaction[/C][/ROW]
[ROW][C]Raw Input[/C][C]view raw input (R code) [/C][/ROW]
[ROW][C]Raw Output[/C][C]view raw output of R engine [/C][/ROW]
[ROW][C]Computing time[/C][C]2 seconds[/C][/ROW]
[ROW][C]R Server[/C][C]'Gwilym Jenkins' @ 72.249.127.135[/C][/ROW]
[/TABLE]
Source: https://freestatistics.org/blog/index.php?pk=69816&T=0

Globally Unique Identifier (entire table): ba.freestatistics.org/blog/index.php?pk=69816&T=0

As an alternative you can also use a QR Code:  

The GUIDs for individual cells are displayed in the table below:

Summary of computational transaction
Raw Inputview raw input (R code)
Raw Outputview raw output of R engine
Computing time2 seconds
R Server'Gwilym Jenkins' @ 72.249.127.135


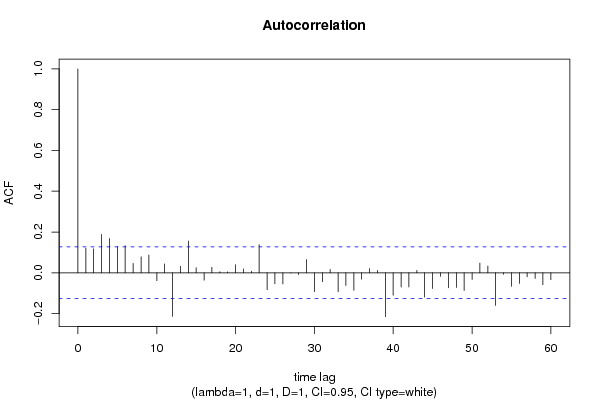
Autocorrelation Function
Time lag kACF(k)T-STATP-value
10.1205681.86780.031502
20.1177731.82450.034657
30.1879922.91240.001963
40.1677342.59850.004971
50.1287341.99430.023623
60.1328682.05840.020317
70.0456340.7070.240139
80.0782441.21210.113324
90.0868651.34570.089833
10-0.038604-0.59810.275185
110.043210.66940.251939
12-0.214195-3.31830.000523
130.0316890.49090.311962
140.1556572.41140.008321
150.0251560.38970.348544
16-0.036595-0.56690.285649
170.0265520.41130.340592
180.0054930.08510.466125
190.0044260.06860.472695
200.0395230.61230.270462
210.0189180.29310.384858
220.0078580.12170.451603
230.1378072.13490.016891
24-0.08305-1.28660.099735
25-0.053934-0.83550.202121
26-0.054605-0.84590.199214
27-0.001027-0.01590.493661
28-0.008833-0.13680.445639
290.0648231.00420.158138
30-0.092786-1.43740.075949
31-0.043915-0.68030.248475
320.0165610.25660.398868
33-0.093474-1.44810.074448
34-0.062164-0.9630.168247
35-0.086324-1.33730.091192
36-0.031579-0.48920.312569
370.0208860.32360.373274
380.0116340.18020.428563
39-0.215258-3.33480.000494
40-0.110148-1.70640.044613
41-0.07028-1.08880.138673
42-0.069797-1.08130.140326
430.0115910.17960.428824
44-0.119383-1.84950.03281
45-0.077277-1.19720.11621
46-0.017935-0.27780.390687
47-0.073704-1.14180.127333
48-0.071844-1.1130.133409
49-0.086945-1.34690.089634
50-0.032796-0.50810.305932
510.0479450.74280.229178
520.0329740.51080.304968
53-0.160406-2.4850.006819
54-0.007559-0.11710.453437
55-0.066483-1.02990.152036
56-0.052047-0.80630.210433
57-0.019767-0.30620.37985
58-0.027712-0.42930.334039
59-0.0586-0.90780.182442
60-0.034134-0.52880.298714

\begin{tabular}{lllllllll}
\hline
Autocorrelation Function \tabularnewline
Time lag k & ACF(k) & T-STAT & P-value \tabularnewline
1 & 0.120568 & 1.8678 & 0.031502 \tabularnewline
2 & 0.117773 & 1.8245 & 0.034657 \tabularnewline
3 & 0.187992 & 2.9124 & 0.001963 \tabularnewline
4 & 0.167734 & 2.5985 & 0.004971 \tabularnewline
5 & 0.128734 & 1.9943 & 0.023623 \tabularnewline
6 & 0.132868 & 2.0584 & 0.020317 \tabularnewline
7 & 0.045634 & 0.707 & 0.240139 \tabularnewline
8 & 0.078244 & 1.2121 & 0.113324 \tabularnewline
9 & 0.086865 & 1.3457 & 0.089833 \tabularnewline
10 & -0.038604 & -0.5981 & 0.275185 \tabularnewline
11 & 0.04321 & 0.6694 & 0.251939 \tabularnewline
12 & -0.214195 & -3.3183 & 0.000523 \tabularnewline
13 & 0.031689 & 0.4909 & 0.311962 \tabularnewline
14 & 0.155657 & 2.4114 & 0.008321 \tabularnewline
15 & 0.025156 & 0.3897 & 0.348544 \tabularnewline
16 & -0.036595 & -0.5669 & 0.285649 \tabularnewline
17 & 0.026552 & 0.4113 & 0.340592 \tabularnewline
18 & 0.005493 & 0.0851 & 0.466125 \tabularnewline
19 & 0.004426 & 0.0686 & 0.472695 \tabularnewline
20 & 0.039523 & 0.6123 & 0.270462 \tabularnewline
21 & 0.018918 & 0.2931 & 0.384858 \tabularnewline
22 & 0.007858 & 0.1217 & 0.451603 \tabularnewline
23 & 0.137807 & 2.1349 & 0.016891 \tabularnewline
24 & -0.08305 & -1.2866 & 0.099735 \tabularnewline
25 & -0.053934 & -0.8355 & 0.202121 \tabularnewline
26 & -0.054605 & -0.8459 & 0.199214 \tabularnewline
27 & -0.001027 & -0.0159 & 0.493661 \tabularnewline
28 & -0.008833 & -0.1368 & 0.445639 \tabularnewline
29 & 0.064823 & 1.0042 & 0.158138 \tabularnewline
30 & -0.092786 & -1.4374 & 0.075949 \tabularnewline
31 & -0.043915 & -0.6803 & 0.248475 \tabularnewline
32 & 0.016561 & 0.2566 & 0.398868 \tabularnewline
33 & -0.093474 & -1.4481 & 0.074448 \tabularnewline
34 & -0.062164 & -0.963 & 0.168247 \tabularnewline
35 & -0.086324 & -1.3373 & 0.091192 \tabularnewline
36 & -0.031579 & -0.4892 & 0.312569 \tabularnewline
37 & 0.020886 & 0.3236 & 0.373274 \tabularnewline
38 & 0.011634 & 0.1802 & 0.428563 \tabularnewline
39 & -0.215258 & -3.3348 & 0.000494 \tabularnewline
40 & -0.110148 & -1.7064 & 0.044613 \tabularnewline
41 & -0.07028 & -1.0888 & 0.138673 \tabularnewline
42 & -0.069797 & -1.0813 & 0.140326 \tabularnewline
43 & 0.011591 & 0.1796 & 0.428824 \tabularnewline
44 & -0.119383 & -1.8495 & 0.03281 \tabularnewline
45 & -0.077277 & -1.1972 & 0.11621 \tabularnewline
46 & -0.017935 & -0.2778 & 0.390687 \tabularnewline
47 & -0.073704 & -1.1418 & 0.127333 \tabularnewline
48 & -0.071844 & -1.113 & 0.133409 \tabularnewline
49 & -0.086945 & -1.3469 & 0.089634 \tabularnewline
50 & -0.032796 & -0.5081 & 0.305932 \tabularnewline
51 & 0.047945 & 0.7428 & 0.229178 \tabularnewline
52 & 0.032974 & 0.5108 & 0.304968 \tabularnewline
53 & -0.160406 & -2.485 & 0.006819 \tabularnewline
54 & -0.007559 & -0.1171 & 0.453437 \tabularnewline
55 & -0.066483 & -1.0299 & 0.152036 \tabularnewline
56 & -0.052047 & -0.8063 & 0.210433 \tabularnewline
57 & -0.019767 & -0.3062 & 0.37985 \tabularnewline
58 & -0.027712 & -0.4293 & 0.334039 \tabularnewline
59 & -0.0586 & -0.9078 & 0.182442 \tabularnewline
60 & -0.034134 & -0.5288 & 0.298714 \tabularnewline
\hline
\end{tabular}
%Source: https://freestatistics.org/blog/index.php?pk=69816&T=1

[TABLE]
[ROW][C]Autocorrelation Function[/C][/ROW]
[ROW][C]Time lag k[/C][C]ACF(k)[/C][C]T-STAT[/C][C]P-value[/C][/ROW]
[ROW][C]1[/C][C]0.120568[/C][C]1.8678[/C][C]0.031502[/C][/ROW]
[ROW][C]2[/C][C]0.117773[/C][C]1.8245[/C][C]0.034657[/C][/ROW]
[ROW][C]3[/C][C]0.187992[/C][C]2.9124[/C][C]0.001963[/C][/ROW]
[ROW][C]4[/C][C]0.167734[/C][C]2.5985[/C][C]0.004971[/C][/ROW]
[ROW][C]5[/C][C]0.128734[/C][C]1.9943[/C][C]0.023623[/C][/ROW]
[ROW][C]6[/C][C]0.132868[/C][C]2.0584[/C][C]0.020317[/C][/ROW]
[ROW][C]7[/C][C]0.045634[/C][C]0.707[/C][C]0.240139[/C][/ROW]
[ROW][C]8[/C][C]0.078244[/C][C]1.2121[/C][C]0.113324[/C][/ROW]
[ROW][C]9[/C][C]0.086865[/C][C]1.3457[/C][C]0.089833[/C][/ROW]
[ROW][C]10[/C][C]-0.038604[/C][C]-0.5981[/C][C]0.275185[/C][/ROW]
[ROW][C]11[/C][C]0.04321[/C][C]0.6694[/C][C]0.251939[/C][/ROW]
[ROW][C]12[/C][C]-0.214195[/C][C]-3.3183[/C][C]0.000523[/C][/ROW]
[ROW][C]13[/C][C]0.031689[/C][C]0.4909[/C][C]0.311962[/C][/ROW]
[ROW][C]14[/C][C]0.155657[/C][C]2.4114[/C][C]0.008321[/C][/ROW]
[ROW][C]15[/C][C]0.025156[/C][C]0.3897[/C][C]0.348544[/C][/ROW]
[ROW][C]16[/C][C]-0.036595[/C][C]-0.5669[/C][C]0.285649[/C][/ROW]
[ROW][C]17[/C][C]0.026552[/C][C]0.4113[/C][C]0.340592[/C][/ROW]
[ROW][C]18[/C][C]0.005493[/C][C]0.0851[/C][C]0.466125[/C][/ROW]
[ROW][C]19[/C][C]0.004426[/C][C]0.0686[/C][C]0.472695[/C][/ROW]
[ROW][C]20[/C][C]0.039523[/C][C]0.6123[/C][C]0.270462[/C][/ROW]
[ROW][C]21[/C][C]0.018918[/C][C]0.2931[/C][C]0.384858[/C][/ROW]
[ROW][C]22[/C][C]0.007858[/C][C]0.1217[/C][C]0.451603[/C][/ROW]
[ROW][C]23[/C][C]0.137807[/C][C]2.1349[/C][C]0.016891[/C][/ROW]
[ROW][C]24[/C][C]-0.08305[/C][C]-1.2866[/C][C]0.099735[/C][/ROW]
[ROW][C]25[/C][C]-0.053934[/C][C]-0.8355[/C][C]0.202121[/C][/ROW]
[ROW][C]26[/C][C]-0.054605[/C][C]-0.8459[/C][C]0.199214[/C][/ROW]
[ROW][C]27[/C][C]-0.001027[/C][C]-0.0159[/C][C]0.493661[/C][/ROW]
[ROW][C]28[/C][C]-0.008833[/C][C]-0.1368[/C][C]0.445639[/C][/ROW]
[ROW][C]29[/C][C]0.064823[/C][C]1.0042[/C][C]0.158138[/C][/ROW]
[ROW][C]30[/C][C]-0.092786[/C][C]-1.4374[/C][C]0.075949[/C][/ROW]
[ROW][C]31[/C][C]-0.043915[/C][C]-0.6803[/C][C]0.248475[/C][/ROW]
[ROW][C]32[/C][C]0.016561[/C][C]0.2566[/C][C]0.398868[/C][/ROW]
[ROW][C]33[/C][C]-0.093474[/C][C]-1.4481[/C][C]0.074448[/C][/ROW]
[ROW][C]34[/C][C]-0.062164[/C][C]-0.963[/C][C]0.168247[/C][/ROW]
[ROW][C]35[/C][C]-0.086324[/C][C]-1.3373[/C][C]0.091192[/C][/ROW]
[ROW][C]36[/C][C]-0.031579[/C][C]-0.4892[/C][C]0.312569[/C][/ROW]
[ROW][C]37[/C][C]0.020886[/C][C]0.3236[/C][C]0.373274[/C][/ROW]
[ROW][C]38[/C][C]0.011634[/C][C]0.1802[/C][C]0.428563[/C][/ROW]
[ROW][C]39[/C][C]-0.215258[/C][C]-3.3348[/C][C]0.000494[/C][/ROW]
[ROW][C]40[/C][C]-0.110148[/C][C]-1.7064[/C][C]0.044613[/C][/ROW]
[ROW][C]41[/C][C]-0.07028[/C][C]-1.0888[/C][C]0.138673[/C][/ROW]
[ROW][C]42[/C][C]-0.069797[/C][C]-1.0813[/C][C]0.140326[/C][/ROW]
[ROW][C]43[/C][C]0.011591[/C][C]0.1796[/C][C]0.428824[/C][/ROW]
[ROW][C]44[/C][C]-0.119383[/C][C]-1.8495[/C][C]0.03281[/C][/ROW]
[ROW][C]45[/C][C]-0.077277[/C][C]-1.1972[/C][C]0.11621[/C][/ROW]
[ROW][C]46[/C][C]-0.017935[/C][C]-0.2778[/C][C]0.390687[/C][/ROW]
[ROW][C]47[/C][C]-0.073704[/C][C]-1.1418[/C][C]0.127333[/C][/ROW]
[ROW][C]48[/C][C]-0.071844[/C][C]-1.113[/C][C]0.133409[/C][/ROW]
[ROW][C]49[/C][C]-0.086945[/C][C]-1.3469[/C][C]0.089634[/C][/ROW]
[ROW][C]50[/C][C]-0.032796[/C][C]-0.5081[/C][C]0.305932[/C][/ROW]
[ROW][C]51[/C][C]0.047945[/C][C]0.7428[/C][C]0.229178[/C][/ROW]
[ROW][C]52[/C][C]0.032974[/C][C]0.5108[/C][C]0.304968[/C][/ROW]
[ROW][C]53[/C][C]-0.160406[/C][C]-2.485[/C][C]0.006819[/C][/ROW]
[ROW][C]54[/C][C]-0.007559[/C][C]-0.1171[/C][C]0.453437[/C][/ROW]
[ROW][C]55[/C][C]-0.066483[/C][C]-1.0299[/C][C]0.152036[/C][/ROW]
[ROW][C]56[/C][C]-0.052047[/C][C]-0.8063[/C][C]0.210433[/C][/ROW]
[ROW][C]57[/C][C]-0.019767[/C][C]-0.3062[/C][C]0.37985[/C][/ROW]
[ROW][C]58[/C][C]-0.027712[/C][C]-0.4293[/C][C]0.334039[/C][/ROW]
[ROW][C]59[/C][C]-0.0586[/C][C]-0.9078[/C][C]0.182442[/C][/ROW]
[ROW][C]60[/C][C]-0.034134[/C][C]-0.5288[/C][C]0.298714[/C][/ROW]
[/TABLE]
Source: https://freestatistics.org/blog/index.php?pk=69816&T=1

Globally Unique Identifier (entire table): ba.freestatistics.org/blog/index.php?pk=69816&T=1

As an alternative you can also use a QR Code:  

The GUIDs for individual cells are displayed in the table below:

Autocorrelation Function
Time lag kACF(k)T-STATP-value
10.1205681.86780.031502
20.1177731.82450.034657
30.1879922.91240.001963
40.1677342.59850.004971
50.1287341.99430.023623
60.1328682.05840.020317
70.0456340.7070.240139
80.0782441.21210.113324
90.0868651.34570.089833
10-0.038604-0.59810.275185
110.043210.66940.251939
12-0.214195-3.31830.000523
130.0316890.49090.311962
140.1556572.41140.008321
150.0251560.38970.348544
16-0.036595-0.56690.285649
170.0265520.41130.340592
180.0054930.08510.466125
190.0044260.06860.472695
200.0395230.61230.270462
210.0189180.29310.384858
220.0078580.12170.451603
230.1378072.13490.016891
24-0.08305-1.28660.099735
25-0.053934-0.83550.202121
26-0.054605-0.84590.199214
27-0.001027-0.01590.493661
28-0.008833-0.13680.445639
290.0648231.00420.158138
30-0.092786-1.43740.075949
31-0.043915-0.68030.248475
320.0165610.25660.398868
33-0.093474-1.44810.074448
34-0.062164-0.9630.168247
35-0.086324-1.33730.091192
36-0.031579-0.48920.312569
370.0208860.32360.373274
380.0116340.18020.428563
39-0.215258-3.33480.000494
40-0.110148-1.70640.044613
41-0.07028-1.08880.138673
42-0.069797-1.08130.140326
430.0115910.17960.428824
44-0.119383-1.84950.03281
45-0.077277-1.19720.11621
46-0.017935-0.27780.390687
47-0.073704-1.14180.127333
48-0.071844-1.1130.133409
49-0.086945-1.34690.089634
50-0.032796-0.50810.305932
510.0479450.74280.229178
520.0329740.51080.304968
53-0.160406-2.4850.006819
54-0.007559-0.11710.453437
55-0.066483-1.02990.152036
56-0.052047-0.80630.210433
57-0.019767-0.30620.37985
58-0.027712-0.42930.334039
59-0.0586-0.90780.182442
60-0.034134-0.52880.298714


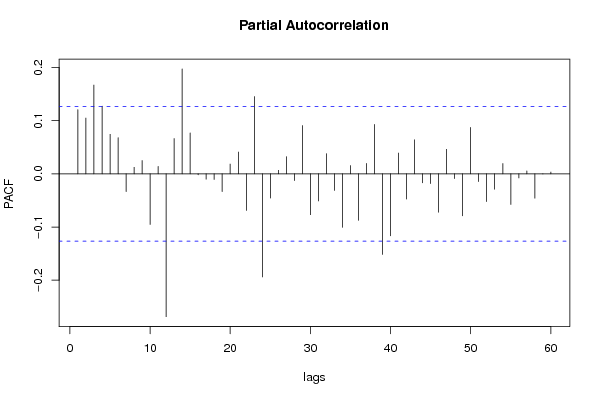
Partial Autocorrelation Function
Time lag kPACF(k)T-STATP-value
10.1205681.86780.031502
20.104761.62290.052959
30.166882.58530.00516
40.1270621.96840.025085
50.07431.1510.12543
60.0678841.05170.147008
7-0.033389-0.51730.302724
80.0121350.1880.42552
90.024990.38710.349497
10-0.095117-1.47350.070957
110.0139620.21630.414468
12-0.268435-4.15862.2e-05
130.0661451.02470.153265
140.1970843.05320.00126
150.0767911.18960.117683
16-0.00184-0.02850.488642
17-0.010121-0.15680.437769
18-0.010496-0.16260.435483
19-0.033369-0.5170.302833
200.0184240.28540.387786
210.0409820.63490.263052
22-0.068839-1.06650.143645
230.1452382.250.012677
24-0.193881-3.00360.001475
25-0.045639-0.7070.240116
260.0064810.10040.460056
270.0322820.50010.308726
28-0.012578-0.19490.422833
290.0906861.40490.080673
30-0.076928-1.19180.117265
31-0.051078-0.79130.214777
320.0378580.58650.279045
33-0.031334-0.48540.313912
34-0.100572-1.5580.06027
350.0154620.23950.405445
36-0.087292-1.35230.088773
370.0194190.30080.381897
380.0927671.43710.075991
39-0.151437-2.34610.009894
40-0.116601-1.80640.036056
410.03910.60570.272631
42-0.047486-0.73560.231332
430.063970.9910.161336
44-0.016921-0.26210.396722
45-0.018232-0.28240.388924
46-0.072216-1.11880.132181
470.0461260.71460.237782
48-0.008928-0.13830.445056
49-0.078935-1.22280.111293
500.0872061.3510.088986
51-0.014517-0.22490.411123
52-0.052162-0.80810.209921
53-0.028779-0.44580.328058
540.01920.29740.383191
55-0.057465-0.89020.187114
56-0.007702-0.11930.452561
570.0055220.08550.46595
58-0.045857-0.71040.239069
59-0.000195-0.0030.498798
600.0031830.04930.480354

\begin{tabular}{lllllllll}
\hline
Partial Autocorrelation Function \tabularnewline
Time lag k & PACF(k) & T-STAT & P-value \tabularnewline
1 & 0.120568 & 1.8678 & 0.031502 \tabularnewline
2 & 0.10476 & 1.6229 & 0.052959 \tabularnewline
3 & 0.16688 & 2.5853 & 0.00516 \tabularnewline
4 & 0.127062 & 1.9684 & 0.025085 \tabularnewline
5 & 0.0743 & 1.151 & 0.12543 \tabularnewline
6 & 0.067884 & 1.0517 & 0.147008 \tabularnewline
7 & -0.033389 & -0.5173 & 0.302724 \tabularnewline
8 & 0.012135 & 0.188 & 0.42552 \tabularnewline
9 & 0.02499 & 0.3871 & 0.349497 \tabularnewline
10 & -0.095117 & -1.4735 & 0.070957 \tabularnewline
11 & 0.013962 & 0.2163 & 0.414468 \tabularnewline
12 & -0.268435 & -4.1586 & 2.2e-05 \tabularnewline
13 & 0.066145 & 1.0247 & 0.153265 \tabularnewline
14 & 0.197084 & 3.0532 & 0.00126 \tabularnewline
15 & 0.076791 & 1.1896 & 0.117683 \tabularnewline
16 & -0.00184 & -0.0285 & 0.488642 \tabularnewline
17 & -0.010121 & -0.1568 & 0.437769 \tabularnewline
18 & -0.010496 & -0.1626 & 0.435483 \tabularnewline
19 & -0.033369 & -0.517 & 0.302833 \tabularnewline
20 & 0.018424 & 0.2854 & 0.387786 \tabularnewline
21 & 0.040982 & 0.6349 & 0.263052 \tabularnewline
22 & -0.068839 & -1.0665 & 0.143645 \tabularnewline
23 & 0.145238 & 2.25 & 0.012677 \tabularnewline
24 & -0.193881 & -3.0036 & 0.001475 \tabularnewline
25 & -0.045639 & -0.707 & 0.240116 \tabularnewline
26 & 0.006481 & 0.1004 & 0.460056 \tabularnewline
27 & 0.032282 & 0.5001 & 0.308726 \tabularnewline
28 & -0.012578 & -0.1949 & 0.422833 \tabularnewline
29 & 0.090686 & 1.4049 & 0.080673 \tabularnewline
30 & -0.076928 & -1.1918 & 0.117265 \tabularnewline
31 & -0.051078 & -0.7913 & 0.214777 \tabularnewline
32 & 0.037858 & 0.5865 & 0.279045 \tabularnewline
33 & -0.031334 & -0.4854 & 0.313912 \tabularnewline
34 & -0.100572 & -1.558 & 0.06027 \tabularnewline
35 & 0.015462 & 0.2395 & 0.405445 \tabularnewline
36 & -0.087292 & -1.3523 & 0.088773 \tabularnewline
37 & 0.019419 & 0.3008 & 0.381897 \tabularnewline
38 & 0.092767 & 1.4371 & 0.075991 \tabularnewline
39 & -0.151437 & -2.3461 & 0.009894 \tabularnewline
40 & -0.116601 & -1.8064 & 0.036056 \tabularnewline
41 & 0.0391 & 0.6057 & 0.272631 \tabularnewline
42 & -0.047486 & -0.7356 & 0.231332 \tabularnewline
43 & 0.06397 & 0.991 & 0.161336 \tabularnewline
44 & -0.016921 & -0.2621 & 0.396722 \tabularnewline
45 & -0.018232 & -0.2824 & 0.388924 \tabularnewline
46 & -0.072216 & -1.1188 & 0.132181 \tabularnewline
47 & 0.046126 & 0.7146 & 0.237782 \tabularnewline
48 & -0.008928 & -0.1383 & 0.445056 \tabularnewline
49 & -0.078935 & -1.2228 & 0.111293 \tabularnewline
50 & 0.087206 & 1.351 & 0.088986 \tabularnewline
51 & -0.014517 & -0.2249 & 0.411123 \tabularnewline
52 & -0.052162 & -0.8081 & 0.209921 \tabularnewline
53 & -0.028779 & -0.4458 & 0.328058 \tabularnewline
54 & 0.0192 & 0.2974 & 0.383191 \tabularnewline
55 & -0.057465 & -0.8902 & 0.187114 \tabularnewline
56 & -0.007702 & -0.1193 & 0.452561 \tabularnewline
57 & 0.005522 & 0.0855 & 0.46595 \tabularnewline
58 & -0.045857 & -0.7104 & 0.239069 \tabularnewline
59 & -0.000195 & -0.003 & 0.498798 \tabularnewline
60 & 0.003183 & 0.0493 & 0.480354 \tabularnewline
\hline
\end{tabular}
%Source: https://freestatistics.org/blog/index.php?pk=69816&T=2

[TABLE]
[ROW][C]Partial Autocorrelation Function[/C][/ROW]
[ROW][C]Time lag k[/C][C]PACF(k)[/C][C]T-STAT[/C][C]P-value[/C][/ROW]
[ROW][C]1[/C][C]0.120568[/C][C]1.8678[/C][C]0.031502[/C][/ROW]
[ROW][C]2[/C][C]0.10476[/C][C]1.6229[/C][C]0.052959[/C][/ROW]
[ROW][C]3[/C][C]0.16688[/C][C]2.5853[/C][C]0.00516[/C][/ROW]
[ROW][C]4[/C][C]0.127062[/C][C]1.9684[/C][C]0.025085[/C][/ROW]
[ROW][C]5[/C][C]0.0743[/C][C]1.151[/C][C]0.12543[/C][/ROW]
[ROW][C]6[/C][C]0.067884[/C][C]1.0517[/C][C]0.147008[/C][/ROW]
[ROW][C]7[/C][C]-0.033389[/C][C]-0.5173[/C][C]0.302724[/C][/ROW]
[ROW][C]8[/C][C]0.012135[/C][C]0.188[/C][C]0.42552[/C][/ROW]
[ROW][C]9[/C][C]0.02499[/C][C]0.3871[/C][C]0.349497[/C][/ROW]
[ROW][C]10[/C][C]-0.095117[/C][C]-1.4735[/C][C]0.070957[/C][/ROW]
[ROW][C]11[/C][C]0.013962[/C][C]0.2163[/C][C]0.414468[/C][/ROW]
[ROW][C]12[/C][C]-0.268435[/C][C]-4.1586[/C][C]2.2e-05[/C][/ROW]
[ROW][C]13[/C][C]0.066145[/C][C]1.0247[/C][C]0.153265[/C][/ROW]
[ROW][C]14[/C][C]0.197084[/C][C]3.0532[/C][C]0.00126[/C][/ROW]
[ROW][C]15[/C][C]0.076791[/C][C]1.1896[/C][C]0.117683[/C][/ROW]
[ROW][C]16[/C][C]-0.00184[/C][C]-0.0285[/C][C]0.488642[/C][/ROW]
[ROW][C]17[/C][C]-0.010121[/C][C]-0.1568[/C][C]0.437769[/C][/ROW]
[ROW][C]18[/C][C]-0.010496[/C][C]-0.1626[/C][C]0.435483[/C][/ROW]
[ROW][C]19[/C][C]-0.033369[/C][C]-0.517[/C][C]0.302833[/C][/ROW]
[ROW][C]20[/C][C]0.018424[/C][C]0.2854[/C][C]0.387786[/C][/ROW]
[ROW][C]21[/C][C]0.040982[/C][C]0.6349[/C][C]0.263052[/C][/ROW]
[ROW][C]22[/C][C]-0.068839[/C][C]-1.0665[/C][C]0.143645[/C][/ROW]
[ROW][C]23[/C][C]0.145238[/C][C]2.25[/C][C]0.012677[/C][/ROW]
[ROW][C]24[/C][C]-0.193881[/C][C]-3.0036[/C][C]0.001475[/C][/ROW]
[ROW][C]25[/C][C]-0.045639[/C][C]-0.707[/C][C]0.240116[/C][/ROW]
[ROW][C]26[/C][C]0.006481[/C][C]0.1004[/C][C]0.460056[/C][/ROW]
[ROW][C]27[/C][C]0.032282[/C][C]0.5001[/C][C]0.308726[/C][/ROW]
[ROW][C]28[/C][C]-0.012578[/C][C]-0.1949[/C][C]0.422833[/C][/ROW]
[ROW][C]29[/C][C]0.090686[/C][C]1.4049[/C][C]0.080673[/C][/ROW]
[ROW][C]30[/C][C]-0.076928[/C][C]-1.1918[/C][C]0.117265[/C][/ROW]
[ROW][C]31[/C][C]-0.051078[/C][C]-0.7913[/C][C]0.214777[/C][/ROW]
[ROW][C]32[/C][C]0.037858[/C][C]0.5865[/C][C]0.279045[/C][/ROW]
[ROW][C]33[/C][C]-0.031334[/C][C]-0.4854[/C][C]0.313912[/C][/ROW]
[ROW][C]34[/C][C]-0.100572[/C][C]-1.558[/C][C]0.06027[/C][/ROW]
[ROW][C]35[/C][C]0.015462[/C][C]0.2395[/C][C]0.405445[/C][/ROW]
[ROW][C]36[/C][C]-0.087292[/C][C]-1.3523[/C][C]0.088773[/C][/ROW]
[ROW][C]37[/C][C]0.019419[/C][C]0.3008[/C][C]0.381897[/C][/ROW]
[ROW][C]38[/C][C]0.092767[/C][C]1.4371[/C][C]0.075991[/C][/ROW]
[ROW][C]39[/C][C]-0.151437[/C][C]-2.3461[/C][C]0.009894[/C][/ROW]
[ROW][C]40[/C][C]-0.116601[/C][C]-1.8064[/C][C]0.036056[/C][/ROW]
[ROW][C]41[/C][C]0.0391[/C][C]0.6057[/C][C]0.272631[/C][/ROW]
[ROW][C]42[/C][C]-0.047486[/C][C]-0.7356[/C][C]0.231332[/C][/ROW]
[ROW][C]43[/C][C]0.06397[/C][C]0.991[/C][C]0.161336[/C][/ROW]
[ROW][C]44[/C][C]-0.016921[/C][C]-0.2621[/C][C]0.396722[/C][/ROW]
[ROW][C]45[/C][C]-0.018232[/C][C]-0.2824[/C][C]0.388924[/C][/ROW]
[ROW][C]46[/C][C]-0.072216[/C][C]-1.1188[/C][C]0.132181[/C][/ROW]
[ROW][C]47[/C][C]0.046126[/C][C]0.7146[/C][C]0.237782[/C][/ROW]
[ROW][C]48[/C][C]-0.008928[/C][C]-0.1383[/C][C]0.445056[/C][/ROW]
[ROW][C]49[/C][C]-0.078935[/C][C]-1.2228[/C][C]0.111293[/C][/ROW]
[ROW][C]50[/C][C]0.087206[/C][C]1.351[/C][C]0.088986[/C][/ROW]
[ROW][C]51[/C][C]-0.014517[/C][C]-0.2249[/C][C]0.411123[/C][/ROW]
[ROW][C]52[/C][C]-0.052162[/C][C]-0.8081[/C][C]0.209921[/C][/ROW]
[ROW][C]53[/C][C]-0.028779[/C][C]-0.4458[/C][C]0.328058[/C][/ROW]
[ROW][C]54[/C][C]0.0192[/C][C]0.2974[/C][C]0.383191[/C][/ROW]
[ROW][C]55[/C][C]-0.057465[/C][C]-0.8902[/C][C]0.187114[/C][/ROW]
[ROW][C]56[/C][C]-0.007702[/C][C]-0.1193[/C][C]0.452561[/C][/ROW]
[ROW][C]57[/C][C]0.005522[/C][C]0.0855[/C][C]0.46595[/C][/ROW]
[ROW][C]58[/C][C]-0.045857[/C][C]-0.7104[/C][C]0.239069[/C][/ROW]
[ROW][C]59[/C][C]-0.000195[/C][C]-0.003[/C][C]0.498798[/C][/ROW]
[ROW][C]60[/C][C]0.003183[/C][C]0.0493[/C][C]0.480354[/C][/ROW]
[/TABLE]
Source: https://freestatistics.org/blog/index.php?pk=69816&T=2

Globally Unique Identifier (entire table): ba.freestatistics.org/blog/index.php?pk=69816&T=2

As an alternative you can also use a QR Code:  

The GUIDs for individual cells are displayed in the table below:

Partial Autocorrelation Function
Time lag kPACF(k)T-STATP-value
10.1205681.86780.031502
20.104761.62290.052959
30.166882.58530.00516
40.1270621.96840.025085
50.07431.1510.12543
60.0678841.05170.147008
7-0.033389-0.51730.302724
80.0121350.1880.42552
90.024990.38710.349497
10-0.095117-1.47350.070957
110.0139620.21630.414468
12-0.268435-4.15862.2e-05
130.0661451.02470.153265
140.1970843.05320.00126
150.0767911.18960.117683
16-0.00184-0.02850.488642
17-0.010121-0.15680.437769
18-0.010496-0.16260.435483
19-0.033369-0.5170.302833
200.0184240.28540.387786
210.0409820.63490.263052
22-0.068839-1.06650.143645
230.1452382.250.012677
24-0.193881-3.00360.001475
25-0.045639-0.7070.240116
260.0064810.10040.460056
270.0322820.50010.308726
28-0.012578-0.19490.422833
290.0906861.40490.080673
30-0.076928-1.19180.117265
31-0.051078-0.79130.214777
320.0378580.58650.279045
33-0.031334-0.48540.313912
34-0.100572-1.5580.06027
350.0154620.23950.405445
36-0.087292-1.35230.088773
370.0194190.30080.381897
380.0927671.43710.075991
39-0.151437-2.34610.009894
40-0.116601-1.80640.036056
410.03910.60570.272631
42-0.047486-0.73560.231332
430.063970.9910.161336
44-0.016921-0.26210.396722
45-0.018232-0.28240.388924
46-0.072216-1.11880.132181
470.0461260.71460.237782
48-0.008928-0.13830.445056
49-0.078935-1.22280.111293
500.0872061.3510.088986
51-0.014517-0.22490.411123
52-0.052162-0.80810.209921
53-0.028779-0.44580.328058
540.01920.29740.383191
55-0.057465-0.89020.187114
56-0.007702-0.11930.452561
570.0055220.08550.46595
58-0.045857-0.71040.239069
59-0.000195-0.0030.498798
600.0031830.04930.480354


Parameters (Session):
par1 = 60 ; par2 = 1 ; par3 = 1 ; par4 = 1 ; par5 = 12 ; par6 = White Noise ; par7 = 0.95 ;
Parameters (R input):
par1 = 60 ; par2 = 1 ; par3 = 1 ; par4 = 1 ; par5 = 12 ; par6 = White Noise ; par7 = 0.95 ;
R code (references can be found in the software module):
if (par1 == 'Default') {
par1 = 10*log10(length(x))
} else {
par1 <- as.numeric(par1)
}
par2 <- as.numeric(par2)
par3 <- as.numeric(par3)
par4 <- as.numeric(par4)
par5 <- as.numeric(par5)
if (par6 == 'White Noise') par6 <- 'white' else par6 <- 'ma'
par7 <- as.numeric(par7)
if (par2 == 0) {
x <- log(x)
} else {
x <- (x ^ par2 - 1) / par2
}
if (par3 > 0) x <- diff(x,lag=1,difference=par3)
if (par4 > 0) x <- diff(x,lag=par5,difference=par4)
bitmap(file='pic1.png')
racf <- acf(x, par1, main='Autocorrelation', xlab='time lag', ylab='ACF', ci.type=par6, ci=par7, sub=paste('(lambda=',par2,', d=',par3,', D=',par4,', CI=', par7, ', CI type=',par6,')',sep=''))
dev.off()
bitmap(file='pic2.png')
rpacf <- pacf(x,par1,main='Partial Autocorrelation',xlab='lags',ylab='PACF')
dev.off()
(myacf <- c(racf$acf))
(mypacf <- c(rpacf$acf))
lengthx <- length(x)
sqrtn <- sqrt(lengthx)
load(file='createtable')
a<-table.start()
a<-table.row.start(a)
a<-table.element(a,'Autocorrelation Function',4,TRUE)
a<-table.row.end(a)
a<-table.row.start(a)
a<-table.element(a,'Time lag k',header=TRUE)
a<-table.element(a,hyperlink('basics.htm','ACF(k)','click here for more information about the Autocorrelation Function'),header=TRUE)
a<-table.element(a,'T-STAT',header=TRUE)
a<-table.element(a,'P-value',header=TRUE)
a<-table.row.end(a)
for (i in 2:(par1+1)) {
a<-table.row.start(a)
a<-table.element(a,i-1,header=TRUE)
a<-table.element(a,round(myacf[i],6))
mytstat <- myacf[i]*sqrtn
a<-table.element(a,round(mytstat,4))
a<-table.element(a,round(1-pt(abs(mytstat),lengthx),6))
a<-table.row.end(a)
}
a<-table.end(a)
table.save(a,file='mytable.tab')
a<-table.start()
a<-table.row.start(a)
a<-table.element(a,'Partial Autocorrelation Function',4,TRUE)
a<-table.row.end(a)
a<-table.row.start(a)
a<-table.element(a,'Time lag k',header=TRUE)
a<-table.element(a,hyperlink('basics.htm','PACF(k)','click here for more information about the Partial Autocorrelation Function'),header=TRUE)
a<-table.element(a,'T-STAT',header=TRUE)
a<-table.element(a,'P-value',header=TRUE)
a<-table.row.end(a)
for (i in 1:par1) {
a<-table.row.start(a)
a<-table.element(a,i,header=TRUE)
a<-table.element(a,round(mypacf[i],6))
mytstat <- mypacf[i]*sqrtn
a<-table.element(a,round(mytstat,4))
a<-table.element(a,round(1-pt(abs(mytstat),lengthx),6))
a<-table.row.end(a)
}
a<-table.end(a)
table.save(a,file='mytable1.tab')