Free Statistics

of Irreproducible Research!

Author's title

Author*The author of this computation has been verified*
R Software Modulerwasp_autocorrelation.wasp
Title produced by software(Partial) Autocorrelation Function
Date of computationSun, 20 Dec 2009 06:46:27 -0700
Cite this page as followsStatistical Computations at FreeStatistics.org, Office for Research Development and Education, URL https://freestatistics.org/blog/index.php?v=date/2009/Dec/20/t12613169184ekh3o6kvs1g6zh.htm/, Retrieved Sat, 27 Apr 2024 05:29:26 +0000
Statistical Computations at FreeStatistics.org, Office for Research Development and Education, URL https://freestatistics.org/blog/index.php?pk=69882, Retrieved Sat, 27 Apr 2024 05:29:26 +0000
QR Codes:

Original text written by user:
IsPrivate?No (this computation is public)
User-defined keywords
Estimated Impact128
Family? (F = Feedback message, R = changed R code, M = changed R Module, P = changed Parameters, D = changed Data)
-       [(Partial) Autocorrelation Function] [ACF 1] [2009-12-20 13:46:27] [e458b4e05bf28a297f8af8d9f96e59d6] [Current]
Feedback Forum

Post a new message
Dataseries X:
210
220
212
191
180
195
136
196
182
166
147
125
164
170
171
140
155
156
141
167
171
206
187
124
163
154
226
125
162
145
98
128
159
209
150
125
214
193
140
205
192
192
186
150
246
282
264
336
301
376
416
344
326
351
249
258
311
343
278


Summary of computational transaction
Raw Inputview raw input (R code)
Raw Outputview raw output of R engine
Computing time2 seconds
R Server'Gwilym Jenkins' @ 72.249.127.135

\begin{tabular}{lllllllll}
\hline
Summary of computational transaction \tabularnewline
Raw Input & view raw input (R code)  \tabularnewline
Raw Output & view raw output of R engine  \tabularnewline
Computing time & 2 seconds \tabularnewline
R Server & 'Gwilym Jenkins' @ 72.249.127.135 \tabularnewline
\hline
\end{tabular}
%Source: https://freestatistics.org/blog/index.php?pk=69882&T=0

[TABLE]
[ROW][C]Summary of computational transaction[/C][/ROW]
[ROW][C]Raw Input[/C][C]view raw input (R code) [/C][/ROW]
[ROW][C]Raw Output[/C][C]view raw output of R engine [/C][/ROW]
[ROW][C]Computing time[/C][C]2 seconds[/C][/ROW]
[ROW][C]R Server[/C][C]'Gwilym Jenkins' @ 72.249.127.135[/C][/ROW]
[/TABLE]
Source: https://freestatistics.org/blog/index.php?pk=69882&T=0

Globally Unique Identifier (entire table): ba.freestatistics.org/blog/index.php?pk=69882&T=0

As an alternative you can also use a QR Code:  

The GUIDs for individual cells are displayed in the table below:

Summary of computational transaction
Raw Inputview raw input (R code)
Raw Outputview raw output of R engine
Computing time2 seconds
R Server'Gwilym Jenkins' @ 72.249.127.135


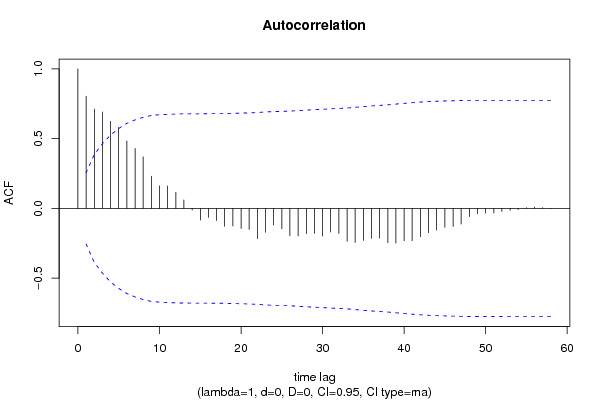
Autocorrelation Function
Time lag kACF(k)T-STATP-value
10.8047186.18120
20.7121945.47050
30.6905535.30421e-06
40.6245724.79746e-06
50.580774.4611.9e-05
60.4827163.70780.000232
70.4298423.30170.000818
80.3703362.84460.003052
90.2309361.77390.040624
100.1621721.24570.108906
110.1600551.22940.1119
120.1152850.88550.189735
130.0612810.47070.319793
14-0.012012-0.09230.463399
15-0.083341-0.64020.262276
16-0.064834-0.4980.310167
17-0.087305-0.67060.252546
18-0.127878-0.98220.164994
19-0.125104-0.96090.170251
20-0.143269-1.10050.137799
21-0.150952-1.15950.125464
22-0.215724-1.6570.051414
23-0.170666-1.31090.097484
24-0.117956-0.9060.184301
25-0.146016-1.12160.133294
26-0.196396-1.50850.068376
27-0.197221-1.51490.067571
28-0.180473-1.38620.085445
29-0.178139-1.36830.088201
30-0.197799-1.51930.067011
31-0.168522-1.29440.100278
32-0.179212-1.37660.086926
33-0.235356-1.80780.037867
34-0.243386-1.86950.03326
35-0.229759-1.76480.041386
36-0.213872-1.64280.052874
37-0.212644-1.63340.053861
38-0.24583-1.88830.031956
39-0.248495-1.90870.030583
40-0.232103-1.78280.03988
41-0.231105-1.77520.040515
42-0.202287-1.55380.06279
43-0.174792-1.34260.092272
44-0.154588-1.18740.119911
45-0.135436-1.04030.151222
46-0.128809-0.98940.163253
47-0.112299-0.86260.19593
48-0.058084-0.44620.328561
49-0.038226-0.29360.385039
50-0.033207-0.25510.39978
51-0.032163-0.2470.402864
52-0.022425-0.17220.431916
53-0.013203-0.10140.459784
54-0.006863-0.05270.479068
550.0055960.0430.482929
560.0099240.07620.469747
570.0056680.04350.48271
580.0011350.00870.496536
59NANANA
60NANANA

\begin{tabular}{lllllllll}
\hline
Autocorrelation Function \tabularnewline
Time lag k & ACF(k) & T-STAT & P-value \tabularnewline
1 & 0.804718 & 6.1812 & 0 \tabularnewline
2 & 0.712194 & 5.4705 & 0 \tabularnewline
3 & 0.690553 & 5.3042 & 1e-06 \tabularnewline
4 & 0.624572 & 4.7974 & 6e-06 \tabularnewline
5 & 0.58077 & 4.461 & 1.9e-05 \tabularnewline
6 & 0.482716 & 3.7078 & 0.000232 \tabularnewline
7 & 0.429842 & 3.3017 & 0.000818 \tabularnewline
8 & 0.370336 & 2.8446 & 0.003052 \tabularnewline
9 & 0.230936 & 1.7739 & 0.040624 \tabularnewline
10 & 0.162172 & 1.2457 & 0.108906 \tabularnewline
11 & 0.160055 & 1.2294 & 0.1119 \tabularnewline
12 & 0.115285 & 0.8855 & 0.189735 \tabularnewline
13 & 0.061281 & 0.4707 & 0.319793 \tabularnewline
14 & -0.012012 & -0.0923 & 0.463399 \tabularnewline
15 & -0.083341 & -0.6402 & 0.262276 \tabularnewline
16 & -0.064834 & -0.498 & 0.310167 \tabularnewline
17 & -0.087305 & -0.6706 & 0.252546 \tabularnewline
18 & -0.127878 & -0.9822 & 0.164994 \tabularnewline
19 & -0.125104 & -0.9609 & 0.170251 \tabularnewline
20 & -0.143269 & -1.1005 & 0.137799 \tabularnewline
21 & -0.150952 & -1.1595 & 0.125464 \tabularnewline
22 & -0.215724 & -1.657 & 0.051414 \tabularnewline
23 & -0.170666 & -1.3109 & 0.097484 \tabularnewline
24 & -0.117956 & -0.906 & 0.184301 \tabularnewline
25 & -0.146016 & -1.1216 & 0.133294 \tabularnewline
26 & -0.196396 & -1.5085 & 0.068376 \tabularnewline
27 & -0.197221 & -1.5149 & 0.067571 \tabularnewline
28 & -0.180473 & -1.3862 & 0.085445 \tabularnewline
29 & -0.178139 & -1.3683 & 0.088201 \tabularnewline
30 & -0.197799 & -1.5193 & 0.067011 \tabularnewline
31 & -0.168522 & -1.2944 & 0.100278 \tabularnewline
32 & -0.179212 & -1.3766 & 0.086926 \tabularnewline
33 & -0.235356 & -1.8078 & 0.037867 \tabularnewline
34 & -0.243386 & -1.8695 & 0.03326 \tabularnewline
35 & -0.229759 & -1.7648 & 0.041386 \tabularnewline
36 & -0.213872 & -1.6428 & 0.052874 \tabularnewline
37 & -0.212644 & -1.6334 & 0.053861 \tabularnewline
38 & -0.24583 & -1.8883 & 0.031956 \tabularnewline
39 & -0.248495 & -1.9087 & 0.030583 \tabularnewline
40 & -0.232103 & -1.7828 & 0.03988 \tabularnewline
41 & -0.231105 & -1.7752 & 0.040515 \tabularnewline
42 & -0.202287 & -1.5538 & 0.06279 \tabularnewline
43 & -0.174792 & -1.3426 & 0.092272 \tabularnewline
44 & -0.154588 & -1.1874 & 0.119911 \tabularnewline
45 & -0.135436 & -1.0403 & 0.151222 \tabularnewline
46 & -0.128809 & -0.9894 & 0.163253 \tabularnewline
47 & -0.112299 & -0.8626 & 0.19593 \tabularnewline
48 & -0.058084 & -0.4462 & 0.328561 \tabularnewline
49 & -0.038226 & -0.2936 & 0.385039 \tabularnewline
50 & -0.033207 & -0.2551 & 0.39978 \tabularnewline
51 & -0.032163 & -0.247 & 0.402864 \tabularnewline
52 & -0.022425 & -0.1722 & 0.431916 \tabularnewline
53 & -0.013203 & -0.1014 & 0.459784 \tabularnewline
54 & -0.006863 & -0.0527 & 0.479068 \tabularnewline
55 & 0.005596 & 0.043 & 0.482929 \tabularnewline
56 & 0.009924 & 0.0762 & 0.469747 \tabularnewline
57 & 0.005668 & 0.0435 & 0.48271 \tabularnewline
58 & 0.001135 & 0.0087 & 0.496536 \tabularnewline
59 & NA & NA & NA \tabularnewline
60 & NA & NA & NA \tabularnewline
\hline
\end{tabular}
%Source: https://freestatistics.org/blog/index.php?pk=69882&T=1

[TABLE]
[ROW][C]Autocorrelation Function[/C][/ROW]
[ROW][C]Time lag k[/C][C]ACF(k)[/C][C]T-STAT[/C][C]P-value[/C][/ROW]
[ROW][C]1[/C][C]0.804718[/C][C]6.1812[/C][C]0[/C][/ROW]
[ROW][C]2[/C][C]0.712194[/C][C]5.4705[/C][C]0[/C][/ROW]
[ROW][C]3[/C][C]0.690553[/C][C]5.3042[/C][C]1e-06[/C][/ROW]
[ROW][C]4[/C][C]0.624572[/C][C]4.7974[/C][C]6e-06[/C][/ROW]
[ROW][C]5[/C][C]0.58077[/C][C]4.461[/C][C]1.9e-05[/C][/ROW]
[ROW][C]6[/C][C]0.482716[/C][C]3.7078[/C][C]0.000232[/C][/ROW]
[ROW][C]7[/C][C]0.429842[/C][C]3.3017[/C][C]0.000818[/C][/ROW]
[ROW][C]8[/C][C]0.370336[/C][C]2.8446[/C][C]0.003052[/C][/ROW]
[ROW][C]9[/C][C]0.230936[/C][C]1.7739[/C][C]0.040624[/C][/ROW]
[ROW][C]10[/C][C]0.162172[/C][C]1.2457[/C][C]0.108906[/C][/ROW]
[ROW][C]11[/C][C]0.160055[/C][C]1.2294[/C][C]0.1119[/C][/ROW]
[ROW][C]12[/C][C]0.115285[/C][C]0.8855[/C][C]0.189735[/C][/ROW]
[ROW][C]13[/C][C]0.061281[/C][C]0.4707[/C][C]0.319793[/C][/ROW]
[ROW][C]14[/C][C]-0.012012[/C][C]-0.0923[/C][C]0.463399[/C][/ROW]
[ROW][C]15[/C][C]-0.083341[/C][C]-0.6402[/C][C]0.262276[/C][/ROW]
[ROW][C]16[/C][C]-0.064834[/C][C]-0.498[/C][C]0.310167[/C][/ROW]
[ROW][C]17[/C][C]-0.087305[/C][C]-0.6706[/C][C]0.252546[/C][/ROW]
[ROW][C]18[/C][C]-0.127878[/C][C]-0.9822[/C][C]0.164994[/C][/ROW]
[ROW][C]19[/C][C]-0.125104[/C][C]-0.9609[/C][C]0.170251[/C][/ROW]
[ROW][C]20[/C][C]-0.143269[/C][C]-1.1005[/C][C]0.137799[/C][/ROW]
[ROW][C]21[/C][C]-0.150952[/C][C]-1.1595[/C][C]0.125464[/C][/ROW]
[ROW][C]22[/C][C]-0.215724[/C][C]-1.657[/C][C]0.051414[/C][/ROW]
[ROW][C]23[/C][C]-0.170666[/C][C]-1.3109[/C][C]0.097484[/C][/ROW]
[ROW][C]24[/C][C]-0.117956[/C][C]-0.906[/C][C]0.184301[/C][/ROW]
[ROW][C]25[/C][C]-0.146016[/C][C]-1.1216[/C][C]0.133294[/C][/ROW]
[ROW][C]26[/C][C]-0.196396[/C][C]-1.5085[/C][C]0.068376[/C][/ROW]
[ROW][C]27[/C][C]-0.197221[/C][C]-1.5149[/C][C]0.067571[/C][/ROW]
[ROW][C]28[/C][C]-0.180473[/C][C]-1.3862[/C][C]0.085445[/C][/ROW]
[ROW][C]29[/C][C]-0.178139[/C][C]-1.3683[/C][C]0.088201[/C][/ROW]
[ROW][C]30[/C][C]-0.197799[/C][C]-1.5193[/C][C]0.067011[/C][/ROW]
[ROW][C]31[/C][C]-0.168522[/C][C]-1.2944[/C][C]0.100278[/C][/ROW]
[ROW][C]32[/C][C]-0.179212[/C][C]-1.3766[/C][C]0.086926[/C][/ROW]
[ROW][C]33[/C][C]-0.235356[/C][C]-1.8078[/C][C]0.037867[/C][/ROW]
[ROW][C]34[/C][C]-0.243386[/C][C]-1.8695[/C][C]0.03326[/C][/ROW]
[ROW][C]35[/C][C]-0.229759[/C][C]-1.7648[/C][C]0.041386[/C][/ROW]
[ROW][C]36[/C][C]-0.213872[/C][C]-1.6428[/C][C]0.052874[/C][/ROW]
[ROW][C]37[/C][C]-0.212644[/C][C]-1.6334[/C][C]0.053861[/C][/ROW]
[ROW][C]38[/C][C]-0.24583[/C][C]-1.8883[/C][C]0.031956[/C][/ROW]
[ROW][C]39[/C][C]-0.248495[/C][C]-1.9087[/C][C]0.030583[/C][/ROW]
[ROW][C]40[/C][C]-0.232103[/C][C]-1.7828[/C][C]0.03988[/C][/ROW]
[ROW][C]41[/C][C]-0.231105[/C][C]-1.7752[/C][C]0.040515[/C][/ROW]
[ROW][C]42[/C][C]-0.202287[/C][C]-1.5538[/C][C]0.06279[/C][/ROW]
[ROW][C]43[/C][C]-0.174792[/C][C]-1.3426[/C][C]0.092272[/C][/ROW]
[ROW][C]44[/C][C]-0.154588[/C][C]-1.1874[/C][C]0.119911[/C][/ROW]
[ROW][C]45[/C][C]-0.135436[/C][C]-1.0403[/C][C]0.151222[/C][/ROW]
[ROW][C]46[/C][C]-0.128809[/C][C]-0.9894[/C][C]0.163253[/C][/ROW]
[ROW][C]47[/C][C]-0.112299[/C][C]-0.8626[/C][C]0.19593[/C][/ROW]
[ROW][C]48[/C][C]-0.058084[/C][C]-0.4462[/C][C]0.328561[/C][/ROW]
[ROW][C]49[/C][C]-0.038226[/C][C]-0.2936[/C][C]0.385039[/C][/ROW]
[ROW][C]50[/C][C]-0.033207[/C][C]-0.2551[/C][C]0.39978[/C][/ROW]
[ROW][C]51[/C][C]-0.032163[/C][C]-0.247[/C][C]0.402864[/C][/ROW]
[ROW][C]52[/C][C]-0.022425[/C][C]-0.1722[/C][C]0.431916[/C][/ROW]
[ROW][C]53[/C][C]-0.013203[/C][C]-0.1014[/C][C]0.459784[/C][/ROW]
[ROW][C]54[/C][C]-0.006863[/C][C]-0.0527[/C][C]0.479068[/C][/ROW]
[ROW][C]55[/C][C]0.005596[/C][C]0.043[/C][C]0.482929[/C][/ROW]
[ROW][C]56[/C][C]0.009924[/C][C]0.0762[/C][C]0.469747[/C][/ROW]
[ROW][C]57[/C][C]0.005668[/C][C]0.0435[/C][C]0.48271[/C][/ROW]
[ROW][C]58[/C][C]0.001135[/C][C]0.0087[/C][C]0.496536[/C][/ROW]
[ROW][C]59[/C][C]NA[/C][C]NA[/C][C]NA[/C][/ROW]
[ROW][C]60[/C][C]NA[/C][C]NA[/C][C]NA[/C][/ROW]
[/TABLE]
Source: https://freestatistics.org/blog/index.php?pk=69882&T=1

Globally Unique Identifier (entire table): ba.freestatistics.org/blog/index.php?pk=69882&T=1

As an alternative you can also use a QR Code:  

The GUIDs for individual cells are displayed in the table below:

Autocorrelation Function
Time lag kACF(k)T-STATP-value
10.8047186.18120
20.7121945.47050
30.6905535.30421e-06
40.6245724.79746e-06
50.580774.4611.9e-05
60.4827163.70780.000232
70.4298423.30170.000818
80.3703362.84460.003052
90.2309361.77390.040624
100.1621721.24570.108906
110.1600551.22940.1119
120.1152850.88550.189735
130.0612810.47070.319793
14-0.012012-0.09230.463399
15-0.083341-0.64020.262276
16-0.064834-0.4980.310167
17-0.087305-0.67060.252546
18-0.127878-0.98220.164994
19-0.125104-0.96090.170251
20-0.143269-1.10050.137799
21-0.150952-1.15950.125464
22-0.215724-1.6570.051414
23-0.170666-1.31090.097484
24-0.117956-0.9060.184301
25-0.146016-1.12160.133294
26-0.196396-1.50850.068376
27-0.197221-1.51490.067571
28-0.180473-1.38620.085445
29-0.178139-1.36830.088201
30-0.197799-1.51930.067011
31-0.168522-1.29440.100278
32-0.179212-1.37660.086926
33-0.235356-1.80780.037867
34-0.243386-1.86950.03326
35-0.229759-1.76480.041386
36-0.213872-1.64280.052874
37-0.212644-1.63340.053861
38-0.24583-1.88830.031956
39-0.248495-1.90870.030583
40-0.232103-1.78280.03988
41-0.231105-1.77520.040515
42-0.202287-1.55380.06279
43-0.174792-1.34260.092272
44-0.154588-1.18740.119911
45-0.135436-1.04030.151222
46-0.128809-0.98940.163253
47-0.112299-0.86260.19593
48-0.058084-0.44620.328561
49-0.038226-0.29360.385039
50-0.033207-0.25510.39978
51-0.032163-0.2470.402864
52-0.022425-0.17220.431916
53-0.013203-0.10140.459784
54-0.006863-0.05270.479068
550.0055960.0430.482929
560.0099240.07620.469747
570.0056680.04350.48271
580.0011350.00870.496536
59NANANA
60NANANA


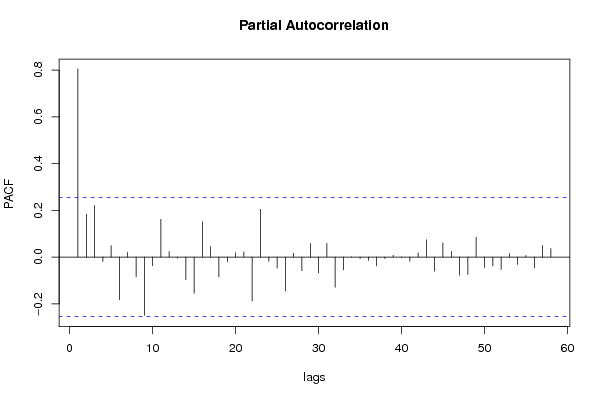
Partial Autocorrelation Function
Time lag kPACF(k)T-STATP-value
10.8047186.18120
20.1833641.40840.082124
30.2201261.69080.048074
4-0.018714-0.14370.443096
50.048770.37460.354647
6-0.182546-1.40220.083053
70.0197050.15140.440105
8-0.084518-0.64920.259365
9-0.25014-1.92140.029761
10-0.037897-0.29110.386
110.1614421.24010.109932
120.0231720.1780.429671
13-0.004507-0.03460.486252
14-0.096309-0.73980.231189
15-0.154673-1.18810.119784
160.1505861.15670.126034
170.0445870.34250.366605
18-0.084703-0.65060.25891
19-0.020347-0.15630.438169
200.0184310.14160.443951
210.022010.16910.433162
22-0.188492-1.44780.076479
230.204161.56820.061093
24-0.018238-0.14010.444535
25-0.047299-0.36330.358837
26-0.145314-1.11620.134435
270.015880.1220.451667
28-0.05863-0.45030.327057
290.0580830.44610.328563
30-0.06764-0.51960.30266
310.0582240.44720.328175
32-0.129781-0.99690.16145
33-0.054543-0.4190.338386
340.0006460.0050.498029
35-0.00626-0.04810.480907
36-0.014636-0.11240.455436
37-0.038043-0.29220.385574
38-0.006456-0.04960.480308
390.0072810.05590.477795
40-0.001755-0.01350.494646
41-0.018124-0.13920.444878
420.0173130.1330.447328
430.0736970.56610.286744
44-0.060917-0.46790.320785
450.0601780.46220.322805
460.0240860.1850.42693
47-0.077496-0.59530.276973
48-0.074686-0.57370.284185
490.0845720.64960.259232
50-0.045223-0.34740.364777
51-0.038701-0.29730.383654
52-0.053687-0.41240.34078
530.0142590.10950.45658
54-0.031588-0.24260.404567
550.0062670.04810.480884
56-0.045612-0.35040.36366
570.0487870.37470.3546
580.0361220.27750.3912
59NANANA
60NANANA

\begin{tabular}{lllllllll}
\hline
Partial Autocorrelation Function \tabularnewline
Time lag k & PACF(k) & T-STAT & P-value \tabularnewline
1 & 0.804718 & 6.1812 & 0 \tabularnewline
2 & 0.183364 & 1.4084 & 0.082124 \tabularnewline
3 & 0.220126 & 1.6908 & 0.048074 \tabularnewline
4 & -0.018714 & -0.1437 & 0.443096 \tabularnewline
5 & 0.04877 & 0.3746 & 0.354647 \tabularnewline
6 & -0.182546 & -1.4022 & 0.083053 \tabularnewline
7 & 0.019705 & 0.1514 & 0.440105 \tabularnewline
8 & -0.084518 & -0.6492 & 0.259365 \tabularnewline
9 & -0.25014 & -1.9214 & 0.029761 \tabularnewline
10 & -0.037897 & -0.2911 & 0.386 \tabularnewline
11 & 0.161442 & 1.2401 & 0.109932 \tabularnewline
12 & 0.023172 & 0.178 & 0.429671 \tabularnewline
13 & -0.004507 & -0.0346 & 0.486252 \tabularnewline
14 & -0.096309 & -0.7398 & 0.231189 \tabularnewline
15 & -0.154673 & -1.1881 & 0.119784 \tabularnewline
16 & 0.150586 & 1.1567 & 0.126034 \tabularnewline
17 & 0.044587 & 0.3425 & 0.366605 \tabularnewline
18 & -0.084703 & -0.6506 & 0.25891 \tabularnewline
19 & -0.020347 & -0.1563 & 0.438169 \tabularnewline
20 & 0.018431 & 0.1416 & 0.443951 \tabularnewline
21 & 0.02201 & 0.1691 & 0.433162 \tabularnewline
22 & -0.188492 & -1.4478 & 0.076479 \tabularnewline
23 & 0.20416 & 1.5682 & 0.061093 \tabularnewline
24 & -0.018238 & -0.1401 & 0.444535 \tabularnewline
25 & -0.047299 & -0.3633 & 0.358837 \tabularnewline
26 & -0.145314 & -1.1162 & 0.134435 \tabularnewline
27 & 0.01588 & 0.122 & 0.451667 \tabularnewline
28 & -0.05863 & -0.4503 & 0.327057 \tabularnewline
29 & 0.058083 & 0.4461 & 0.328563 \tabularnewline
30 & -0.06764 & -0.5196 & 0.30266 \tabularnewline
31 & 0.058224 & 0.4472 & 0.328175 \tabularnewline
32 & -0.129781 & -0.9969 & 0.16145 \tabularnewline
33 & -0.054543 & -0.419 & 0.338386 \tabularnewline
34 & 0.000646 & 0.005 & 0.498029 \tabularnewline
35 & -0.00626 & -0.0481 & 0.480907 \tabularnewline
36 & -0.014636 & -0.1124 & 0.455436 \tabularnewline
37 & -0.038043 & -0.2922 & 0.385574 \tabularnewline
38 & -0.006456 & -0.0496 & 0.480308 \tabularnewline
39 & 0.007281 & 0.0559 & 0.477795 \tabularnewline
40 & -0.001755 & -0.0135 & 0.494646 \tabularnewline
41 & -0.018124 & -0.1392 & 0.444878 \tabularnewline
42 & 0.017313 & 0.133 & 0.447328 \tabularnewline
43 & 0.073697 & 0.5661 & 0.286744 \tabularnewline
44 & -0.060917 & -0.4679 & 0.320785 \tabularnewline
45 & 0.060178 & 0.4622 & 0.322805 \tabularnewline
46 & 0.024086 & 0.185 & 0.42693 \tabularnewline
47 & -0.077496 & -0.5953 & 0.276973 \tabularnewline
48 & -0.074686 & -0.5737 & 0.284185 \tabularnewline
49 & 0.084572 & 0.6496 & 0.259232 \tabularnewline
50 & -0.045223 & -0.3474 & 0.364777 \tabularnewline
51 & -0.038701 & -0.2973 & 0.383654 \tabularnewline
52 & -0.053687 & -0.4124 & 0.34078 \tabularnewline
53 & 0.014259 & 0.1095 & 0.45658 \tabularnewline
54 & -0.031588 & -0.2426 & 0.404567 \tabularnewline
55 & 0.006267 & 0.0481 & 0.480884 \tabularnewline
56 & -0.045612 & -0.3504 & 0.36366 \tabularnewline
57 & 0.048787 & 0.3747 & 0.3546 \tabularnewline
58 & 0.036122 & 0.2775 & 0.3912 \tabularnewline
59 & NA & NA & NA \tabularnewline
60 & NA & NA & NA \tabularnewline
\hline
\end{tabular}
%Source: https://freestatistics.org/blog/index.php?pk=69882&T=2

[TABLE]
[ROW][C]Partial Autocorrelation Function[/C][/ROW]
[ROW][C]Time lag k[/C][C]PACF(k)[/C][C]T-STAT[/C][C]P-value[/C][/ROW]
[ROW][C]1[/C][C]0.804718[/C][C]6.1812[/C][C]0[/C][/ROW]
[ROW][C]2[/C][C]0.183364[/C][C]1.4084[/C][C]0.082124[/C][/ROW]
[ROW][C]3[/C][C]0.220126[/C][C]1.6908[/C][C]0.048074[/C][/ROW]
[ROW][C]4[/C][C]-0.018714[/C][C]-0.1437[/C][C]0.443096[/C][/ROW]
[ROW][C]5[/C][C]0.04877[/C][C]0.3746[/C][C]0.354647[/C][/ROW]
[ROW][C]6[/C][C]-0.182546[/C][C]-1.4022[/C][C]0.083053[/C][/ROW]
[ROW][C]7[/C][C]0.019705[/C][C]0.1514[/C][C]0.440105[/C][/ROW]
[ROW][C]8[/C][C]-0.084518[/C][C]-0.6492[/C][C]0.259365[/C][/ROW]
[ROW][C]9[/C][C]-0.25014[/C][C]-1.9214[/C][C]0.029761[/C][/ROW]
[ROW][C]10[/C][C]-0.037897[/C][C]-0.2911[/C][C]0.386[/C][/ROW]
[ROW][C]11[/C][C]0.161442[/C][C]1.2401[/C][C]0.109932[/C][/ROW]
[ROW][C]12[/C][C]0.023172[/C][C]0.178[/C][C]0.429671[/C][/ROW]
[ROW][C]13[/C][C]-0.004507[/C][C]-0.0346[/C][C]0.486252[/C][/ROW]
[ROW][C]14[/C][C]-0.096309[/C][C]-0.7398[/C][C]0.231189[/C][/ROW]
[ROW][C]15[/C][C]-0.154673[/C][C]-1.1881[/C][C]0.119784[/C][/ROW]
[ROW][C]16[/C][C]0.150586[/C][C]1.1567[/C][C]0.126034[/C][/ROW]
[ROW][C]17[/C][C]0.044587[/C][C]0.3425[/C][C]0.366605[/C][/ROW]
[ROW][C]18[/C][C]-0.084703[/C][C]-0.6506[/C][C]0.25891[/C][/ROW]
[ROW][C]19[/C][C]-0.020347[/C][C]-0.1563[/C][C]0.438169[/C][/ROW]
[ROW][C]20[/C][C]0.018431[/C][C]0.1416[/C][C]0.443951[/C][/ROW]
[ROW][C]21[/C][C]0.02201[/C][C]0.1691[/C][C]0.433162[/C][/ROW]
[ROW][C]22[/C][C]-0.188492[/C][C]-1.4478[/C][C]0.076479[/C][/ROW]
[ROW][C]23[/C][C]0.20416[/C][C]1.5682[/C][C]0.061093[/C][/ROW]
[ROW][C]24[/C][C]-0.018238[/C][C]-0.1401[/C][C]0.444535[/C][/ROW]
[ROW][C]25[/C][C]-0.047299[/C][C]-0.3633[/C][C]0.358837[/C][/ROW]
[ROW][C]26[/C][C]-0.145314[/C][C]-1.1162[/C][C]0.134435[/C][/ROW]
[ROW][C]27[/C][C]0.01588[/C][C]0.122[/C][C]0.451667[/C][/ROW]
[ROW][C]28[/C][C]-0.05863[/C][C]-0.4503[/C][C]0.327057[/C][/ROW]
[ROW][C]29[/C][C]0.058083[/C][C]0.4461[/C][C]0.328563[/C][/ROW]
[ROW][C]30[/C][C]-0.06764[/C][C]-0.5196[/C][C]0.30266[/C][/ROW]
[ROW][C]31[/C][C]0.058224[/C][C]0.4472[/C][C]0.328175[/C][/ROW]
[ROW][C]32[/C][C]-0.129781[/C][C]-0.9969[/C][C]0.16145[/C][/ROW]
[ROW][C]33[/C][C]-0.054543[/C][C]-0.419[/C][C]0.338386[/C][/ROW]
[ROW][C]34[/C][C]0.000646[/C][C]0.005[/C][C]0.498029[/C][/ROW]
[ROW][C]35[/C][C]-0.00626[/C][C]-0.0481[/C][C]0.480907[/C][/ROW]
[ROW][C]36[/C][C]-0.014636[/C][C]-0.1124[/C][C]0.455436[/C][/ROW]
[ROW][C]37[/C][C]-0.038043[/C][C]-0.2922[/C][C]0.385574[/C][/ROW]
[ROW][C]38[/C][C]-0.006456[/C][C]-0.0496[/C][C]0.480308[/C][/ROW]
[ROW][C]39[/C][C]0.007281[/C][C]0.0559[/C][C]0.477795[/C][/ROW]
[ROW][C]40[/C][C]-0.001755[/C][C]-0.0135[/C][C]0.494646[/C][/ROW]
[ROW][C]41[/C][C]-0.018124[/C][C]-0.1392[/C][C]0.444878[/C][/ROW]
[ROW][C]42[/C][C]0.017313[/C][C]0.133[/C][C]0.447328[/C][/ROW]
[ROW][C]43[/C][C]0.073697[/C][C]0.5661[/C][C]0.286744[/C][/ROW]
[ROW][C]44[/C][C]-0.060917[/C][C]-0.4679[/C][C]0.320785[/C][/ROW]
[ROW][C]45[/C][C]0.060178[/C][C]0.4622[/C][C]0.322805[/C][/ROW]
[ROW][C]46[/C][C]0.024086[/C][C]0.185[/C][C]0.42693[/C][/ROW]
[ROW][C]47[/C][C]-0.077496[/C][C]-0.5953[/C][C]0.276973[/C][/ROW]
[ROW][C]48[/C][C]-0.074686[/C][C]-0.5737[/C][C]0.284185[/C][/ROW]
[ROW][C]49[/C][C]0.084572[/C][C]0.6496[/C][C]0.259232[/C][/ROW]
[ROW][C]50[/C][C]-0.045223[/C][C]-0.3474[/C][C]0.364777[/C][/ROW]
[ROW][C]51[/C][C]-0.038701[/C][C]-0.2973[/C][C]0.383654[/C][/ROW]
[ROW][C]52[/C][C]-0.053687[/C][C]-0.4124[/C][C]0.34078[/C][/ROW]
[ROW][C]53[/C][C]0.014259[/C][C]0.1095[/C][C]0.45658[/C][/ROW]
[ROW][C]54[/C][C]-0.031588[/C][C]-0.2426[/C][C]0.404567[/C][/ROW]
[ROW][C]55[/C][C]0.006267[/C][C]0.0481[/C][C]0.480884[/C][/ROW]
[ROW][C]56[/C][C]-0.045612[/C][C]-0.3504[/C][C]0.36366[/C][/ROW]
[ROW][C]57[/C][C]0.048787[/C][C]0.3747[/C][C]0.3546[/C][/ROW]
[ROW][C]58[/C][C]0.036122[/C][C]0.2775[/C][C]0.3912[/C][/ROW]
[ROW][C]59[/C][C]NA[/C][C]NA[/C][C]NA[/C][/ROW]
[ROW][C]60[/C][C]NA[/C][C]NA[/C][C]NA[/C][/ROW]
[/TABLE]
Source: https://freestatistics.org/blog/index.php?pk=69882&T=2

Globally Unique Identifier (entire table): ba.freestatistics.org/blog/index.php?pk=69882&T=2

As an alternative you can also use a QR Code:  

The GUIDs for individual cells are displayed in the table below:

Partial Autocorrelation Function
Time lag kPACF(k)T-STATP-value
10.8047186.18120
20.1833641.40840.082124
30.2201261.69080.048074
4-0.018714-0.14370.443096
50.048770.37460.354647
6-0.182546-1.40220.083053
70.0197050.15140.440105
8-0.084518-0.64920.259365
9-0.25014-1.92140.029761
10-0.037897-0.29110.386
110.1614421.24010.109932
120.0231720.1780.429671
13-0.004507-0.03460.486252
14-0.096309-0.73980.231189
15-0.154673-1.18810.119784
160.1505861.15670.126034
170.0445870.34250.366605
18-0.084703-0.65060.25891
19-0.020347-0.15630.438169
200.0184310.14160.443951
210.022010.16910.433162
22-0.188492-1.44780.076479
230.204161.56820.061093
24-0.018238-0.14010.444535
25-0.047299-0.36330.358837
26-0.145314-1.11620.134435
270.015880.1220.451667
28-0.05863-0.45030.327057
290.0580830.44610.328563
30-0.06764-0.51960.30266
310.0582240.44720.328175
32-0.129781-0.99690.16145
33-0.054543-0.4190.338386
340.0006460.0050.498029
35-0.00626-0.04810.480907
36-0.014636-0.11240.455436
37-0.038043-0.29220.385574
38-0.006456-0.04960.480308
390.0072810.05590.477795
40-0.001755-0.01350.494646
41-0.018124-0.13920.444878
420.0173130.1330.447328
430.0736970.56610.286744
44-0.060917-0.46790.320785
450.0601780.46220.322805
460.0240860.1850.42693
47-0.077496-0.59530.276973
48-0.074686-0.57370.284185
490.0845720.64960.259232
50-0.045223-0.34740.364777
51-0.038701-0.29730.383654
52-0.053687-0.41240.34078
530.0142590.10950.45658
54-0.031588-0.24260.404567
550.0062670.04810.480884
56-0.045612-0.35040.36366
570.0487870.37470.3546
580.0361220.27750.3912
59NANANA
60NANANA


Parameters (Session):
par1 = 60 ; par2 = 1 ; par3 = 0 ; par4 = 0 ; par5 = 12 ; par6 = MA ; par7 = 0.95 ;
Parameters (R input):
par1 = 60 ; par2 = 1 ; par3 = 0 ; par4 = 0 ; par5 = 12 ; par6 = MA ; par7 = 0.95 ;
R code (references can be found in the software module):
if (par1 == 'Default') {
par1 = 10*log10(length(x))
} else {
par1 <- as.numeric(par1)
}
par2 <- as.numeric(par2)
par3 <- as.numeric(par3)
par4 <- as.numeric(par4)
par5 <- as.numeric(par5)
if (par6 == 'White Noise') par6 <- 'white' else par6 <- 'ma'
par7 <- as.numeric(par7)
if (par2 == 0) {
x <- log(x)
} else {
x <- (x ^ par2 - 1) / par2
}
if (par3 > 0) x <- diff(x,lag=1,difference=par3)
if (par4 > 0) x <- diff(x,lag=par5,difference=par4)
bitmap(file='pic1.png')
racf <- acf(x, par1, main='Autocorrelation', xlab='time lag', ylab='ACF', ci.type=par6, ci=par7, sub=paste('(lambda=',par2,', d=',par3,', D=',par4,', CI=', par7, ', CI type=',par6,')',sep=''))
dev.off()
bitmap(file='pic2.png')
rpacf <- pacf(x,par1,main='Partial Autocorrelation',xlab='lags',ylab='PACF')
dev.off()
(myacf <- c(racf$acf))
(mypacf <- c(rpacf$acf))
lengthx <- length(x)
sqrtn <- sqrt(lengthx)
load(file='createtable')
a<-table.start()
a<-table.row.start(a)
a<-table.element(a,'Autocorrelation Function',4,TRUE)
a<-table.row.end(a)
a<-table.row.start(a)
a<-table.element(a,'Time lag k',header=TRUE)
a<-table.element(a,hyperlink('basics.htm','ACF(k)','click here for more information about the Autocorrelation Function'),header=TRUE)
a<-table.element(a,'T-STAT',header=TRUE)
a<-table.element(a,'P-value',header=TRUE)
a<-table.row.end(a)
for (i in 2:(par1+1)) {
a<-table.row.start(a)
a<-table.element(a,i-1,header=TRUE)
a<-table.element(a,round(myacf[i],6))
mytstat <- myacf[i]*sqrtn
a<-table.element(a,round(mytstat,4))
a<-table.element(a,round(1-pt(abs(mytstat),lengthx),6))
a<-table.row.end(a)
}
a<-table.end(a)
table.save(a,file='mytable.tab')
a<-table.start()
a<-table.row.start(a)
a<-table.element(a,'Partial Autocorrelation Function',4,TRUE)
a<-table.row.end(a)
a<-table.row.start(a)
a<-table.element(a,'Time lag k',header=TRUE)
a<-table.element(a,hyperlink('basics.htm','PACF(k)','click here for more information about the Partial Autocorrelation Function'),header=TRUE)
a<-table.element(a,'T-STAT',header=TRUE)
a<-table.element(a,'P-value',header=TRUE)
a<-table.row.end(a)
for (i in 1:par1) {
a<-table.row.start(a)
a<-table.element(a,i,header=TRUE)
a<-table.element(a,round(mypacf[i],6))
mytstat <- mypacf[i]*sqrtn
a<-table.element(a,round(mytstat,4))
a<-table.element(a,round(1-pt(abs(mytstat),lengthx),6))
a<-table.row.end(a)
}
a<-table.end(a)
table.save(a,file='mytable1.tab')