Free Statistics

of Irreproducible Research!

Author's title

Author*The author of this computation has been verified*
R Software Modulerwasp_autocorrelation.wasp
Title produced by software(Partial) Autocorrelation Function
Date of computationSun, 20 Dec 2009 06:49:50 -0700
Cite this page as followsStatistical Computations at FreeStatistics.org, Office for Research Development and Education, URL https://freestatistics.org/blog/index.php?v=date/2009/Dec/20/t1261317169t0o7v92zxk768im.htm/, Retrieved Sat, 27 Apr 2024 11:57:02 +0000
Statistical Computations at FreeStatistics.org, Office for Research Development and Education, URL https://freestatistics.org/blog/index.php?pk=69884, Retrieved Sat, 27 Apr 2024 11:57:02 +0000
QR Codes:

Original text written by user:
IsPrivate?No (this computation is public)
User-defined keywords
Estimated Impact127
Family? (F = Feedback message, R = changed R code, M = changed R Module, P = changed Parameters, D = changed Data)
-       [(Partial) Autocorrelation Function] [ACF 2] [2009-12-20 13:49:50] [e458b4e05bf28a297f8af8d9f96e59d6] [Current]
Feedback Forum

Post a new message
Dataseries X:
210
220
212
191
180
195
136
196
182
166
147
125
164
170
171
140
155
156
141
167
171
206
187
124
163
154
226
125
162
145
98
128
159
209
150
125
214
193
140
205
192
192
186
150
246
282
264
336
301
376
416
344
326
351
249
258
311
343
278


Summary of computational transaction
Raw Inputview raw input (R code)
Raw Outputview raw output of R engine
Computing time1 seconds
R Server'Gwilym Jenkins' @ 72.249.127.135

\begin{tabular}{lllllllll}
\hline
Summary of computational transaction \tabularnewline
Raw Input & view raw input (R code)  \tabularnewline
Raw Output & view raw output of R engine  \tabularnewline
Computing time & 1 seconds \tabularnewline
R Server & 'Gwilym Jenkins' @ 72.249.127.135 \tabularnewline
\hline
\end{tabular}
%Source: https://freestatistics.org/blog/index.php?pk=69884&T=0

[TABLE]
[ROW][C]Summary of computational transaction[/C][/ROW]
[ROW][C]Raw Input[/C][C]view raw input (R code) [/C][/ROW]
[ROW][C]Raw Output[/C][C]view raw output of R engine [/C][/ROW]
[ROW][C]Computing time[/C][C]1 seconds[/C][/ROW]
[ROW][C]R Server[/C][C]'Gwilym Jenkins' @ 72.249.127.135[/C][/ROW]
[/TABLE]
Source: https://freestatistics.org/blog/index.php?pk=69884&T=0

Globally Unique Identifier (entire table): ba.freestatistics.org/blog/index.php?pk=69884&T=0

As an alternative you can also use a QR Code:  

The GUIDs for individual cells are displayed in the table below:

Summary of computational transaction
Raw Inputview raw input (R code)
Raw Outputview raw output of R engine
Computing time1 seconds
R Server'Gwilym Jenkins' @ 72.249.127.135


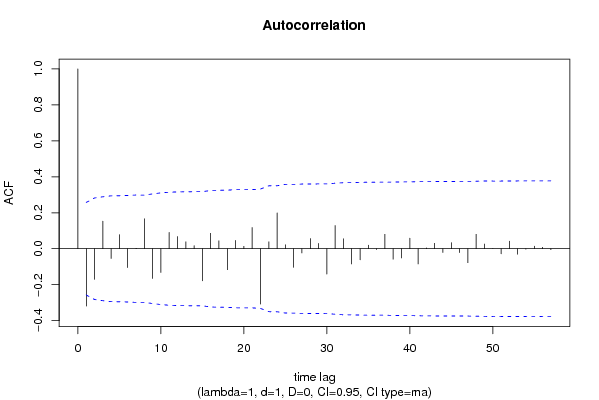
Autocorrelation Function
Time lag kACF(k)T-STATP-value
1-0.318822-2.42810.009151
2-0.170349-1.29730.099826
30.1529411.16480.124441
4-0.054022-0.41140.341139
50.0779950.5940.277413
6-0.104744-0.79770.214148
70.002160.01640.493466
80.1663151.26660.105178
9-0.165462-1.26010.106336
10-0.131707-1.00310.160001
110.0906310.69020.246404
120.0679810.51770.303309
130.0386610.29440.384738
140.016760.12760.449437
15-0.178541-1.35970.08959
160.0857390.6530.258179
170.0440960.33580.369108
18-0.116362-0.88620.189588
190.0461330.35130.363304
200.0133520.10170.459679
210.1176350.89590.187011
22-0.307712-2.34350.011278
230.0387170.29490.384576
240.1988421.51430.067686
250.0216480.16490.434812
26-0.103568-0.78880.216735
27-0.023444-0.17850.429459
280.0566070.43110.333996
290.0292990.22310.412107
30-0.14116-1.0750.143404
310.1292350.98420.164546
320.0549630.41860.338532
33-0.084932-0.64680.260148
34-0.061908-0.47150.319535
350.0195030.14850.441219
36-0.004839-0.03690.485364
370.0804430.61260.271255
38-0.058039-0.4420.330063
39-0.051349-0.39110.348592
400.0584890.44540.328831
41-0.08432-0.64220.26165
420.0042490.03240.48715
430.0302350.23030.40935
44-0.020773-0.15820.437425
450.0333340.25390.400248
46-0.021444-0.16330.43542
47-0.077591-0.59090.278436
480.0805460.61340.270998
490.0260810.19860.421623
500.0005680.00430.498283
51-0.028346-0.21590.414922
520.0418190.31850.375631
53-0.030062-0.22890.409859
54-0.002498-0.0190.492444
550.0144250.10990.456452
560.0077230.05880.476651
57-0.005132-0.03910.48448
58NANANA
59NANANA
60NANANA

\begin{tabular}{lllllllll}
\hline
Autocorrelation Function \tabularnewline
Time lag k & ACF(k) & T-STAT & P-value \tabularnewline
1 & -0.318822 & -2.4281 & 0.009151 \tabularnewline
2 & -0.170349 & -1.2973 & 0.099826 \tabularnewline
3 & 0.152941 & 1.1648 & 0.124441 \tabularnewline
4 & -0.054022 & -0.4114 & 0.341139 \tabularnewline
5 & 0.077995 & 0.594 & 0.277413 \tabularnewline
6 & -0.104744 & -0.7977 & 0.214148 \tabularnewline
7 & 0.00216 & 0.0164 & 0.493466 \tabularnewline
8 & 0.166315 & 1.2666 & 0.105178 \tabularnewline
9 & -0.165462 & -1.2601 & 0.106336 \tabularnewline
10 & -0.131707 & -1.0031 & 0.160001 \tabularnewline
11 & 0.090631 & 0.6902 & 0.246404 \tabularnewline
12 & 0.067981 & 0.5177 & 0.303309 \tabularnewline
13 & 0.038661 & 0.2944 & 0.384738 \tabularnewline
14 & 0.01676 & 0.1276 & 0.449437 \tabularnewline
15 & -0.178541 & -1.3597 & 0.08959 \tabularnewline
16 & 0.085739 & 0.653 & 0.258179 \tabularnewline
17 & 0.044096 & 0.3358 & 0.369108 \tabularnewline
18 & -0.116362 & -0.8862 & 0.189588 \tabularnewline
19 & 0.046133 & 0.3513 & 0.363304 \tabularnewline
20 & 0.013352 & 0.1017 & 0.459679 \tabularnewline
21 & 0.117635 & 0.8959 & 0.187011 \tabularnewline
22 & -0.307712 & -2.3435 & 0.011278 \tabularnewline
23 & 0.038717 & 0.2949 & 0.384576 \tabularnewline
24 & 0.198842 & 1.5143 & 0.067686 \tabularnewline
25 & 0.021648 & 0.1649 & 0.434812 \tabularnewline
26 & -0.103568 & -0.7888 & 0.216735 \tabularnewline
27 & -0.023444 & -0.1785 & 0.429459 \tabularnewline
28 & 0.056607 & 0.4311 & 0.333996 \tabularnewline
29 & 0.029299 & 0.2231 & 0.412107 \tabularnewline
30 & -0.14116 & -1.075 & 0.143404 \tabularnewline
31 & 0.129235 & 0.9842 & 0.164546 \tabularnewline
32 & 0.054963 & 0.4186 & 0.338532 \tabularnewline
33 & -0.084932 & -0.6468 & 0.260148 \tabularnewline
34 & -0.061908 & -0.4715 & 0.319535 \tabularnewline
35 & 0.019503 & 0.1485 & 0.441219 \tabularnewline
36 & -0.004839 & -0.0369 & 0.485364 \tabularnewline
37 & 0.080443 & 0.6126 & 0.271255 \tabularnewline
38 & -0.058039 & -0.442 & 0.330063 \tabularnewline
39 & -0.051349 & -0.3911 & 0.348592 \tabularnewline
40 & 0.058489 & 0.4454 & 0.328831 \tabularnewline
41 & -0.08432 & -0.6422 & 0.26165 \tabularnewline
42 & 0.004249 & 0.0324 & 0.48715 \tabularnewline
43 & 0.030235 & 0.2303 & 0.40935 \tabularnewline
44 & -0.020773 & -0.1582 & 0.437425 \tabularnewline
45 & 0.033334 & 0.2539 & 0.400248 \tabularnewline
46 & -0.021444 & -0.1633 & 0.43542 \tabularnewline
47 & -0.077591 & -0.5909 & 0.278436 \tabularnewline
48 & 0.080546 & 0.6134 & 0.270998 \tabularnewline
49 & 0.026081 & 0.1986 & 0.421623 \tabularnewline
50 & 0.000568 & 0.0043 & 0.498283 \tabularnewline
51 & -0.028346 & -0.2159 & 0.414922 \tabularnewline
52 & 0.041819 & 0.3185 & 0.375631 \tabularnewline
53 & -0.030062 & -0.2289 & 0.409859 \tabularnewline
54 & -0.002498 & -0.019 & 0.492444 \tabularnewline
55 & 0.014425 & 0.1099 & 0.456452 \tabularnewline
56 & 0.007723 & 0.0588 & 0.476651 \tabularnewline
57 & -0.005132 & -0.0391 & 0.48448 \tabularnewline
58 & NA & NA & NA \tabularnewline
59 & NA & NA & NA \tabularnewline
60 & NA & NA & NA \tabularnewline
\hline
\end{tabular}
%Source: https://freestatistics.org/blog/index.php?pk=69884&T=1

[TABLE]
[ROW][C]Autocorrelation Function[/C][/ROW]
[ROW][C]Time lag k[/C][C]ACF(k)[/C][C]T-STAT[/C][C]P-value[/C][/ROW]
[ROW][C]1[/C][C]-0.318822[/C][C]-2.4281[/C][C]0.009151[/C][/ROW]
[ROW][C]2[/C][C]-0.170349[/C][C]-1.2973[/C][C]0.099826[/C][/ROW]
[ROW][C]3[/C][C]0.152941[/C][C]1.1648[/C][C]0.124441[/C][/ROW]
[ROW][C]4[/C][C]-0.054022[/C][C]-0.4114[/C][C]0.341139[/C][/ROW]
[ROW][C]5[/C][C]0.077995[/C][C]0.594[/C][C]0.277413[/C][/ROW]
[ROW][C]6[/C][C]-0.104744[/C][C]-0.7977[/C][C]0.214148[/C][/ROW]
[ROW][C]7[/C][C]0.00216[/C][C]0.0164[/C][C]0.493466[/C][/ROW]
[ROW][C]8[/C][C]0.166315[/C][C]1.2666[/C][C]0.105178[/C][/ROW]
[ROW][C]9[/C][C]-0.165462[/C][C]-1.2601[/C][C]0.106336[/C][/ROW]
[ROW][C]10[/C][C]-0.131707[/C][C]-1.0031[/C][C]0.160001[/C][/ROW]
[ROW][C]11[/C][C]0.090631[/C][C]0.6902[/C][C]0.246404[/C][/ROW]
[ROW][C]12[/C][C]0.067981[/C][C]0.5177[/C][C]0.303309[/C][/ROW]
[ROW][C]13[/C][C]0.038661[/C][C]0.2944[/C][C]0.384738[/C][/ROW]
[ROW][C]14[/C][C]0.01676[/C][C]0.1276[/C][C]0.449437[/C][/ROW]
[ROW][C]15[/C][C]-0.178541[/C][C]-1.3597[/C][C]0.08959[/C][/ROW]
[ROW][C]16[/C][C]0.085739[/C][C]0.653[/C][C]0.258179[/C][/ROW]
[ROW][C]17[/C][C]0.044096[/C][C]0.3358[/C][C]0.369108[/C][/ROW]
[ROW][C]18[/C][C]-0.116362[/C][C]-0.8862[/C][C]0.189588[/C][/ROW]
[ROW][C]19[/C][C]0.046133[/C][C]0.3513[/C][C]0.363304[/C][/ROW]
[ROW][C]20[/C][C]0.013352[/C][C]0.1017[/C][C]0.459679[/C][/ROW]
[ROW][C]21[/C][C]0.117635[/C][C]0.8959[/C][C]0.187011[/C][/ROW]
[ROW][C]22[/C][C]-0.307712[/C][C]-2.3435[/C][C]0.011278[/C][/ROW]
[ROW][C]23[/C][C]0.038717[/C][C]0.2949[/C][C]0.384576[/C][/ROW]
[ROW][C]24[/C][C]0.198842[/C][C]1.5143[/C][C]0.067686[/C][/ROW]
[ROW][C]25[/C][C]0.021648[/C][C]0.1649[/C][C]0.434812[/C][/ROW]
[ROW][C]26[/C][C]-0.103568[/C][C]-0.7888[/C][C]0.216735[/C][/ROW]
[ROW][C]27[/C][C]-0.023444[/C][C]-0.1785[/C][C]0.429459[/C][/ROW]
[ROW][C]28[/C][C]0.056607[/C][C]0.4311[/C][C]0.333996[/C][/ROW]
[ROW][C]29[/C][C]0.029299[/C][C]0.2231[/C][C]0.412107[/C][/ROW]
[ROW][C]30[/C][C]-0.14116[/C][C]-1.075[/C][C]0.143404[/C][/ROW]
[ROW][C]31[/C][C]0.129235[/C][C]0.9842[/C][C]0.164546[/C][/ROW]
[ROW][C]32[/C][C]0.054963[/C][C]0.4186[/C][C]0.338532[/C][/ROW]
[ROW][C]33[/C][C]-0.084932[/C][C]-0.6468[/C][C]0.260148[/C][/ROW]
[ROW][C]34[/C][C]-0.061908[/C][C]-0.4715[/C][C]0.319535[/C][/ROW]
[ROW][C]35[/C][C]0.019503[/C][C]0.1485[/C][C]0.441219[/C][/ROW]
[ROW][C]36[/C][C]-0.004839[/C][C]-0.0369[/C][C]0.485364[/C][/ROW]
[ROW][C]37[/C][C]0.080443[/C][C]0.6126[/C][C]0.271255[/C][/ROW]
[ROW][C]38[/C][C]-0.058039[/C][C]-0.442[/C][C]0.330063[/C][/ROW]
[ROW][C]39[/C][C]-0.051349[/C][C]-0.3911[/C][C]0.348592[/C][/ROW]
[ROW][C]40[/C][C]0.058489[/C][C]0.4454[/C][C]0.328831[/C][/ROW]
[ROW][C]41[/C][C]-0.08432[/C][C]-0.6422[/C][C]0.26165[/C][/ROW]
[ROW][C]42[/C][C]0.004249[/C][C]0.0324[/C][C]0.48715[/C][/ROW]
[ROW][C]43[/C][C]0.030235[/C][C]0.2303[/C][C]0.40935[/C][/ROW]
[ROW][C]44[/C][C]-0.020773[/C][C]-0.1582[/C][C]0.437425[/C][/ROW]
[ROW][C]45[/C][C]0.033334[/C][C]0.2539[/C][C]0.400248[/C][/ROW]
[ROW][C]46[/C][C]-0.021444[/C][C]-0.1633[/C][C]0.43542[/C][/ROW]
[ROW][C]47[/C][C]-0.077591[/C][C]-0.5909[/C][C]0.278436[/C][/ROW]
[ROW][C]48[/C][C]0.080546[/C][C]0.6134[/C][C]0.270998[/C][/ROW]
[ROW][C]49[/C][C]0.026081[/C][C]0.1986[/C][C]0.421623[/C][/ROW]
[ROW][C]50[/C][C]0.000568[/C][C]0.0043[/C][C]0.498283[/C][/ROW]
[ROW][C]51[/C][C]-0.028346[/C][C]-0.2159[/C][C]0.414922[/C][/ROW]
[ROW][C]52[/C][C]0.041819[/C][C]0.3185[/C][C]0.375631[/C][/ROW]
[ROW][C]53[/C][C]-0.030062[/C][C]-0.2289[/C][C]0.409859[/C][/ROW]
[ROW][C]54[/C][C]-0.002498[/C][C]-0.019[/C][C]0.492444[/C][/ROW]
[ROW][C]55[/C][C]0.014425[/C][C]0.1099[/C][C]0.456452[/C][/ROW]
[ROW][C]56[/C][C]0.007723[/C][C]0.0588[/C][C]0.476651[/C][/ROW]
[ROW][C]57[/C][C]-0.005132[/C][C]-0.0391[/C][C]0.48448[/C][/ROW]
[ROW][C]58[/C][C]NA[/C][C]NA[/C][C]NA[/C][/ROW]
[ROW][C]59[/C][C]NA[/C][C]NA[/C][C]NA[/C][/ROW]
[ROW][C]60[/C][C]NA[/C][C]NA[/C][C]NA[/C][/ROW]
[/TABLE]
Source: https://freestatistics.org/blog/index.php?pk=69884&T=1

Globally Unique Identifier (entire table): ba.freestatistics.org/blog/index.php?pk=69884&T=1

As an alternative you can also use a QR Code:  

The GUIDs for individual cells are displayed in the table below:

Autocorrelation Function
Time lag kACF(k)T-STATP-value
1-0.318822-2.42810.009151
2-0.170349-1.29730.099826
30.1529411.16480.124441
4-0.054022-0.41140.341139
50.0779950.5940.277413
6-0.104744-0.79770.214148
70.002160.01640.493466
80.1663151.26660.105178
9-0.165462-1.26010.106336
10-0.131707-1.00310.160001
110.0906310.69020.246404
120.0679810.51770.303309
130.0386610.29440.384738
140.016760.12760.449437
15-0.178541-1.35970.08959
160.0857390.6530.258179
170.0440960.33580.369108
18-0.116362-0.88620.189588
190.0461330.35130.363304
200.0133520.10170.459679
210.1176350.89590.187011
22-0.307712-2.34350.011278
230.0387170.29490.384576
240.1988421.51430.067686
250.0216480.16490.434812
26-0.103568-0.78880.216735
27-0.023444-0.17850.429459
280.0566070.43110.333996
290.0292990.22310.412107
30-0.14116-1.0750.143404
310.1292350.98420.164546
320.0549630.41860.338532
33-0.084932-0.64680.260148
34-0.061908-0.47150.319535
350.0195030.14850.441219
36-0.004839-0.03690.485364
370.0804430.61260.271255
38-0.058039-0.4420.330063
39-0.051349-0.39110.348592
400.0584890.44540.328831
41-0.08432-0.64220.26165
420.0042490.03240.48715
430.0302350.23030.40935
44-0.020773-0.15820.437425
450.0333340.25390.400248
46-0.021444-0.16330.43542
47-0.077591-0.59090.278436
480.0805460.61340.270998
490.0260810.19860.421623
500.0005680.00430.498283
51-0.028346-0.21590.414922
520.0418190.31850.375631
53-0.030062-0.22890.409859
54-0.002498-0.0190.492444
550.0144250.10990.456452
560.0077230.05880.476651
57-0.005132-0.03910.48448
58NANANA
59NANANA
60NANANA


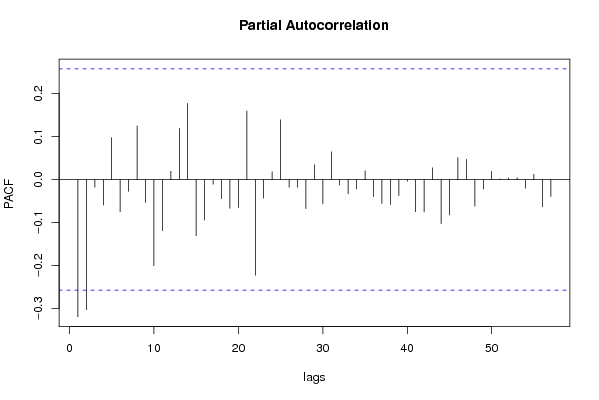
Partial Autocorrelation Function
Time lag kPACF(k)T-STATP-value
1-0.318822-2.42810.009151
2-0.302772-2.30580.012357
3-0.017578-0.13390.446984
4-0.058975-0.44910.327502
50.0976860.7440.229954
6-0.074674-0.56870.285878
7-0.027337-0.20820.417904
80.1247330.94990.173042
9-0.053584-0.40810.342356
10-0.200246-1.5250.066344
11-0.118785-0.90460.1847
120.0192990.1470.441829
130.1189810.90610.184308
140.1772211.34970.091182
15-0.13055-0.99420.162118
16-0.094023-0.71610.238414
17-0.010607-0.08080.467948
18-0.044323-0.33760.36846
19-0.066744-0.50830.306584
20-0.065034-0.49530.311135
210.1593471.21350.114919
22-0.222241-1.69250.047955
23-0.043009-0.32750.372216
240.0181980.13860.445125
250.1391021.05940.146911
26-0.018056-0.13750.445552
27-0.017728-0.1350.446536
28-0.067474-0.51390.304649
290.0346880.26420.396291
30-0.05627-0.42850.334924
310.0647090.49280.312003
32-0.012605-0.0960.461928
33-0.032708-0.24910.402084
34-0.021811-0.16610.434325
350.0203080.15470.438812
36-0.039607-0.30160.382004
37-0.055338-0.42140.337496
38-0.058133-0.44270.329806
39-0.037238-0.28360.388864
40-0.003742-0.02850.488681
41-0.074563-0.56790.286163
42-0.075333-0.57370.284187
430.0273120.2080.417977
44-0.102378-0.77970.219373
45-0.082103-0.62530.267121
460.0513880.39140.348483
470.0469040.35720.361114
48-0.061876-0.47120.319622
49-0.022067-0.16810.433562
500.0188060.14320.443307
510.0014810.01130.49552
520.003890.02960.488235
530.0042810.03260.487051
54-0.019866-0.15130.440134
550.0121520.09250.463291
56-0.062967-0.47950.316679
57-0.039345-0.29960.38276
58NANANA
59NANANA
60NANANA

\begin{tabular}{lllllllll}
\hline
Partial Autocorrelation Function \tabularnewline
Time lag k & PACF(k) & T-STAT & P-value \tabularnewline
1 & -0.318822 & -2.4281 & 0.009151 \tabularnewline
2 & -0.302772 & -2.3058 & 0.012357 \tabularnewline
3 & -0.017578 & -0.1339 & 0.446984 \tabularnewline
4 & -0.058975 & -0.4491 & 0.327502 \tabularnewline
5 & 0.097686 & 0.744 & 0.229954 \tabularnewline
6 & -0.074674 & -0.5687 & 0.285878 \tabularnewline
7 & -0.027337 & -0.2082 & 0.417904 \tabularnewline
8 & 0.124733 & 0.9499 & 0.173042 \tabularnewline
9 & -0.053584 & -0.4081 & 0.342356 \tabularnewline
10 & -0.200246 & -1.525 & 0.066344 \tabularnewline
11 & -0.118785 & -0.9046 & 0.1847 \tabularnewline
12 & 0.019299 & 0.147 & 0.441829 \tabularnewline
13 & 0.118981 & 0.9061 & 0.184308 \tabularnewline
14 & 0.177221 & 1.3497 & 0.091182 \tabularnewline
15 & -0.13055 & -0.9942 & 0.162118 \tabularnewline
16 & -0.094023 & -0.7161 & 0.238414 \tabularnewline
17 & -0.010607 & -0.0808 & 0.467948 \tabularnewline
18 & -0.044323 & -0.3376 & 0.36846 \tabularnewline
19 & -0.066744 & -0.5083 & 0.306584 \tabularnewline
20 & -0.065034 & -0.4953 & 0.311135 \tabularnewline
21 & 0.159347 & 1.2135 & 0.114919 \tabularnewline
22 & -0.222241 & -1.6925 & 0.047955 \tabularnewline
23 & -0.043009 & -0.3275 & 0.372216 \tabularnewline
24 & 0.018198 & 0.1386 & 0.445125 \tabularnewline
25 & 0.139102 & 1.0594 & 0.146911 \tabularnewline
26 & -0.018056 & -0.1375 & 0.445552 \tabularnewline
27 & -0.017728 & -0.135 & 0.446536 \tabularnewline
28 & -0.067474 & -0.5139 & 0.304649 \tabularnewline
29 & 0.034688 & 0.2642 & 0.396291 \tabularnewline
30 & -0.05627 & -0.4285 & 0.334924 \tabularnewline
31 & 0.064709 & 0.4928 & 0.312003 \tabularnewline
32 & -0.012605 & -0.096 & 0.461928 \tabularnewline
33 & -0.032708 & -0.2491 & 0.402084 \tabularnewline
34 & -0.021811 & -0.1661 & 0.434325 \tabularnewline
35 & 0.020308 & 0.1547 & 0.438812 \tabularnewline
36 & -0.039607 & -0.3016 & 0.382004 \tabularnewline
37 & -0.055338 & -0.4214 & 0.337496 \tabularnewline
38 & -0.058133 & -0.4427 & 0.329806 \tabularnewline
39 & -0.037238 & -0.2836 & 0.388864 \tabularnewline
40 & -0.003742 & -0.0285 & 0.488681 \tabularnewline
41 & -0.074563 & -0.5679 & 0.286163 \tabularnewline
42 & -0.075333 & -0.5737 & 0.284187 \tabularnewline
43 & 0.027312 & 0.208 & 0.417977 \tabularnewline
44 & -0.102378 & -0.7797 & 0.219373 \tabularnewline
45 & -0.082103 & -0.6253 & 0.267121 \tabularnewline
46 & 0.051388 & 0.3914 & 0.348483 \tabularnewline
47 & 0.046904 & 0.3572 & 0.361114 \tabularnewline
48 & -0.061876 & -0.4712 & 0.319622 \tabularnewline
49 & -0.022067 & -0.1681 & 0.433562 \tabularnewline
50 & 0.018806 & 0.1432 & 0.443307 \tabularnewline
51 & 0.001481 & 0.0113 & 0.49552 \tabularnewline
52 & 0.00389 & 0.0296 & 0.488235 \tabularnewline
53 & 0.004281 & 0.0326 & 0.487051 \tabularnewline
54 & -0.019866 & -0.1513 & 0.440134 \tabularnewline
55 & 0.012152 & 0.0925 & 0.463291 \tabularnewline
56 & -0.062967 & -0.4795 & 0.316679 \tabularnewline
57 & -0.039345 & -0.2996 & 0.38276 \tabularnewline
58 & NA & NA & NA \tabularnewline
59 & NA & NA & NA \tabularnewline
60 & NA & NA & NA \tabularnewline
\hline
\end{tabular}
%Source: https://freestatistics.org/blog/index.php?pk=69884&T=2

[TABLE]
[ROW][C]Partial Autocorrelation Function[/C][/ROW]
[ROW][C]Time lag k[/C][C]PACF(k)[/C][C]T-STAT[/C][C]P-value[/C][/ROW]
[ROW][C]1[/C][C]-0.318822[/C][C]-2.4281[/C][C]0.009151[/C][/ROW]
[ROW][C]2[/C][C]-0.302772[/C][C]-2.3058[/C][C]0.012357[/C][/ROW]
[ROW][C]3[/C][C]-0.017578[/C][C]-0.1339[/C][C]0.446984[/C][/ROW]
[ROW][C]4[/C][C]-0.058975[/C][C]-0.4491[/C][C]0.327502[/C][/ROW]
[ROW][C]5[/C][C]0.097686[/C][C]0.744[/C][C]0.229954[/C][/ROW]
[ROW][C]6[/C][C]-0.074674[/C][C]-0.5687[/C][C]0.285878[/C][/ROW]
[ROW][C]7[/C][C]-0.027337[/C][C]-0.2082[/C][C]0.417904[/C][/ROW]
[ROW][C]8[/C][C]0.124733[/C][C]0.9499[/C][C]0.173042[/C][/ROW]
[ROW][C]9[/C][C]-0.053584[/C][C]-0.4081[/C][C]0.342356[/C][/ROW]
[ROW][C]10[/C][C]-0.200246[/C][C]-1.525[/C][C]0.066344[/C][/ROW]
[ROW][C]11[/C][C]-0.118785[/C][C]-0.9046[/C][C]0.1847[/C][/ROW]
[ROW][C]12[/C][C]0.019299[/C][C]0.147[/C][C]0.441829[/C][/ROW]
[ROW][C]13[/C][C]0.118981[/C][C]0.9061[/C][C]0.184308[/C][/ROW]
[ROW][C]14[/C][C]0.177221[/C][C]1.3497[/C][C]0.091182[/C][/ROW]
[ROW][C]15[/C][C]-0.13055[/C][C]-0.9942[/C][C]0.162118[/C][/ROW]
[ROW][C]16[/C][C]-0.094023[/C][C]-0.7161[/C][C]0.238414[/C][/ROW]
[ROW][C]17[/C][C]-0.010607[/C][C]-0.0808[/C][C]0.467948[/C][/ROW]
[ROW][C]18[/C][C]-0.044323[/C][C]-0.3376[/C][C]0.36846[/C][/ROW]
[ROW][C]19[/C][C]-0.066744[/C][C]-0.5083[/C][C]0.306584[/C][/ROW]
[ROW][C]20[/C][C]-0.065034[/C][C]-0.4953[/C][C]0.311135[/C][/ROW]
[ROW][C]21[/C][C]0.159347[/C][C]1.2135[/C][C]0.114919[/C][/ROW]
[ROW][C]22[/C][C]-0.222241[/C][C]-1.6925[/C][C]0.047955[/C][/ROW]
[ROW][C]23[/C][C]-0.043009[/C][C]-0.3275[/C][C]0.372216[/C][/ROW]
[ROW][C]24[/C][C]0.018198[/C][C]0.1386[/C][C]0.445125[/C][/ROW]
[ROW][C]25[/C][C]0.139102[/C][C]1.0594[/C][C]0.146911[/C][/ROW]
[ROW][C]26[/C][C]-0.018056[/C][C]-0.1375[/C][C]0.445552[/C][/ROW]
[ROW][C]27[/C][C]-0.017728[/C][C]-0.135[/C][C]0.446536[/C][/ROW]
[ROW][C]28[/C][C]-0.067474[/C][C]-0.5139[/C][C]0.304649[/C][/ROW]
[ROW][C]29[/C][C]0.034688[/C][C]0.2642[/C][C]0.396291[/C][/ROW]
[ROW][C]30[/C][C]-0.05627[/C][C]-0.4285[/C][C]0.334924[/C][/ROW]
[ROW][C]31[/C][C]0.064709[/C][C]0.4928[/C][C]0.312003[/C][/ROW]
[ROW][C]32[/C][C]-0.012605[/C][C]-0.096[/C][C]0.461928[/C][/ROW]
[ROW][C]33[/C][C]-0.032708[/C][C]-0.2491[/C][C]0.402084[/C][/ROW]
[ROW][C]34[/C][C]-0.021811[/C][C]-0.1661[/C][C]0.434325[/C][/ROW]
[ROW][C]35[/C][C]0.020308[/C][C]0.1547[/C][C]0.438812[/C][/ROW]
[ROW][C]36[/C][C]-0.039607[/C][C]-0.3016[/C][C]0.382004[/C][/ROW]
[ROW][C]37[/C][C]-0.055338[/C][C]-0.4214[/C][C]0.337496[/C][/ROW]
[ROW][C]38[/C][C]-0.058133[/C][C]-0.4427[/C][C]0.329806[/C][/ROW]
[ROW][C]39[/C][C]-0.037238[/C][C]-0.2836[/C][C]0.388864[/C][/ROW]
[ROW][C]40[/C][C]-0.003742[/C][C]-0.0285[/C][C]0.488681[/C][/ROW]
[ROW][C]41[/C][C]-0.074563[/C][C]-0.5679[/C][C]0.286163[/C][/ROW]
[ROW][C]42[/C][C]-0.075333[/C][C]-0.5737[/C][C]0.284187[/C][/ROW]
[ROW][C]43[/C][C]0.027312[/C][C]0.208[/C][C]0.417977[/C][/ROW]
[ROW][C]44[/C][C]-0.102378[/C][C]-0.7797[/C][C]0.219373[/C][/ROW]
[ROW][C]45[/C][C]-0.082103[/C][C]-0.6253[/C][C]0.267121[/C][/ROW]
[ROW][C]46[/C][C]0.051388[/C][C]0.3914[/C][C]0.348483[/C][/ROW]
[ROW][C]47[/C][C]0.046904[/C][C]0.3572[/C][C]0.361114[/C][/ROW]
[ROW][C]48[/C][C]-0.061876[/C][C]-0.4712[/C][C]0.319622[/C][/ROW]
[ROW][C]49[/C][C]-0.022067[/C][C]-0.1681[/C][C]0.433562[/C][/ROW]
[ROW][C]50[/C][C]0.018806[/C][C]0.1432[/C][C]0.443307[/C][/ROW]
[ROW][C]51[/C][C]0.001481[/C][C]0.0113[/C][C]0.49552[/C][/ROW]
[ROW][C]52[/C][C]0.00389[/C][C]0.0296[/C][C]0.488235[/C][/ROW]
[ROW][C]53[/C][C]0.004281[/C][C]0.0326[/C][C]0.487051[/C][/ROW]
[ROW][C]54[/C][C]-0.019866[/C][C]-0.1513[/C][C]0.440134[/C][/ROW]
[ROW][C]55[/C][C]0.012152[/C][C]0.0925[/C][C]0.463291[/C][/ROW]
[ROW][C]56[/C][C]-0.062967[/C][C]-0.4795[/C][C]0.316679[/C][/ROW]
[ROW][C]57[/C][C]-0.039345[/C][C]-0.2996[/C][C]0.38276[/C][/ROW]
[ROW][C]58[/C][C]NA[/C][C]NA[/C][C]NA[/C][/ROW]
[ROW][C]59[/C][C]NA[/C][C]NA[/C][C]NA[/C][/ROW]
[ROW][C]60[/C][C]NA[/C][C]NA[/C][C]NA[/C][/ROW]
[/TABLE]
Source: https://freestatistics.org/blog/index.php?pk=69884&T=2

Globally Unique Identifier (entire table): ba.freestatistics.org/blog/index.php?pk=69884&T=2

As an alternative you can also use a QR Code:  

The GUIDs for individual cells are displayed in the table below:

Partial Autocorrelation Function
Time lag kPACF(k)T-STATP-value
1-0.318822-2.42810.009151
2-0.302772-2.30580.012357
3-0.017578-0.13390.446984
4-0.058975-0.44910.327502
50.0976860.7440.229954
6-0.074674-0.56870.285878
7-0.027337-0.20820.417904
80.1247330.94990.173042
9-0.053584-0.40810.342356
10-0.200246-1.5250.066344
11-0.118785-0.90460.1847
120.0192990.1470.441829
130.1189810.90610.184308
140.1772211.34970.091182
15-0.13055-0.99420.162118
16-0.094023-0.71610.238414
17-0.010607-0.08080.467948
18-0.044323-0.33760.36846
19-0.066744-0.50830.306584
20-0.065034-0.49530.311135
210.1593471.21350.114919
22-0.222241-1.69250.047955
23-0.043009-0.32750.372216
240.0181980.13860.445125
250.1391021.05940.146911
26-0.018056-0.13750.445552
27-0.017728-0.1350.446536
28-0.067474-0.51390.304649
290.0346880.26420.396291
30-0.05627-0.42850.334924
310.0647090.49280.312003
32-0.012605-0.0960.461928
33-0.032708-0.24910.402084
34-0.021811-0.16610.434325
350.0203080.15470.438812
36-0.039607-0.30160.382004
37-0.055338-0.42140.337496
38-0.058133-0.44270.329806
39-0.037238-0.28360.388864
40-0.003742-0.02850.488681
41-0.074563-0.56790.286163
42-0.075333-0.57370.284187
430.0273120.2080.417977
44-0.102378-0.77970.219373
45-0.082103-0.62530.267121
460.0513880.39140.348483
470.0469040.35720.361114
48-0.061876-0.47120.319622
49-0.022067-0.16810.433562
500.0188060.14320.443307
510.0014810.01130.49552
520.003890.02960.488235
530.0042810.03260.487051
54-0.019866-0.15130.440134
550.0121520.09250.463291
56-0.062967-0.47950.316679
57-0.039345-0.29960.38276
58NANANA
59NANANA
60NANANA


Parameters (Session):
par1 = 60 ; par2 = 1 ; par3 = 1 ; par4 = 0 ; par5 = 12 ; par6 = MA ; par7 = 0.95 ;
Parameters (R input):
par1 = 60 ; par2 = 1 ; par3 = 1 ; par4 = 0 ; par5 = 12 ; par6 = MA ; par7 = 0.95 ;
R code (references can be found in the software module):
if (par1 == 'Default') {
par1 = 10*log10(length(x))
} else {
par1 <- as.numeric(par1)
}
par2 <- as.numeric(par2)
par3 <- as.numeric(par3)
par4 <- as.numeric(par4)
par5 <- as.numeric(par5)
if (par6 == 'White Noise') par6 <- 'white' else par6 <- 'ma'
par7 <- as.numeric(par7)
if (par2 == 0) {
x <- log(x)
} else {
x <- (x ^ par2 - 1) / par2
}
if (par3 > 0) x <- diff(x,lag=1,difference=par3)
if (par4 > 0) x <- diff(x,lag=par5,difference=par4)
bitmap(file='pic1.png')
racf <- acf(x, par1, main='Autocorrelation', xlab='time lag', ylab='ACF', ci.type=par6, ci=par7, sub=paste('(lambda=',par2,', d=',par3,', D=',par4,', CI=', par7, ', CI type=',par6,')',sep=''))
dev.off()
bitmap(file='pic2.png')
rpacf <- pacf(x,par1,main='Partial Autocorrelation',xlab='lags',ylab='PACF')
dev.off()
(myacf <- c(racf$acf))
(mypacf <- c(rpacf$acf))
lengthx <- length(x)
sqrtn <- sqrt(lengthx)
load(file='createtable')
a<-table.start()
a<-table.row.start(a)
a<-table.element(a,'Autocorrelation Function',4,TRUE)
a<-table.row.end(a)
a<-table.row.start(a)
a<-table.element(a,'Time lag k',header=TRUE)
a<-table.element(a,hyperlink('basics.htm','ACF(k)','click here for more information about the Autocorrelation Function'),header=TRUE)
a<-table.element(a,'T-STAT',header=TRUE)
a<-table.element(a,'P-value',header=TRUE)
a<-table.row.end(a)
for (i in 2:(par1+1)) {
a<-table.row.start(a)
a<-table.element(a,i-1,header=TRUE)
a<-table.element(a,round(myacf[i],6))
mytstat <- myacf[i]*sqrtn
a<-table.element(a,round(mytstat,4))
a<-table.element(a,round(1-pt(abs(mytstat),lengthx),6))
a<-table.row.end(a)
}
a<-table.end(a)
table.save(a,file='mytable.tab')
a<-table.start()
a<-table.row.start(a)
a<-table.element(a,'Partial Autocorrelation Function',4,TRUE)
a<-table.row.end(a)
a<-table.row.start(a)
a<-table.element(a,'Time lag k',header=TRUE)
a<-table.element(a,hyperlink('basics.htm','PACF(k)','click here for more information about the Partial Autocorrelation Function'),header=TRUE)
a<-table.element(a,'T-STAT',header=TRUE)
a<-table.element(a,'P-value',header=TRUE)
a<-table.row.end(a)
for (i in 1:par1) {
a<-table.row.start(a)
a<-table.element(a,i,header=TRUE)
a<-table.element(a,round(mypacf[i],6))
mytstat <- mypacf[i]*sqrtn
a<-table.element(a,round(mytstat,4))
a<-table.element(a,round(1-pt(abs(mytstat),lengthx),6))
a<-table.row.end(a)
}
a<-table.end(a)
table.save(a,file='mytable1.tab')