Free Statistics

of Irreproducible Research!

Author's title

Author*The author of this computation has been verified*
R Software Modulerwasp_multipleregression.wasp
Title produced by softwareMultiple Regression
Date of computationSun, 20 Dec 2009 05:56:21 -0700
Cite this page as followsStatistical Computations at FreeStatistics.org, Office for Research Development and Education, URL https://freestatistics.org/blog/index.php?v=date/2009/Dec/20/t1261317869sjn2k1j62v0qlr1.htm/, Retrieved Sat, 27 Apr 2024 12:48:09 +0000
Statistical Computations at FreeStatistics.org, Office for Research Development and Education, URL https://freestatistics.org/blog/index.php?pk=69887, Retrieved Sat, 27 Apr 2024 12:48:09 +0000
QR Codes:

Original text written by user:
IsPrivate?No (this computation is public)
User-defined keywords
Estimated Impact99
Family? (F = Feedback message, R = changed R code, M = changed R Module, P = changed Parameters, D = changed Data)
-     [Multiple Regression] [Q1 The Seatbeltlaw] [2007-11-14 19:27:43] [8cd6641b921d30ebe00b648d1481bba0]
- RM D  [Multiple Regression] [Seatbelt] [2009-11-12 14:06:21] [b98453cac15ba1066b407e146608df68]
-    D      [Multiple Regression] [] [2009-12-20 12:56:21] [aa8eb70c35ea8a87edcd21d6427e653e] [Current]
Feedback Forum

Post a new message
Dataseries X:
2849,27	10872
2921,44	10625
2981,85	10407
3080,58	10463
3106,22	10556
3119,31	10646
3061,26	10702
3097,31	11353
3161,69	11346
3257,16	11451
3277,01	11964
3295,32	12574
3363,99	13031
3494,17	13812
3667,03	14544
3813,06	14931
3917,96	14886
3895,51	16005
3801,06	17064
3570,12	15168
3701,61	16050
3862,27	15839
3970,1	15137
4138,52	14954
4199,75	15648
4290,89	15305
4443,91	15579
4502,64	16348
4356,98	15928
4591,27	16171
4696,96	15937
4621,4	15713
4562,84	15594
4202,52	15683
4296,49	16438
4435,23	17032
4105,18	17696
4116,68	17745
3844,49	19394
3720,98	20148
3674,4	20108
3857,62	18584
3801,06	18441
3504,37	18391
3032,6	19178
3047,03	18079
2962,34	18483
2197,82	19644
2014,45	19195
1862,83	19650
1905,41	20830
1810,99	23595
1670,07	22937
1864,44	21814
2052,02	21928
2029,6	21777
2070,83	21383
2293,41	21467
2443,27	22052
2513,17	22680


Summary of computational transaction
Raw Inputview raw input (R code)
Raw Outputview raw output of R engine
Computing time4 seconds
R Server'Gwilym Jenkins' @ 72.249.127.135

\begin{tabular}{lllllllll}
\hline
Summary of computational transaction \tabularnewline
Raw Input & view raw input (R code)  \tabularnewline
Raw Output & view raw output of R engine  \tabularnewline
Computing time & 4 seconds \tabularnewline
R Server & 'Gwilym Jenkins' @ 72.249.127.135 \tabularnewline
\hline
\end{tabular}
%Source: https://freestatistics.org/blog/index.php?pk=69887&T=0

[TABLE]
[ROW][C]Summary of computational transaction[/C][/ROW]
[ROW][C]Raw Input[/C][C]view raw input (R code) [/C][/ROW]
[ROW][C]Raw Output[/C][C]view raw output of R engine [/C][/ROW]
[ROW][C]Computing time[/C][C]4 seconds[/C][/ROW]
[ROW][C]R Server[/C][C]'Gwilym Jenkins' @ 72.249.127.135[/C][/ROW]
[/TABLE]
Source: https://freestatistics.org/blog/index.php?pk=69887&T=0

Globally Unique Identifier (entire table): ba.freestatistics.org/blog/index.php?pk=69887&T=0

As an alternative you can also use a QR Code:  

The GUIDs for individual cells are displayed in the table below:

Summary of computational transaction
Raw Inputview raw input (R code)
Raw Outputview raw output of R engine
Computing time4 seconds
R Server'Gwilym Jenkins' @ 72.249.127.135


Multiple Linear Regression - Estimated Regression Equation
Y[t] = + 4631.31499317083 -0.0601286484348822X[t] -217.697070655946M1[t] -171.152424772174M2[t] -88.8065967430589M3[t] -7.2881058426518M4[t] -53.1668728563952M5[t] + 60.4791439189899M6[t] + 95.079829363615M7[t] -35.4023754623143M8[t] -72.7180483006568M9[t] -51.051837586295M10[t] + 32.5249358282749M11[t] -7.51276375132147t + e[t]

\begin{tabular}{lllllllll}
\hline
Multiple Linear Regression - Estimated Regression Equation \tabularnewline
Y[t] =  +  4631.31499317083 -0.0601286484348822X[t] -217.697070655946M1[t] -171.152424772174M2[t] -88.8065967430589M3[t] -7.2881058426518M4[t] -53.1668728563952M5[t] +  60.4791439189899M6[t] +  95.079829363615M7[t] -35.4023754623143M8[t] -72.7180483006568M9[t] -51.051837586295M10[t] +  32.5249358282749M11[t] -7.51276375132147t  + e[t] \tabularnewline
\hline
\end{tabular}
%Source: https://freestatistics.org/blog/index.php?pk=69887&T=1

[TABLE]
[ROW][C]Multiple Linear Regression - Estimated Regression Equation[/C][/ROW]
[ROW][C]Y[t] =  +  4631.31499317083 -0.0601286484348822X[t] -217.697070655946M1[t] -171.152424772174M2[t] -88.8065967430589M3[t] -7.2881058426518M4[t] -53.1668728563952M5[t] +  60.4791439189899M6[t] +  95.079829363615M7[t] -35.4023754623143M8[t] -72.7180483006568M9[t] -51.051837586295M10[t] +  32.5249358282749M11[t] -7.51276375132147t  + e[t][/C][/ROW]
[/TABLE]
Source: https://freestatistics.org/blog/index.php?pk=69887&T=1

Globally Unique Identifier (entire table): ba.freestatistics.org/blog/index.php?pk=69887&T=1

As an alternative you can also use a QR Code:  

The GUIDs for individual cells are displayed in the table below:

Multiple Linear Regression - Estimated Regression Equation
Y[t] = + 4631.31499317083 -0.0601286484348822X[t] -217.697070655946M1[t] -171.152424772174M2[t] -88.8065967430589M3[t] -7.2881058426518M4[t] -53.1668728563952M5[t] + 60.4791439189899M6[t] + 95.079829363615M7[t] -35.4023754623143M8[t] -72.7180483006568M9[t] -51.051837586295M10[t] + 32.5249358282749M11[t] -7.51276375132147t + e[t]


Multiple Linear Regression - Ordinary Least Squares
VariableParameterS.D.T-STATH0: parameter = 02-tail p-value1-tail p-value
(Intercept)4631.314993170831380.1361383.35570.0015950.000797
X-0.06012864843488220.130735-0.45990.6477360.323868
M1-217.697070655946562.582197-0.3870.700570.350285
M2-171.152424772174561.439817-0.30480.7618590.380929
M3-88.8065967430589566.524246-0.15680.8761220.438061
M4-7.2881058426518587.798332-0.01240.9901610.49508
M5-53.1668728563952572.844379-0.09280.9264560.463228
M660.4791439189899562.5675380.10750.9148550.457428
M795.079829363615561.5949020.16930.86630.43315
M8-35.4023754623143557.946298-0.06350.9496820.474841
M9-72.7180483006568557.621901-0.13040.8968130.448406
M10-51.051837586295560.624488-0.09110.9278380.463919
M1132.5249358282749559.2011490.05820.9538710.476935
t-7.5127637513214727.799471-0.27020.7881780.394089

\begin{tabular}{lllllllll}
\hline
Multiple Linear Regression - Ordinary Least Squares \tabularnewline
Variable & Parameter & S.D. & T-STATH0: parameter = 0 & 2-tail p-value & 1-tail p-value \tabularnewline
(Intercept) & 4631.31499317083 & 1380.136138 & 3.3557 & 0.001595 & 0.000797 \tabularnewline
X & -0.0601286484348822 & 0.130735 & -0.4599 & 0.647736 & 0.323868 \tabularnewline
M1 & -217.697070655946 & 562.582197 & -0.387 & 0.70057 & 0.350285 \tabularnewline
M2 & -171.152424772174 & 561.439817 & -0.3048 & 0.761859 & 0.380929 \tabularnewline
M3 & -88.8065967430589 & 566.524246 & -0.1568 & 0.876122 & 0.438061 \tabularnewline
M4 & -7.2881058426518 & 587.798332 & -0.0124 & 0.990161 & 0.49508 \tabularnewline
M5 & -53.1668728563952 & 572.844379 & -0.0928 & 0.926456 & 0.463228 \tabularnewline
M6 & 60.4791439189899 & 562.567538 & 0.1075 & 0.914855 & 0.457428 \tabularnewline
M7 & 95.079829363615 & 561.594902 & 0.1693 & 0.8663 & 0.43315 \tabularnewline
M8 & -35.4023754623143 & 557.946298 & -0.0635 & 0.949682 & 0.474841 \tabularnewline
M9 & -72.7180483006568 & 557.621901 & -0.1304 & 0.896813 & 0.448406 \tabularnewline
M10 & -51.051837586295 & 560.624488 & -0.0911 & 0.927838 & 0.463919 \tabularnewline
M11 & 32.5249358282749 & 559.201149 & 0.0582 & 0.953871 & 0.476935 \tabularnewline
t & -7.51276375132147 & 27.799471 & -0.2702 & 0.788178 & 0.394089 \tabularnewline
\hline
\end{tabular}
%Source: https://freestatistics.org/blog/index.php?pk=69887&T=2

[TABLE]
[ROW][C]Multiple Linear Regression - Ordinary Least Squares[/C][/ROW]
[ROW][C]Variable[/C][C]Parameter[/C][C]S.D.[/C][C]T-STATH0: parameter = 0[/C][C]2-tail p-value[/C][C]1-tail p-value[/C][/ROW]
[ROW][C](Intercept)[/C][C]4631.31499317083[/C][C]1380.136138[/C][C]3.3557[/C][C]0.001595[/C][C]0.000797[/C][/ROW]
[ROW][C]X[/C][C]-0.0601286484348822[/C][C]0.130735[/C][C]-0.4599[/C][C]0.647736[/C][C]0.323868[/C][/ROW]
[ROW][C]M1[/C][C]-217.697070655946[/C][C]562.582197[/C][C]-0.387[/C][C]0.70057[/C][C]0.350285[/C][/ROW]
[ROW][C]M2[/C][C]-171.152424772174[/C][C]561.439817[/C][C]-0.3048[/C][C]0.761859[/C][C]0.380929[/C][/ROW]
[ROW][C]M3[/C][C]-88.8065967430589[/C][C]566.524246[/C][C]-0.1568[/C][C]0.876122[/C][C]0.438061[/C][/ROW]
[ROW][C]M4[/C][C]-7.2881058426518[/C][C]587.798332[/C][C]-0.0124[/C][C]0.990161[/C][C]0.49508[/C][/ROW]
[ROW][C]M5[/C][C]-53.1668728563952[/C][C]572.844379[/C][C]-0.0928[/C][C]0.926456[/C][C]0.463228[/C][/ROW]
[ROW][C]M6[/C][C]60.4791439189899[/C][C]562.567538[/C][C]0.1075[/C][C]0.914855[/C][C]0.457428[/C][/ROW]
[ROW][C]M7[/C][C]95.079829363615[/C][C]561.594902[/C][C]0.1693[/C][C]0.8663[/C][C]0.43315[/C][/ROW]
[ROW][C]M8[/C][C]-35.4023754623143[/C][C]557.946298[/C][C]-0.0635[/C][C]0.949682[/C][C]0.474841[/C][/ROW]
[ROW][C]M9[/C][C]-72.7180483006568[/C][C]557.621901[/C][C]-0.1304[/C][C]0.896813[/C][C]0.448406[/C][/ROW]
[ROW][C]M10[/C][C]-51.051837586295[/C][C]560.624488[/C][C]-0.0911[/C][C]0.927838[/C][C]0.463919[/C][/ROW]
[ROW][C]M11[/C][C]32.5249358282749[/C][C]559.201149[/C][C]0.0582[/C][C]0.953871[/C][C]0.476935[/C][/ROW]
[ROW][C]t[/C][C]-7.51276375132147[/C][C]27.799471[/C][C]-0.2702[/C][C]0.788178[/C][C]0.394089[/C][/ROW]
[/TABLE]
Source: https://freestatistics.org/blog/index.php?pk=69887&T=2

Globally Unique Identifier (entire table): ba.freestatistics.org/blog/index.php?pk=69887&T=2

As an alternative you can also use a QR Code:  

The GUIDs for individual cells are displayed in the table below:

Multiple Linear Regression - Ordinary Least Squares
VariableParameterS.D.T-STATH0: parameter = 02-tail p-value1-tail p-value
(Intercept)4631.314993170831380.1361383.35570.0015950.000797
X-0.06012864843488220.130735-0.45990.6477360.323868
M1-217.697070655946562.582197-0.3870.700570.350285
M2-171.152424772174561.439817-0.30480.7618590.380929
M3-88.8065967430589566.524246-0.15680.8761220.438061
M4-7.2881058426518587.798332-0.01240.9901610.49508
M5-53.1668728563952572.844379-0.09280.9264560.463228
M660.4791439189899562.5675380.10750.9148550.457428
M795.079829363615561.5949020.16930.86630.43315
M8-35.4023754623143557.946298-0.06350.9496820.474841
M9-72.7180483006568557.621901-0.13040.8968130.448406
M10-51.051837586295560.624488-0.09110.9278380.463919
M1132.5249358282749559.2011490.05820.9538710.476935
t-7.5127637513214727.799471-0.27020.7881780.394089


Multiple Linear Regression - Regression Statistics
Multiple R0.409740584844696
R-squared0.167887346868874
Adjusted R-squared-0.0672749246681839
F-TEST (value)0.713921267095847
F-TEST (DF numerator)13
F-TEST (DF denominator)46
p-value0.740144560883919
Multiple Linear Regression - Residual Statistics
Residual Standard Deviation881.049552609896
Sum Squared Residuals35707422.4510885

\begin{tabular}{lllllllll}
\hline
Multiple Linear Regression - Regression Statistics \tabularnewline
Multiple R & 0.409740584844696 \tabularnewline
R-squared & 0.167887346868874 \tabularnewline
Adjusted R-squared & -0.0672749246681839 \tabularnewline
F-TEST (value) & 0.713921267095847 \tabularnewline
F-TEST (DF numerator) & 13 \tabularnewline
F-TEST (DF denominator) & 46 \tabularnewline
p-value & 0.740144560883919 \tabularnewline
Multiple Linear Regression - Residual Statistics \tabularnewline
Residual Standard Deviation & 881.049552609896 \tabularnewline
Sum Squared Residuals & 35707422.4510885 \tabularnewline
\hline
\end{tabular}
%Source: https://freestatistics.org/blog/index.php?pk=69887&T=3

[TABLE]
[ROW][C]Multiple Linear Regression - Regression Statistics[/C][/ROW]
[ROW][C]Multiple R[/C][C]0.409740584844696[/C][/ROW]
[ROW][C]R-squared[/C][C]0.167887346868874[/C][/ROW]
[ROW][C]Adjusted R-squared[/C][C]-0.0672749246681839[/C][/ROW]
[ROW][C]F-TEST (value)[/C][C]0.713921267095847[/C][/ROW]
[ROW][C]F-TEST (DF numerator)[/C][C]13[/C][/ROW]
[ROW][C]F-TEST (DF denominator)[/C][C]46[/C][/ROW]
[ROW][C]p-value[/C][C]0.740144560883919[/C][/ROW]
[ROW][C]Multiple Linear Regression - Residual Statistics[/C][/ROW]
[ROW][C]Residual Standard Deviation[/C][C]881.049552609896[/C][/ROW]
[ROW][C]Sum Squared Residuals[/C][C]35707422.4510885[/C][/ROW]
[/TABLE]
Source: https://freestatistics.org/blog/index.php?pk=69887&T=3

Globally Unique Identifier (entire table): ba.freestatistics.org/blog/index.php?pk=69887&T=3

As an alternative you can also use a QR Code:  

The GUIDs for individual cells are displayed in the table below:

Multiple Linear Regression - Regression Statistics
Multiple R0.409740584844696
R-squared0.167887346868874
Adjusted R-squared-0.0672749246681839
F-TEST (value)0.713921267095847
F-TEST (DF numerator)13
F-TEST (DF denominator)46
p-value0.740144560883919
Multiple Linear Regression - Residual Statistics
Residual Standard Deviation881.049552609896
Sum Squared Residuals35707422.4510885


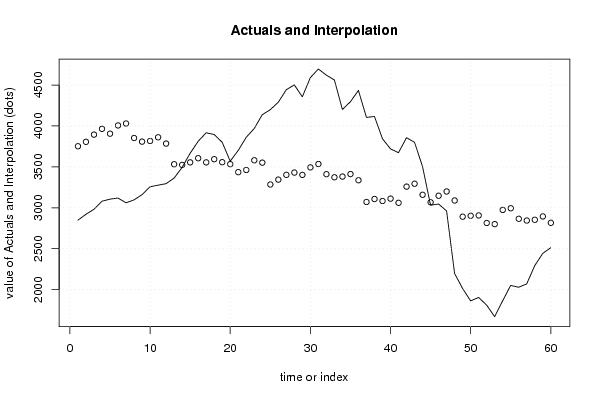
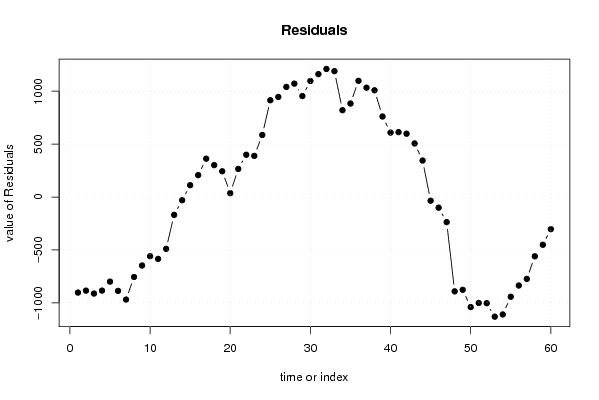
Multiple Linear Regression - Actuals, Interpolation, and Residuals
Time or IndexActualsInterpolationForecastResidualsPrediction Error
12849.273752.38649297954-903.116492979536
22921.443806.27015127539-884.830151275392
32981.853894.21126091199-912.361260911992
43080.583964.84978374872-884.269783748724
53106.223905.86628867921-799.646288679215
63119.314006.58796334414-887.27796334414
73061.264030.30868072509-969.048680725088
83097.313853.16996201673-755.85996201673
93161.693808.76242596611-647.07242596611
103257.163816.60236484349-559.442364843488
113277.013861.82037785964-584.810377859641
123295.323785.10420273477-489.784202734767
133363.993532.41557599276-168.425575992759
143494.173524.48698369757-30.3169836975661
153667.033555.30587732103111.724122678974
163813.063606.04181752581207.018182474188
173917.963555.35607594032362.603924059683
183895.513594.20537136575301.304628634253
193801.063557.61705436651243.442945633489
203570.123533.626003221836.4939967782032
213701.613435.76409871257265.845901287433
223862.273462.60469049537399.665309504633
233970.13580.8790113599389.220988640097
244138.523551.84485444389586.67514555611
254199.753284.90573802281914.844261977185
264290.893344.56174656843946.32825343157
274443.913402.919561175071040.99043882493
284502.643430.686357677731071.95364232227
294356.983402.54885925531954.431140744687
304591.273494.07085070971097.1991492903
314696.963535.228876136771161.73112386323
324621.43410.702724808931210.69727519107
334562.843373.029597383021189.81040261698
344202.523381.83159463535820.68840536465
354296.493412.49847473026883.991525269736
364435.233336.744357980351098.48564201965
374105.183071.609101012321033.57089898768
384116.683107.694679371461008.98532062854
393844.493083.37560238013761.114397619867
403720.983112.04432860932608.935671390683
413674.43061.05794378165613.342056218353
423857.623258.82725702047598.792742979528
433801.063294.51357543996506.546424560037
443504.373159.52503928446344.844960715543
453032.63067.37535637654-34.7753563765403
463047.033147.61018796952-100.580187969516
472962.343199.38222366507-237.042223665072
482197.823089.53516325258-891.715163252577
492014.452891.32309199257-876.873091992573
501862.832902.99643908715-1040.16643908715
511905.412906.87769821178-1001.46769821178
521810.992814.62771243842-1003.63771243842
531670.072800.80083234351-1130.73083234351
541864.442974.45855755994-1110.01855755994
552052.022994.69181333167-942.671813331672
562029.62865.77627066809-836.176270668088
572070.832844.63852156177-773.808521561767
582293.412853.74116205628-560.331162056278
592443.272894.62991238512-451.35991238512
602513.172816.83142158842-303.661421588418

\begin{tabular}{lllllllll}
\hline
Multiple Linear Regression - Actuals, Interpolation, and Residuals \tabularnewline
Time or Index & Actuals & InterpolationForecast & ResidualsPrediction Error \tabularnewline
1 & 2849.27 & 3752.38649297954 & -903.116492979536 \tabularnewline
2 & 2921.44 & 3806.27015127539 & -884.830151275392 \tabularnewline
3 & 2981.85 & 3894.21126091199 & -912.361260911992 \tabularnewline
4 & 3080.58 & 3964.84978374872 & -884.269783748724 \tabularnewline
5 & 3106.22 & 3905.86628867921 & -799.646288679215 \tabularnewline
6 & 3119.31 & 4006.58796334414 & -887.27796334414 \tabularnewline
7 & 3061.26 & 4030.30868072509 & -969.048680725088 \tabularnewline
8 & 3097.31 & 3853.16996201673 & -755.85996201673 \tabularnewline
9 & 3161.69 & 3808.76242596611 & -647.07242596611 \tabularnewline
10 & 3257.16 & 3816.60236484349 & -559.442364843488 \tabularnewline
11 & 3277.01 & 3861.82037785964 & -584.810377859641 \tabularnewline
12 & 3295.32 & 3785.10420273477 & -489.784202734767 \tabularnewline
13 & 3363.99 & 3532.41557599276 & -168.425575992759 \tabularnewline
14 & 3494.17 & 3524.48698369757 & -30.3169836975661 \tabularnewline
15 & 3667.03 & 3555.30587732103 & 111.724122678974 \tabularnewline
16 & 3813.06 & 3606.04181752581 & 207.018182474188 \tabularnewline
17 & 3917.96 & 3555.35607594032 & 362.603924059683 \tabularnewline
18 & 3895.51 & 3594.20537136575 & 301.304628634253 \tabularnewline
19 & 3801.06 & 3557.61705436651 & 243.442945633489 \tabularnewline
20 & 3570.12 & 3533.6260032218 & 36.4939967782032 \tabularnewline
21 & 3701.61 & 3435.76409871257 & 265.845901287433 \tabularnewline
22 & 3862.27 & 3462.60469049537 & 399.665309504633 \tabularnewline
23 & 3970.1 & 3580.8790113599 & 389.220988640097 \tabularnewline
24 & 4138.52 & 3551.84485444389 & 586.67514555611 \tabularnewline
25 & 4199.75 & 3284.90573802281 & 914.844261977185 \tabularnewline
26 & 4290.89 & 3344.56174656843 & 946.32825343157 \tabularnewline
27 & 4443.91 & 3402.91956117507 & 1040.99043882493 \tabularnewline
28 & 4502.64 & 3430.68635767773 & 1071.95364232227 \tabularnewline
29 & 4356.98 & 3402.54885925531 & 954.431140744687 \tabularnewline
30 & 4591.27 & 3494.0708507097 & 1097.1991492903 \tabularnewline
31 & 4696.96 & 3535.22887613677 & 1161.73112386323 \tabularnewline
32 & 4621.4 & 3410.70272480893 & 1210.69727519107 \tabularnewline
33 & 4562.84 & 3373.02959738302 & 1189.81040261698 \tabularnewline
34 & 4202.52 & 3381.83159463535 & 820.68840536465 \tabularnewline
35 & 4296.49 & 3412.49847473026 & 883.991525269736 \tabularnewline
36 & 4435.23 & 3336.74435798035 & 1098.48564201965 \tabularnewline
37 & 4105.18 & 3071.60910101232 & 1033.57089898768 \tabularnewline
38 & 4116.68 & 3107.69467937146 & 1008.98532062854 \tabularnewline
39 & 3844.49 & 3083.37560238013 & 761.114397619867 \tabularnewline
40 & 3720.98 & 3112.04432860932 & 608.935671390683 \tabularnewline
41 & 3674.4 & 3061.05794378165 & 613.342056218353 \tabularnewline
42 & 3857.62 & 3258.82725702047 & 598.792742979528 \tabularnewline
43 & 3801.06 & 3294.51357543996 & 506.546424560037 \tabularnewline
44 & 3504.37 & 3159.52503928446 & 344.844960715543 \tabularnewline
45 & 3032.6 & 3067.37535637654 & -34.7753563765403 \tabularnewline
46 & 3047.03 & 3147.61018796952 & -100.580187969516 \tabularnewline
47 & 2962.34 & 3199.38222366507 & -237.042223665072 \tabularnewline
48 & 2197.82 & 3089.53516325258 & -891.715163252577 \tabularnewline
49 & 2014.45 & 2891.32309199257 & -876.873091992573 \tabularnewline
50 & 1862.83 & 2902.99643908715 & -1040.16643908715 \tabularnewline
51 & 1905.41 & 2906.87769821178 & -1001.46769821178 \tabularnewline
52 & 1810.99 & 2814.62771243842 & -1003.63771243842 \tabularnewline
53 & 1670.07 & 2800.80083234351 & -1130.73083234351 \tabularnewline
54 & 1864.44 & 2974.45855755994 & -1110.01855755994 \tabularnewline
55 & 2052.02 & 2994.69181333167 & -942.671813331672 \tabularnewline
56 & 2029.6 & 2865.77627066809 & -836.176270668088 \tabularnewline
57 & 2070.83 & 2844.63852156177 & -773.808521561767 \tabularnewline
58 & 2293.41 & 2853.74116205628 & -560.331162056278 \tabularnewline
59 & 2443.27 & 2894.62991238512 & -451.35991238512 \tabularnewline
60 & 2513.17 & 2816.83142158842 & -303.661421588418 \tabularnewline
\hline
\end{tabular}
%Source: https://freestatistics.org/blog/index.php?pk=69887&T=4

[TABLE]
[ROW][C]Multiple Linear Regression - Actuals, Interpolation, and Residuals[/C][/ROW]
[ROW][C]Time or Index[/C][C]Actuals[/C][C]InterpolationForecast[/C][C]ResidualsPrediction Error[/C][/ROW]
[ROW][C]1[/C][C]2849.27[/C][C]3752.38649297954[/C][C]-903.116492979536[/C][/ROW]
[ROW][C]2[/C][C]2921.44[/C][C]3806.27015127539[/C][C]-884.830151275392[/C][/ROW]
[ROW][C]3[/C][C]2981.85[/C][C]3894.21126091199[/C][C]-912.361260911992[/C][/ROW]
[ROW][C]4[/C][C]3080.58[/C][C]3964.84978374872[/C][C]-884.269783748724[/C][/ROW]
[ROW][C]5[/C][C]3106.22[/C][C]3905.86628867921[/C][C]-799.646288679215[/C][/ROW]
[ROW][C]6[/C][C]3119.31[/C][C]4006.58796334414[/C][C]-887.27796334414[/C][/ROW]
[ROW][C]7[/C][C]3061.26[/C][C]4030.30868072509[/C][C]-969.048680725088[/C][/ROW]
[ROW][C]8[/C][C]3097.31[/C][C]3853.16996201673[/C][C]-755.85996201673[/C][/ROW]
[ROW][C]9[/C][C]3161.69[/C][C]3808.76242596611[/C][C]-647.07242596611[/C][/ROW]
[ROW][C]10[/C][C]3257.16[/C][C]3816.60236484349[/C][C]-559.442364843488[/C][/ROW]
[ROW][C]11[/C][C]3277.01[/C][C]3861.82037785964[/C][C]-584.810377859641[/C][/ROW]
[ROW][C]12[/C][C]3295.32[/C][C]3785.10420273477[/C][C]-489.784202734767[/C][/ROW]
[ROW][C]13[/C][C]3363.99[/C][C]3532.41557599276[/C][C]-168.425575992759[/C][/ROW]
[ROW][C]14[/C][C]3494.17[/C][C]3524.48698369757[/C][C]-30.3169836975661[/C][/ROW]
[ROW][C]15[/C][C]3667.03[/C][C]3555.30587732103[/C][C]111.724122678974[/C][/ROW]
[ROW][C]16[/C][C]3813.06[/C][C]3606.04181752581[/C][C]207.018182474188[/C][/ROW]
[ROW][C]17[/C][C]3917.96[/C][C]3555.35607594032[/C][C]362.603924059683[/C][/ROW]
[ROW][C]18[/C][C]3895.51[/C][C]3594.20537136575[/C][C]301.304628634253[/C][/ROW]
[ROW][C]19[/C][C]3801.06[/C][C]3557.61705436651[/C][C]243.442945633489[/C][/ROW]
[ROW][C]20[/C][C]3570.12[/C][C]3533.6260032218[/C][C]36.4939967782032[/C][/ROW]
[ROW][C]21[/C][C]3701.61[/C][C]3435.76409871257[/C][C]265.845901287433[/C][/ROW]
[ROW][C]22[/C][C]3862.27[/C][C]3462.60469049537[/C][C]399.665309504633[/C][/ROW]
[ROW][C]23[/C][C]3970.1[/C][C]3580.8790113599[/C][C]389.220988640097[/C][/ROW]
[ROW][C]24[/C][C]4138.52[/C][C]3551.84485444389[/C][C]586.67514555611[/C][/ROW]
[ROW][C]25[/C][C]4199.75[/C][C]3284.90573802281[/C][C]914.844261977185[/C][/ROW]
[ROW][C]26[/C][C]4290.89[/C][C]3344.56174656843[/C][C]946.32825343157[/C][/ROW]
[ROW][C]27[/C][C]4443.91[/C][C]3402.91956117507[/C][C]1040.99043882493[/C][/ROW]
[ROW][C]28[/C][C]4502.64[/C][C]3430.68635767773[/C][C]1071.95364232227[/C][/ROW]
[ROW][C]29[/C][C]4356.98[/C][C]3402.54885925531[/C][C]954.431140744687[/C][/ROW]
[ROW][C]30[/C][C]4591.27[/C][C]3494.0708507097[/C][C]1097.1991492903[/C][/ROW]
[ROW][C]31[/C][C]4696.96[/C][C]3535.22887613677[/C][C]1161.73112386323[/C][/ROW]
[ROW][C]32[/C][C]4621.4[/C][C]3410.70272480893[/C][C]1210.69727519107[/C][/ROW]
[ROW][C]33[/C][C]4562.84[/C][C]3373.02959738302[/C][C]1189.81040261698[/C][/ROW]
[ROW][C]34[/C][C]4202.52[/C][C]3381.83159463535[/C][C]820.68840536465[/C][/ROW]
[ROW][C]35[/C][C]4296.49[/C][C]3412.49847473026[/C][C]883.991525269736[/C][/ROW]
[ROW][C]36[/C][C]4435.23[/C][C]3336.74435798035[/C][C]1098.48564201965[/C][/ROW]
[ROW][C]37[/C][C]4105.18[/C][C]3071.60910101232[/C][C]1033.57089898768[/C][/ROW]
[ROW][C]38[/C][C]4116.68[/C][C]3107.69467937146[/C][C]1008.98532062854[/C][/ROW]
[ROW][C]39[/C][C]3844.49[/C][C]3083.37560238013[/C][C]761.114397619867[/C][/ROW]
[ROW][C]40[/C][C]3720.98[/C][C]3112.04432860932[/C][C]608.935671390683[/C][/ROW]
[ROW][C]41[/C][C]3674.4[/C][C]3061.05794378165[/C][C]613.342056218353[/C][/ROW]
[ROW][C]42[/C][C]3857.62[/C][C]3258.82725702047[/C][C]598.792742979528[/C][/ROW]
[ROW][C]43[/C][C]3801.06[/C][C]3294.51357543996[/C][C]506.546424560037[/C][/ROW]
[ROW][C]44[/C][C]3504.37[/C][C]3159.52503928446[/C][C]344.844960715543[/C][/ROW]
[ROW][C]45[/C][C]3032.6[/C][C]3067.37535637654[/C][C]-34.7753563765403[/C][/ROW]
[ROW][C]46[/C][C]3047.03[/C][C]3147.61018796952[/C][C]-100.580187969516[/C][/ROW]
[ROW][C]47[/C][C]2962.34[/C][C]3199.38222366507[/C][C]-237.042223665072[/C][/ROW]
[ROW][C]48[/C][C]2197.82[/C][C]3089.53516325258[/C][C]-891.715163252577[/C][/ROW]
[ROW][C]49[/C][C]2014.45[/C][C]2891.32309199257[/C][C]-876.873091992573[/C][/ROW]
[ROW][C]50[/C][C]1862.83[/C][C]2902.99643908715[/C][C]-1040.16643908715[/C][/ROW]
[ROW][C]51[/C][C]1905.41[/C][C]2906.87769821178[/C][C]-1001.46769821178[/C][/ROW]
[ROW][C]52[/C][C]1810.99[/C][C]2814.62771243842[/C][C]-1003.63771243842[/C][/ROW]
[ROW][C]53[/C][C]1670.07[/C][C]2800.80083234351[/C][C]-1130.73083234351[/C][/ROW]
[ROW][C]54[/C][C]1864.44[/C][C]2974.45855755994[/C][C]-1110.01855755994[/C][/ROW]
[ROW][C]55[/C][C]2052.02[/C][C]2994.69181333167[/C][C]-942.671813331672[/C][/ROW]
[ROW][C]56[/C][C]2029.6[/C][C]2865.77627066809[/C][C]-836.176270668088[/C][/ROW]
[ROW][C]57[/C][C]2070.83[/C][C]2844.63852156177[/C][C]-773.808521561767[/C][/ROW]
[ROW][C]58[/C][C]2293.41[/C][C]2853.74116205628[/C][C]-560.331162056278[/C][/ROW]
[ROW][C]59[/C][C]2443.27[/C][C]2894.62991238512[/C][C]-451.35991238512[/C][/ROW]
[ROW][C]60[/C][C]2513.17[/C][C]2816.83142158842[/C][C]-303.661421588418[/C][/ROW]
[/TABLE]
Source: https://freestatistics.org/blog/index.php?pk=69887&T=4

Globally Unique Identifier (entire table): ba.freestatistics.org/blog/index.php?pk=69887&T=4

As an alternative you can also use a QR Code:  

The GUIDs for individual cells are displayed in the table below:

Multiple Linear Regression - Actuals, Interpolation, and Residuals
Time or IndexActualsInterpolationForecastResidualsPrediction Error
12849.273752.38649297954-903.116492979536
22921.443806.27015127539-884.830151275392
32981.853894.21126091199-912.361260911992
43080.583964.84978374872-884.269783748724
53106.223905.86628867921-799.646288679215
63119.314006.58796334414-887.27796334414
73061.264030.30868072509-969.048680725088
83097.313853.16996201673-755.85996201673
93161.693808.76242596611-647.07242596611
103257.163816.60236484349-559.442364843488
113277.013861.82037785964-584.810377859641
123295.323785.10420273477-489.784202734767
133363.993532.41557599276-168.425575992759
143494.173524.48698369757-30.3169836975661
153667.033555.30587732103111.724122678974
163813.063606.04181752581207.018182474188
173917.963555.35607594032362.603924059683
183895.513594.20537136575301.304628634253
193801.063557.61705436651243.442945633489
203570.123533.626003221836.4939967782032
213701.613435.76409871257265.845901287433
223862.273462.60469049537399.665309504633
233970.13580.8790113599389.220988640097
244138.523551.84485444389586.67514555611
254199.753284.90573802281914.844261977185
264290.893344.56174656843946.32825343157
274443.913402.919561175071040.99043882493
284502.643430.686357677731071.95364232227
294356.983402.54885925531954.431140744687
304591.273494.07085070971097.1991492903
314696.963535.228876136771161.73112386323
324621.43410.702724808931210.69727519107
334562.843373.029597383021189.81040261698
344202.523381.83159463535820.68840536465
354296.493412.49847473026883.991525269736
364435.233336.744357980351098.48564201965
374105.183071.609101012321033.57089898768
384116.683107.694679371461008.98532062854
393844.493083.37560238013761.114397619867
403720.983112.04432860932608.935671390683
413674.43061.05794378165613.342056218353
423857.623258.82725702047598.792742979528
433801.063294.51357543996506.546424560037
443504.373159.52503928446344.844960715543
453032.63067.37535637654-34.7753563765403
463047.033147.61018796952-100.580187969516
472962.343199.38222366507-237.042223665072
482197.823089.53516325258-891.715163252577
492014.452891.32309199257-876.873091992573
501862.832902.99643908715-1040.16643908715
511905.412906.87769821178-1001.46769821178
521810.992814.62771243842-1003.63771243842
531670.072800.80083234351-1130.73083234351
541864.442974.45855755994-1110.01855755994
552052.022994.69181333167-942.671813331672
562029.62865.77627066809-836.176270668088
572070.832844.63852156177-773.808521561767
582293.412853.74116205628-560.331162056278
592443.272894.62991238512-451.35991238512
602513.172816.83142158842-303.661421588418


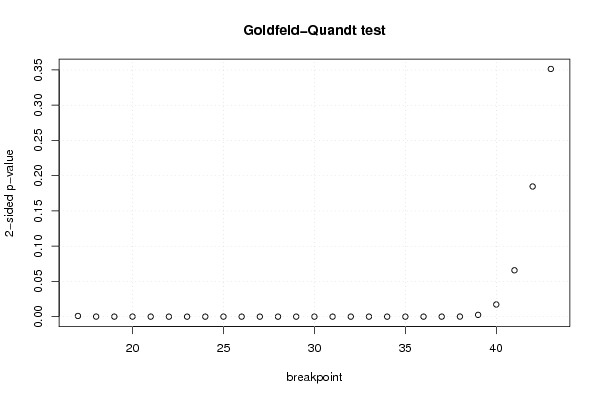
Goldfeld-Quandt test for Heteroskedasticity
p-valuesAlternative Hypothesis
breakpoint indexgreater2-sidedless
170.0004887685158288880.0009775370316577750.999511231484171
185.3221383395391e-050.0001064427667907820.999946778616605
192.19248023966544e-054.38496047933089e-050.999978075197603
202.32176408237918e-054.64352816475837e-050.999976782359176
219.07265228488631e-061.81453045697726e-050.999990927347715
221.53370269669279e-063.06740539338559e-060.999998466297303
237.78308941575227e-071.55661788315045e-060.999999221691058
243.91318480141808e-067.82636960283616e-060.999996086815199
252.23679678373037e-064.47359356746073e-060.999997763203216
269.04963288439733e-071.80992657687947e-060.999999095036712
272.36807659732578e-074.73615319465157e-070.99999976319234
284.35901401632557e-088.71802803265114e-080.99999995640986
293.95505502647736e-087.91011005295471e-080.99999996044945
309.07559482674129e-091.81511896534826e-080.999999990924405
319.0771130791594e-091.81542261583188e-080.999999990922887
326.16052438348609e-091.23210487669722e-080.999999993839476
331.20528537405724e-092.41057074811448e-090.999999998794715
344.95503983617461e-089.91007967234921e-080.999999950449602
352.14635864996637e-074.29271729993275e-070.999999785364135
361.75790866556913e-073.51581733113827e-070.999999824209133
375.90826699221808e-061.18165339844362e-050.999994091733008
386.02460258359048e-050.0001204920516718100.999939753974164
390.001257898194972540.002515796389945070.998742101805028
400.008627996246369010.01725599249273800.991372003753631
410.03288577952165610.06577155904331220.967114220478344
420.09233515079435640.1846703015887130.907664849205644
430.175711254812710.351422509625420.82428874518729

\begin{tabular}{lllllllll}
\hline
Goldfeld-Quandt test for Heteroskedasticity \tabularnewline
p-values & Alternative Hypothesis \tabularnewline
breakpoint index & greater & 2-sided & less \tabularnewline
17 & 0.000488768515828888 & 0.000977537031657775 & 0.999511231484171 \tabularnewline
18 & 5.3221383395391e-05 & 0.000106442766790782 & 0.999946778616605 \tabularnewline
19 & 2.19248023966544e-05 & 4.38496047933089e-05 & 0.999978075197603 \tabularnewline
20 & 2.32176408237918e-05 & 4.64352816475837e-05 & 0.999976782359176 \tabularnewline
21 & 9.07265228488631e-06 & 1.81453045697726e-05 & 0.999990927347715 \tabularnewline
22 & 1.53370269669279e-06 & 3.06740539338559e-06 & 0.999998466297303 \tabularnewline
23 & 7.78308941575227e-07 & 1.55661788315045e-06 & 0.999999221691058 \tabularnewline
24 & 3.91318480141808e-06 & 7.82636960283616e-06 & 0.999996086815199 \tabularnewline
25 & 2.23679678373037e-06 & 4.47359356746073e-06 & 0.999997763203216 \tabularnewline
26 & 9.04963288439733e-07 & 1.80992657687947e-06 & 0.999999095036712 \tabularnewline
27 & 2.36807659732578e-07 & 4.73615319465157e-07 & 0.99999976319234 \tabularnewline
28 & 4.35901401632557e-08 & 8.71802803265114e-08 & 0.99999995640986 \tabularnewline
29 & 3.95505502647736e-08 & 7.91011005295471e-08 & 0.99999996044945 \tabularnewline
30 & 9.07559482674129e-09 & 1.81511896534826e-08 & 0.999999990924405 \tabularnewline
31 & 9.0771130791594e-09 & 1.81542261583188e-08 & 0.999999990922887 \tabularnewline
32 & 6.16052438348609e-09 & 1.23210487669722e-08 & 0.999999993839476 \tabularnewline
33 & 1.20528537405724e-09 & 2.41057074811448e-09 & 0.999999998794715 \tabularnewline
34 & 4.95503983617461e-08 & 9.91007967234921e-08 & 0.999999950449602 \tabularnewline
35 & 2.14635864996637e-07 & 4.29271729993275e-07 & 0.999999785364135 \tabularnewline
36 & 1.75790866556913e-07 & 3.51581733113827e-07 & 0.999999824209133 \tabularnewline
37 & 5.90826699221808e-06 & 1.18165339844362e-05 & 0.999994091733008 \tabularnewline
38 & 6.02460258359048e-05 & 0.000120492051671810 & 0.999939753974164 \tabularnewline
39 & 0.00125789819497254 & 0.00251579638994507 & 0.998742101805028 \tabularnewline
40 & 0.00862799624636901 & 0.0172559924927380 & 0.991372003753631 \tabularnewline
41 & 0.0328857795216561 & 0.0657715590433122 & 0.967114220478344 \tabularnewline
42 & 0.0923351507943564 & 0.184670301588713 & 0.907664849205644 \tabularnewline
43 & 0.17571125481271 & 0.35142250962542 & 0.82428874518729 \tabularnewline
\hline
\end{tabular}
%Source: https://freestatistics.org/blog/index.php?pk=69887&T=5

[TABLE]
[ROW][C]Goldfeld-Quandt test for Heteroskedasticity[/C][/ROW]
[ROW][C]p-values[/C][C]Alternative Hypothesis[/C][/ROW]
[ROW][C]breakpoint index[/C][C]greater[/C][C]2-sided[/C][C]less[/C][/ROW]
[ROW][C]17[/C][C]0.000488768515828888[/C][C]0.000977537031657775[/C][C]0.999511231484171[/C][/ROW]
[ROW][C]18[/C][C]5.3221383395391e-05[/C][C]0.000106442766790782[/C][C]0.999946778616605[/C][/ROW]
[ROW][C]19[/C][C]2.19248023966544e-05[/C][C]4.38496047933089e-05[/C][C]0.999978075197603[/C][/ROW]
[ROW][C]20[/C][C]2.32176408237918e-05[/C][C]4.64352816475837e-05[/C][C]0.999976782359176[/C][/ROW]
[ROW][C]21[/C][C]9.07265228488631e-06[/C][C]1.81453045697726e-05[/C][C]0.999990927347715[/C][/ROW]
[ROW][C]22[/C][C]1.53370269669279e-06[/C][C]3.06740539338559e-06[/C][C]0.999998466297303[/C][/ROW]
[ROW][C]23[/C][C]7.78308941575227e-07[/C][C]1.55661788315045e-06[/C][C]0.999999221691058[/C][/ROW]
[ROW][C]24[/C][C]3.91318480141808e-06[/C][C]7.82636960283616e-06[/C][C]0.999996086815199[/C][/ROW]
[ROW][C]25[/C][C]2.23679678373037e-06[/C][C]4.47359356746073e-06[/C][C]0.999997763203216[/C][/ROW]
[ROW][C]26[/C][C]9.04963288439733e-07[/C][C]1.80992657687947e-06[/C][C]0.999999095036712[/C][/ROW]
[ROW][C]27[/C][C]2.36807659732578e-07[/C][C]4.73615319465157e-07[/C][C]0.99999976319234[/C][/ROW]
[ROW][C]28[/C][C]4.35901401632557e-08[/C][C]8.71802803265114e-08[/C][C]0.99999995640986[/C][/ROW]
[ROW][C]29[/C][C]3.95505502647736e-08[/C][C]7.91011005295471e-08[/C][C]0.99999996044945[/C][/ROW]
[ROW][C]30[/C][C]9.07559482674129e-09[/C][C]1.81511896534826e-08[/C][C]0.999999990924405[/C][/ROW]
[ROW][C]31[/C][C]9.0771130791594e-09[/C][C]1.81542261583188e-08[/C][C]0.999999990922887[/C][/ROW]
[ROW][C]32[/C][C]6.16052438348609e-09[/C][C]1.23210487669722e-08[/C][C]0.999999993839476[/C][/ROW]
[ROW][C]33[/C][C]1.20528537405724e-09[/C][C]2.41057074811448e-09[/C][C]0.999999998794715[/C][/ROW]
[ROW][C]34[/C][C]4.95503983617461e-08[/C][C]9.91007967234921e-08[/C][C]0.999999950449602[/C][/ROW]
[ROW][C]35[/C][C]2.14635864996637e-07[/C][C]4.29271729993275e-07[/C][C]0.999999785364135[/C][/ROW]
[ROW][C]36[/C][C]1.75790866556913e-07[/C][C]3.51581733113827e-07[/C][C]0.999999824209133[/C][/ROW]
[ROW][C]37[/C][C]5.90826699221808e-06[/C][C]1.18165339844362e-05[/C][C]0.999994091733008[/C][/ROW]
[ROW][C]38[/C][C]6.02460258359048e-05[/C][C]0.000120492051671810[/C][C]0.999939753974164[/C][/ROW]
[ROW][C]39[/C][C]0.00125789819497254[/C][C]0.00251579638994507[/C][C]0.998742101805028[/C][/ROW]
[ROW][C]40[/C][C]0.00862799624636901[/C][C]0.0172559924927380[/C][C]0.991372003753631[/C][/ROW]
[ROW][C]41[/C][C]0.0328857795216561[/C][C]0.0657715590433122[/C][C]0.967114220478344[/C][/ROW]
[ROW][C]42[/C][C]0.0923351507943564[/C][C]0.184670301588713[/C][C]0.907664849205644[/C][/ROW]
[ROW][C]43[/C][C]0.17571125481271[/C][C]0.35142250962542[/C][C]0.82428874518729[/C][/ROW]
[/TABLE]
Source: https://freestatistics.org/blog/index.php?pk=69887&T=5

Globally Unique Identifier (entire table): ba.freestatistics.org/blog/index.php?pk=69887&T=5

As an alternative you can also use a QR Code:  

The GUIDs for individual cells are displayed in the table below:

Goldfeld-Quandt test for Heteroskedasticity
p-valuesAlternative Hypothesis
breakpoint indexgreater2-sidedless
170.0004887685158288880.0009775370316577750.999511231484171
185.3221383395391e-050.0001064427667907820.999946778616605
192.19248023966544e-054.38496047933089e-050.999978075197603
202.32176408237918e-054.64352816475837e-050.999976782359176
219.07265228488631e-061.81453045697726e-050.999990927347715
221.53370269669279e-063.06740539338559e-060.999998466297303
237.78308941575227e-071.55661788315045e-060.999999221691058
243.91318480141808e-067.82636960283616e-060.999996086815199
252.23679678373037e-064.47359356746073e-060.999997763203216
269.04963288439733e-071.80992657687947e-060.999999095036712
272.36807659732578e-074.73615319465157e-070.99999976319234
284.35901401632557e-088.71802803265114e-080.99999995640986
293.95505502647736e-087.91011005295471e-080.99999996044945
309.07559482674129e-091.81511896534826e-080.999999990924405
319.0771130791594e-091.81542261583188e-080.999999990922887
326.16052438348609e-091.23210487669722e-080.999999993839476
331.20528537405724e-092.41057074811448e-090.999999998794715
344.95503983617461e-089.91007967234921e-080.999999950449602
352.14635864996637e-074.29271729993275e-070.999999785364135
361.75790866556913e-073.51581733113827e-070.999999824209133
375.90826699221808e-061.18165339844362e-050.999994091733008
386.02460258359048e-050.0001204920516718100.999939753974164
390.001257898194972540.002515796389945070.998742101805028
400.008627996246369010.01725599249273800.991372003753631
410.03288577952165610.06577155904331220.967114220478344
420.09233515079435640.1846703015887130.907664849205644
430.175711254812710.351422509625420.82428874518729


Meta Analysis of Goldfeld-Quandt test for Heteroskedasticity
Description# significant tests% significant testsOK/NOK
1% type I error level230.851851851851852NOK
5% type I error level240.888888888888889NOK
10% type I error level250.925925925925926NOK

\begin{tabular}{lllllllll}
\hline
Meta Analysis of Goldfeld-Quandt test for Heteroskedasticity \tabularnewline
Description & # significant tests & % significant tests & OK/NOK \tabularnewline
1% type I error level & 23 & 0.851851851851852 & NOK \tabularnewline
5% type I error level & 24 & 0.888888888888889 & NOK \tabularnewline
10% type I error level & 25 & 0.925925925925926 & NOK \tabularnewline
\hline
\end{tabular}
%Source: https://freestatistics.org/blog/index.php?pk=69887&T=6

[TABLE]
[ROW][C]Meta Analysis of Goldfeld-Quandt test for Heteroskedasticity[/C][/ROW]
[ROW][C]Description[/C][C]# significant tests[/C][C]% significant tests[/C][C]OK/NOK[/C][/ROW]
[ROW][C]1% type I error level[/C][C]23[/C][C]0.851851851851852[/C][C]NOK[/C][/ROW]
[ROW][C]5% type I error level[/C][C]24[/C][C]0.888888888888889[/C][C]NOK[/C][/ROW]
[ROW][C]10% type I error level[/C][C]25[/C][C]0.925925925925926[/C][C]NOK[/C][/ROW]
[/TABLE]
Source: https://freestatistics.org/blog/index.php?pk=69887&T=6

Globally Unique Identifier (entire table): ba.freestatistics.org/blog/index.php?pk=69887&T=6

As an alternative you can also use a QR Code:  

The GUIDs for individual cells are displayed in the table below:

Meta Analysis of Goldfeld-Quandt test for Heteroskedasticity
Description# significant tests% significant testsOK/NOK
1% type I error level230.851851851851852NOK
5% type I error level240.888888888888889NOK
10% type I error level250.925925925925926NOK


Parameters (Session):
par1 = 1 ; par2 = Include Monthly Dummies ; par3 = Linear Trend ;
Parameters (R input):
par1 = 1 ; par2 = Include Monthly Dummies ; par3 = Linear Trend ;
R code (references can be found in the software module):
library(lattice)
library(lmtest)
n25 <- 25 #minimum number of obs. for Goldfeld-Quandt test
par1 <- as.numeric(par1)
x <- t(y)
k <- length(x[1,])
n <- length(x[,1])
x1 <- cbind(x[,par1], x[,1:k!=par1])
mycolnames <- c(colnames(x)[par1], colnames(x)[1:k!=par1])
colnames(x1) <- mycolnames #colnames(x)[par1]
x <- x1
if (par3 == 'First Differences'){
x2 <- array(0, dim=c(n-1,k), dimnames=list(1:(n-1), paste('(1-B)',colnames(x),sep='')))
for (i in 1:n-1) {
for (j in 1:k) {
x2[i,j] <- x[i+1,j] - x[i,j]
}
}
x <- x2
}
if (par2 == 'Include Monthly Dummies'){
x2 <- array(0, dim=c(n,11), dimnames=list(1:n, paste('M', seq(1:11), sep ='')))
for (i in 1:11){
x2[seq(i,n,12),i] <- 1
}
x <- cbind(x, x2)
}
if (par2 == 'Include Quarterly Dummies'){
x2 <- array(0, dim=c(n,3), dimnames=list(1:n, paste('Q', seq(1:3), sep ='')))
for (i in 1:3){
x2[seq(i,n,4),i] <- 1
}
x <- cbind(x, x2)
}
k <- length(x[1,])
if (par3 == 'Linear Trend'){
x <- cbind(x, c(1:n))
colnames(x)[k+1] <- 't'
}
x
k <- length(x[1,])
df <- as.data.frame(x)
(mylm <- lm(df))
(mysum <- summary(mylm))
if (n > n25) {
kp3 <- k + 3
nmkm3 <- n - k - 3
gqarr <- array(NA, dim=c(nmkm3-kp3+1,3))
numgqtests <- 0
numsignificant1 <- 0
numsignificant5 <- 0
numsignificant10 <- 0
for (mypoint in kp3:nmkm3) {
j <- 0
numgqtests <- numgqtests + 1
for (myalt in c('greater', 'two.sided', 'less')) {
j <- j + 1
gqarr[mypoint-kp3+1,j] <- gqtest(mylm, point=mypoint, alternative=myalt)$p.value
}
if (gqarr[mypoint-kp3+1,2] < 0.01) numsignificant1 <- numsignificant1 + 1
if (gqarr[mypoint-kp3+1,2] < 0.05) numsignificant5 <- numsignificant5 + 1
if (gqarr[mypoint-kp3+1,2] < 0.10) numsignificant10 <- numsignificant10 + 1
}
gqarr
}
bitmap(file='test0.png')
plot(x[,1], type='l', main='Actuals and Interpolation', ylab='value of Actuals and Interpolation (dots)', xlab='time or index')
points(x[,1]-mysum$resid)
grid()
dev.off()
bitmap(file='test1.png')
plot(mysum$resid, type='b', pch=19, main='Residuals', ylab='value of Residuals', xlab='time or index')
grid()
dev.off()
bitmap(file='test2.png')
hist(mysum$resid, main='Residual Histogram', xlab='values of Residuals')
grid()
dev.off()
bitmap(file='test3.png')
densityplot(~mysum$resid,col='black',main='Residual Density Plot', xlab='values of Residuals')
dev.off()
bitmap(file='test4.png')
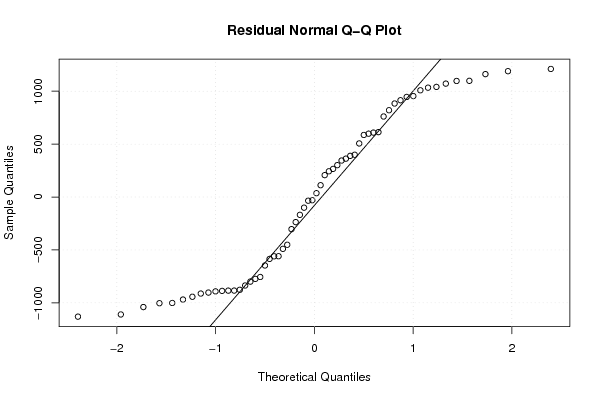
qqnorm(mysum$resid, main='Residual Normal Q-Q Plot')
qqline(mysum$resid)
grid()
dev.off()
(myerror <- as.ts(mysum$resid))
bitmap(file='test5.png')
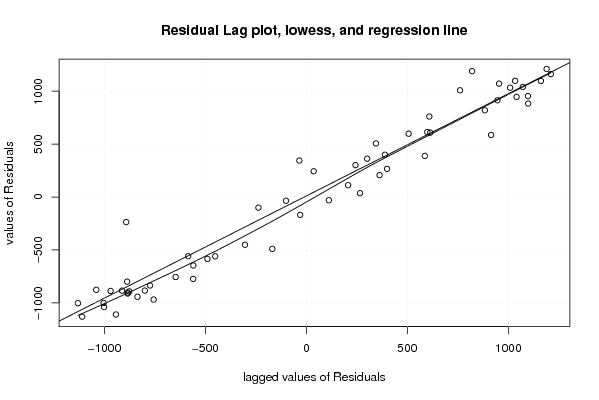
dum <- cbind(lag(myerror,k=1),myerror)
dum
dum1 <- dum[2:length(myerror),]
dum1
z <- as.data.frame(dum1)
z
plot(z,main=paste('Residual Lag plot, lowess, and regression line'), ylab='values of Residuals', xlab='lagged values of Residuals')
lines(lowess(z))
abline(lm(z))
grid()
dev.off()
bitmap(file='test6.png')
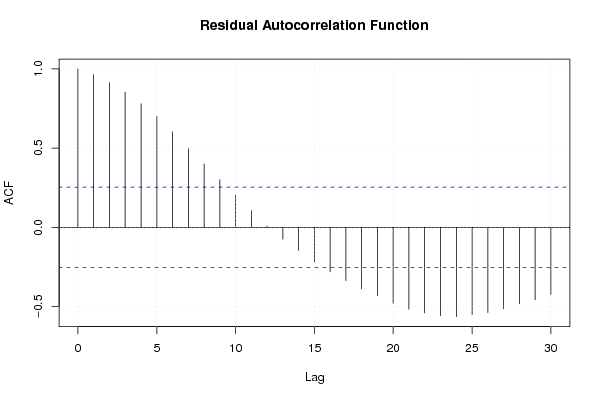
acf(mysum$resid, lag.max=length(mysum$resid)/2, main='Residual Autocorrelation Function')
grid()
dev.off()
bitmap(file='test7.png')
pacf(mysum$resid, lag.max=length(mysum$resid)/2, main='Residual Partial Autocorrelation Function')
grid()
dev.off()
bitmap(file='test8.png')
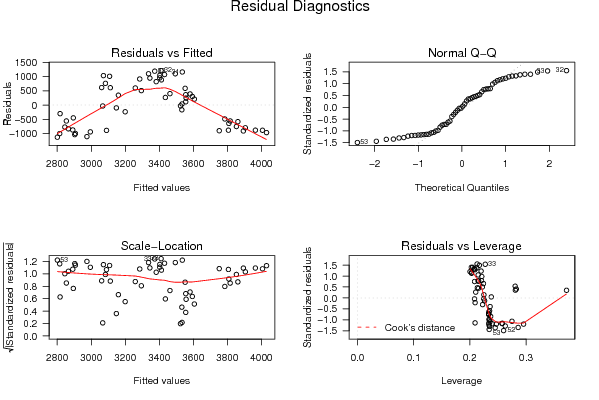
opar <- par(mfrow = c(2,2), oma = c(0, 0, 1.1, 0))
plot(mylm, las = 1, sub='Residual Diagnostics')
par(opar)
dev.off()
if (n > n25) {
bitmap(file='test9.png')
plot(kp3:nmkm3,gqarr[,2], main='Goldfeld-Quandt test',ylab='2-sided p-value',xlab='breakpoint')
grid()
dev.off()
}
load(file='createtable')
a<-table.start()
a<-table.row.start(a)
a<-table.element(a, 'Multiple Linear Regression - Estimated Regression Equation', 1, TRUE)
a<-table.row.end(a)
myeq <- colnames(x)[1]
myeq <- paste(myeq, '[t] = ', sep='')
for (i in 1:k){
if (mysum$coefficients[i,1] > 0) myeq <- paste(myeq, '+', '')
myeq <- paste(myeq, mysum$coefficients[i,1], sep=' ')
if (rownames(mysum$coefficients)[i] != '(Intercept)') {
myeq <- paste(myeq, rownames(mysum$coefficients)[i], sep='')
if (rownames(mysum$coefficients)[i] != 't') myeq <- paste(myeq, '[t]', sep='')
}
}
myeq <- paste(myeq, ' + e[t]')
a<-table.row.start(a)
a<-table.element(a, myeq)
a<-table.row.end(a)
a<-table.end(a)
table.save(a,file='mytable1.tab')
a<-table.start()
a<-table.row.start(a)
a<-table.element(a,hyperlink('ols1.htm','Multiple Linear Regression - Ordinary Least Squares',''), 6, TRUE)
a<-table.row.end(a)
a<-table.row.start(a)
a<-table.element(a,'Variable',header=TRUE)
a<-table.element(a,'Parameter',header=TRUE)
a<-table.element(a,'S.D.',header=TRUE)
a<-table.element(a,'T-STAT
H0: parameter = 0',header=TRUE)
a<-table.element(a,'2-tail p-value',header=TRUE)
a<-table.element(a,'1-tail p-value',header=TRUE)
a<-table.row.end(a)
for (i in 1:k){
a<-table.row.start(a)
a<-table.element(a,rownames(mysum$coefficients)[i],header=TRUE)
a<-table.element(a,mysum$coefficients[i,1])
a<-table.element(a, round(mysum$coefficients[i,2],6))
a<-table.element(a, round(mysum$coefficients[i,3],4))
a<-table.element(a, round(mysum$coefficients[i,4],6))
a<-table.element(a, round(mysum$coefficients[i,4]/2,6))
a<-table.row.end(a)
}
a<-table.end(a)
table.save(a,file='mytable2.tab')
a<-table.start()
a<-table.row.start(a)
a<-table.element(a, 'Multiple Linear Regression - Regression Statistics', 2, TRUE)
a<-table.row.end(a)
a<-table.row.start(a)
a<-table.element(a, 'Multiple R',1,TRUE)
a<-table.element(a, sqrt(mysum$r.squared))
a<-table.row.end(a)
a<-table.row.start(a)
a<-table.element(a, 'R-squared',1,TRUE)
a<-table.element(a, mysum$r.squared)
a<-table.row.end(a)
a<-table.row.start(a)
a<-table.element(a, 'Adjusted R-squared',1,TRUE)
a<-table.element(a, mysum$adj.r.squared)
a<-table.row.end(a)
a<-table.row.start(a)
a<-table.element(a, 'F-TEST (value)',1,TRUE)
a<-table.element(a, mysum$fstatistic[1])
a<-table.row.end(a)
a<-table.row.start(a)
a<-table.element(a, 'F-TEST (DF numerator)',1,TRUE)
a<-table.element(a, mysum$fstatistic[2])
a<-table.row.end(a)
a<-table.row.start(a)
a<-table.element(a, 'F-TEST (DF denominator)',1,TRUE)
a<-table.element(a, mysum$fstatistic[3])
a<-table.row.end(a)
a<-table.row.start(a)
a<-table.element(a, 'p-value',1,TRUE)
a<-table.element(a, 1-pf(mysum$fstatistic[1],mysum$fstatistic[2],mysum$fstatistic[3]))
a<-table.row.end(a)
a<-table.row.start(a)
a<-table.element(a, 'Multiple Linear Regression - Residual Statistics', 2, TRUE)
a<-table.row.end(a)
a<-table.row.start(a)
a<-table.element(a, 'Residual Standard Deviation',1,TRUE)
a<-table.element(a, mysum$sigma)
a<-table.row.end(a)
a<-table.row.start(a)
a<-table.element(a, 'Sum Squared Residuals',1,TRUE)
a<-table.element(a, sum(myerror*myerror))
a<-table.row.end(a)
a<-table.end(a)
table.save(a,file='mytable3.tab')
a<-table.start()
a<-table.row.start(a)
a<-table.element(a, 'Multiple Linear Regression - Actuals, Interpolation, and Residuals', 4, TRUE)
a<-table.row.end(a)
a<-table.row.start(a)
a<-table.element(a, 'Time or Index', 1, TRUE)
a<-table.element(a, 'Actuals', 1, TRUE)
a<-table.element(a, 'Interpolation
Forecast', 1, TRUE)
a<-table.element(a, 'Residuals
Prediction Error', 1, TRUE)
a<-table.row.end(a)
for (i in 1:n) {
a<-table.row.start(a)
a<-table.element(a,i, 1, TRUE)
a<-table.element(a,x[i])
a<-table.element(a,x[i]-mysum$resid[i])
a<-table.element(a,mysum$resid[i])
a<-table.row.end(a)
}
a<-table.end(a)
table.save(a,file='mytable4.tab')
if (n > n25) {
a<-table.start()
a<-table.row.start(a)
a<-table.element(a,'Goldfeld-Quandt test for Heteroskedasticity',4,TRUE)
a<-table.row.end(a)
a<-table.row.start(a)
a<-table.element(a,'p-values',header=TRUE)
a<-table.element(a,'Alternative Hypothesis',3,header=TRUE)
a<-table.row.end(a)
a<-table.row.start(a)
a<-table.element(a,'breakpoint index',header=TRUE)
a<-table.element(a,'greater',header=TRUE)
a<-table.element(a,'2-sided',header=TRUE)
a<-table.element(a,'less',header=TRUE)
a<-table.row.end(a)
for (mypoint in kp3:nmkm3) {
a<-table.row.start(a)
a<-table.element(a,mypoint,header=TRUE)
a<-table.element(a,gqarr[mypoint-kp3+1,1])
a<-table.element(a,gqarr[mypoint-kp3+1,2])
a<-table.element(a,gqarr[mypoint-kp3+1,3])
a<-table.row.end(a)
}
a<-table.end(a)
table.save(a,file='mytable5.tab')
a<-table.start()
a<-table.row.start(a)
a<-table.element(a,'Meta Analysis of Goldfeld-Quandt test for Heteroskedasticity',4,TRUE)
a<-table.row.end(a)
a<-table.row.start(a)
a<-table.element(a,'Description',header=TRUE)
a<-table.element(a,'# significant tests',header=TRUE)
a<-table.element(a,'% significant tests',header=TRUE)
a<-table.element(a,'OK/NOK',header=TRUE)
a<-table.row.end(a)
a<-table.row.start(a)
a<-table.element(a,'1% type I error level',header=TRUE)
a<-table.element(a,numsignificant1)
a<-table.element(a,numsignificant1/numgqtests)
if (numsignificant1/numgqtests < 0.01) dum <- 'OK' else dum <- 'NOK'
a<-table.element(a,dum)
a<-table.row.end(a)
a<-table.row.start(a)
a<-table.element(a,'5% type I error level',header=TRUE)
a<-table.element(a,numsignificant5)
a<-table.element(a,numsignificant5/numgqtests)
if (numsignificant5/numgqtests < 0.05) dum <- 'OK' else dum <- 'NOK'
a<-table.element(a,dum)
a<-table.row.end(a)
a<-table.row.start(a)
a<-table.element(a,'10% type I error level',header=TRUE)
a<-table.element(a,numsignificant10)
a<-table.element(a,numsignificant10/numgqtests)
if (numsignificant10/numgqtests < 0.1) dum <- 'OK' else dum <- 'NOK'
a<-table.element(a,dum)
a<-table.row.end(a)
a<-table.end(a)
table.save(a,file='mytable6.tab')
}