Free Statistics

of Irreproducible Research!

Author's title

Author*The author of this computation has been verified*
R Software Modulerwasp_arimabackwardselection.wasp
Title produced by softwareARIMA Backward Selection
Date of computationSun, 20 Dec 2009 07:35:47 -0700
Cite this page as followsStatistical Computations at FreeStatistics.org, Office for Research Development and Education, URL https://freestatistics.org/blog/index.php?v=date/2009/Dec/20/t1261319958cr5ou0unqy5kukd.htm/, Retrieved Sat, 27 Apr 2024 08:23:04 +0000
Statistical Computations at FreeStatistics.org, Office for Research Development and Education, URL https://freestatistics.org/blog/index.php?pk=69900, Retrieved Sat, 27 Apr 2024 08:23:04 +0000
QR Codes:

Original text written by user:
IsPrivate?No (this computation is public)
User-defined keywords
Estimated Impact134
Family? (F = Feedback message, R = changed R code, M = changed R Module, P = changed Parameters, D = changed Data)
-       [ARIMA Backward Selection] [ARIMA BACKWARD] [2009-12-20 14:35:47] [e458b4e05bf28a297f8af8d9f96e59d6] [Current]
Feedback Forum

Post a new message
Dataseries X:
210
220
212
191
180
195
136
196
182
166
147
125
164
170
171
140
155
156
141
167
171
206
187
124
163
154
226
125
162
145
98
128
159
209
150
125
214
193
140
205
192
192
186
150
246
282
264
336
301
376
416
344
326
351
249
258
311
343
278


Summary of computational transaction
Raw Inputview raw input (R code)
Raw Outputview raw output of R engine
Computing time13 seconds
R Server'Gwilym Jenkins' @ 72.249.127.135

\begin{tabular}{lllllllll}
\hline
Summary of computational transaction \tabularnewline
Raw Input & view raw input (R code)  \tabularnewline
Raw Output & view raw output of R engine  \tabularnewline
Computing time & 13 seconds \tabularnewline
R Server & 'Gwilym Jenkins' @ 72.249.127.135 \tabularnewline
\hline
\end{tabular}
%Source: https://freestatistics.org/blog/index.php?pk=69900&T=0

[TABLE]
[ROW][C]Summary of computational transaction[/C][/ROW]
[ROW][C]Raw Input[/C][C]view raw input (R code) [/C][/ROW]
[ROW][C]Raw Output[/C][C]view raw output of R engine [/C][/ROW]
[ROW][C]Computing time[/C][C]13 seconds[/C][/ROW]
[ROW][C]R Server[/C][C]'Gwilym Jenkins' @ 72.249.127.135[/C][/ROW]
[/TABLE]
Source: https://freestatistics.org/blog/index.php?pk=69900&T=0

Globally Unique Identifier (entire table): ba.freestatistics.org/blog/index.php?pk=69900&T=0

As an alternative you can also use a QR Code:  

The GUIDs for individual cells are displayed in the table below:

Summary of computational transaction
Raw Inputview raw input (R code)
Raw Outputview raw output of R engine
Computing time13 seconds
R Server'Gwilym Jenkins' @ 72.249.127.135


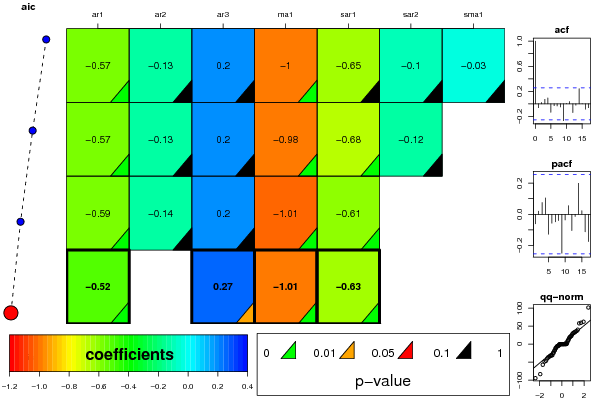
ARIMA Parameter Estimation and Backward Selection
Iterationar1ar2ar3ma1sar1sar2sma1
Estimates ( 1 )-0.5737-0.12930.2027-0.9962-0.6538-0.1017-0.028
(p-val)(6e-04 )(0.49 )(0.1698 )(0 )(0.8345 )(0.9548 )(0.9931 )
Estimates ( 2 )-0.5718-0.12780.2016-0.9835-0.6838-0.11920
(p-val)(6e-04 )(0.4947 )(0.1777 )(0 )(9e-04 )(0.5975 )(NA )
Estimates ( 3 )-0.5904-0.14290.1978-1.0122-0.609300
(p-val)(3e-04 )(0.4391 )(0.1862 )(0 )(0 )(NA )(NA )
Estimates ( 4 )-0.523200.2676-1.0053-0.632700
(p-val)(1e-04 )(NA )(0.0279 )(0 )(0 )(NA )(NA )
Estimates ( 5 )NANANANANANANA
(p-val)(NA )(NA )(NA )(NA )(NA )(NA )(NA )
Estimates ( 6 )NANANANANANANA
(p-val)(NA )(NA )(NA )(NA )(NA )(NA )(NA )
Estimates ( 7 )NANANANANANANA
(p-val)(NA )(NA )(NA )(NA )(NA )(NA )(NA )
Estimates ( 8 )NANANANANANANA
(p-val)(NA )(NA )(NA )(NA )(NA )(NA )(NA )
Estimates ( 9 )NANANANANANANA
(p-val)(NA )(NA )(NA )(NA )(NA )(NA )(NA )
Estimates ( 10 )NANANANANANANA
(p-val)(NA )(NA )(NA )(NA )(NA )(NA )(NA )
Estimates ( 11 )NANANANANANANA
(p-val)(NA )(NA )(NA )(NA )(NA )(NA )(NA )
Estimates ( 12 )NANANANANANANA
(p-val)(NA )(NA )(NA )(NA )(NA )(NA )(NA )
Estimates ( 13 )NANANANANANANA
(p-val)(NA )(NA )(NA )(NA )(NA )(NA )(NA )

\begin{tabular}{lllllllll}
\hline
ARIMA Parameter Estimation and Backward Selection \tabularnewline
Iteration & ar1 & ar2 & ar3 & ma1 & sar1 & sar2 & sma1 \tabularnewline
Estimates ( 1 ) & -0.5737 & -0.1293 & 0.2027 & -0.9962 & -0.6538 & -0.1017 & -0.028 \tabularnewline
(p-val) & (6e-04 ) & (0.49 ) & (0.1698 ) & (0 ) & (0.8345 ) & (0.9548 ) & (0.9931 ) \tabularnewline
Estimates ( 2 ) & -0.5718 & -0.1278 & 0.2016 & -0.9835 & -0.6838 & -0.1192 & 0 \tabularnewline
(p-val) & (6e-04 ) & (0.4947 ) & (0.1777 ) & (0 ) & (9e-04 ) & (0.5975 ) & (NA ) \tabularnewline
Estimates ( 3 ) & -0.5904 & -0.1429 & 0.1978 & -1.0122 & -0.6093 & 0 & 0 \tabularnewline
(p-val) & (3e-04 ) & (0.4391 ) & (0.1862 ) & (0 ) & (0 ) & (NA ) & (NA ) \tabularnewline
Estimates ( 4 ) & -0.5232 & 0 & 0.2676 & -1.0053 & -0.6327 & 0 & 0 \tabularnewline
(p-val) & (1e-04 ) & (NA ) & (0.0279 ) & (0 ) & (0 ) & (NA ) & (NA ) \tabularnewline
Estimates ( 5 ) & NA & NA & NA & NA & NA & NA & NA \tabularnewline
(p-val) & (NA ) & (NA ) & (NA ) & (NA ) & (NA ) & (NA ) & (NA ) \tabularnewline
Estimates ( 6 ) & NA & NA & NA & NA & NA & NA & NA \tabularnewline
(p-val) & (NA ) & (NA ) & (NA ) & (NA ) & (NA ) & (NA ) & (NA ) \tabularnewline
Estimates ( 7 ) & NA & NA & NA & NA & NA & NA & NA \tabularnewline
(p-val) & (NA ) & (NA ) & (NA ) & (NA ) & (NA ) & (NA ) & (NA ) \tabularnewline
Estimates ( 8 ) & NA & NA & NA & NA & NA & NA & NA \tabularnewline
(p-val) & (NA ) & (NA ) & (NA ) & (NA ) & (NA ) & (NA ) & (NA ) \tabularnewline
Estimates ( 9 ) & NA & NA & NA & NA & NA & NA & NA \tabularnewline
(p-val) & (NA ) & (NA ) & (NA ) & (NA ) & (NA ) & (NA ) & (NA ) \tabularnewline
Estimates ( 10 ) & NA & NA & NA & NA & NA & NA & NA \tabularnewline
(p-val) & (NA ) & (NA ) & (NA ) & (NA ) & (NA ) & (NA ) & (NA ) \tabularnewline
Estimates ( 11 ) & NA & NA & NA & NA & NA & NA & NA \tabularnewline
(p-val) & (NA ) & (NA ) & (NA ) & (NA ) & (NA ) & (NA ) & (NA ) \tabularnewline
Estimates ( 12 ) & NA & NA & NA & NA & NA & NA & NA \tabularnewline
(p-val) & (NA ) & (NA ) & (NA ) & (NA ) & (NA ) & (NA ) & (NA ) \tabularnewline
Estimates ( 13 ) & NA & NA & NA & NA & NA & NA & NA \tabularnewline
(p-val) & (NA ) & (NA ) & (NA ) & (NA ) & (NA ) & (NA ) & (NA ) \tabularnewline
\hline
\end{tabular}
%Source: https://freestatistics.org/blog/index.php?pk=69900&T=1

[TABLE]
[ROW][C]ARIMA Parameter Estimation and Backward Selection[/C][/ROW]
[ROW][C]Iteration[/C][C]ar1[/C][C]ar2[/C][C]ar3[/C][C]ma1[/C][C]sar1[/C][C]sar2[/C][C]sma1[/C][/ROW]
[ROW][C]Estimates ( 1 )[/C][C]-0.5737[/C][C]-0.1293[/C][C]0.2027[/C][C]-0.9962[/C][C]-0.6538[/C][C]-0.1017[/C][C]-0.028[/C][/ROW]
[ROW][C](p-val)[/C][C](6e-04 )[/C][C](0.49 )[/C][C](0.1698 )[/C][C](0 )[/C][C](0.8345 )[/C][C](0.9548 )[/C][C](0.9931 )[/C][/ROW]
[ROW][C]Estimates ( 2 )[/C][C]-0.5718[/C][C]-0.1278[/C][C]0.2016[/C][C]-0.9835[/C][C]-0.6838[/C][C]-0.1192[/C][C]0[/C][/ROW]
[ROW][C](p-val)[/C][C](6e-04 )[/C][C](0.4947 )[/C][C](0.1777 )[/C][C](0 )[/C][C](9e-04 )[/C][C](0.5975 )[/C][C](NA )[/C][/ROW]
[ROW][C]Estimates ( 3 )[/C][C]-0.5904[/C][C]-0.1429[/C][C]0.1978[/C][C]-1.0122[/C][C]-0.6093[/C][C]0[/C][C]0[/C][/ROW]
[ROW][C](p-val)[/C][C](3e-04 )[/C][C](0.4391 )[/C][C](0.1862 )[/C][C](0 )[/C][C](0 )[/C][C](NA )[/C][C](NA )[/C][/ROW]
[ROW][C]Estimates ( 4 )[/C][C]-0.5232[/C][C]0[/C][C]0.2676[/C][C]-1.0053[/C][C]-0.6327[/C][C]0[/C][C]0[/C][/ROW]
[ROW][C](p-val)[/C][C](1e-04 )[/C][C](NA )[/C][C](0.0279 )[/C][C](0 )[/C][C](0 )[/C][C](NA )[/C][C](NA )[/C][/ROW]
[ROW][C]Estimates ( 5 )[/C][C]NA[/C][C]NA[/C][C]NA[/C][C]NA[/C][C]NA[/C][C]NA[/C][C]NA[/C][/ROW]
[ROW][C](p-val)[/C][C](NA )[/C][C](NA )[/C][C](NA )[/C][C](NA )[/C][C](NA )[/C][C](NA )[/C][C](NA )[/C][/ROW]
[ROW][C]Estimates ( 6 )[/C][C]NA[/C][C]NA[/C][C]NA[/C][C]NA[/C][C]NA[/C][C]NA[/C][C]NA[/C][/ROW]
[ROW][C](p-val)[/C][C](NA )[/C][C](NA )[/C][C](NA )[/C][C](NA )[/C][C](NA )[/C][C](NA )[/C][C](NA )[/C][/ROW]
[ROW][C]Estimates ( 7 )[/C][C]NA[/C][C]NA[/C][C]NA[/C][C]NA[/C][C]NA[/C][C]NA[/C][C]NA[/C][/ROW]
[ROW][C](p-val)[/C][C](NA )[/C][C](NA )[/C][C](NA )[/C][C](NA )[/C][C](NA )[/C][C](NA )[/C][C](NA )[/C][/ROW]
[ROW][C]Estimates ( 8 )[/C][C]NA[/C][C]NA[/C][C]NA[/C][C]NA[/C][C]NA[/C][C]NA[/C][C]NA[/C][/ROW]
[ROW][C](p-val)[/C][C](NA )[/C][C](NA )[/C][C](NA )[/C][C](NA )[/C][C](NA )[/C][C](NA )[/C][C](NA )[/C][/ROW]
[ROW][C]Estimates ( 9 )[/C][C]NA[/C][C]NA[/C][C]NA[/C][C]NA[/C][C]NA[/C][C]NA[/C][C]NA[/C][/ROW]
[ROW][C](p-val)[/C][C](NA )[/C][C](NA )[/C][C](NA )[/C][C](NA )[/C][C](NA )[/C][C](NA )[/C][C](NA )[/C][/ROW]
[ROW][C]Estimates ( 10 )[/C][C]NA[/C][C]NA[/C][C]NA[/C][C]NA[/C][C]NA[/C][C]NA[/C][C]NA[/C][/ROW]
[ROW][C](p-val)[/C][C](NA )[/C][C](NA )[/C][C](NA )[/C][C](NA )[/C][C](NA )[/C][C](NA )[/C][C](NA )[/C][/ROW]
[ROW][C]Estimates ( 11 )[/C][C]NA[/C][C]NA[/C][C]NA[/C][C]NA[/C][C]NA[/C][C]NA[/C][C]NA[/C][/ROW]
[ROW][C](p-val)[/C][C](NA )[/C][C](NA )[/C][C](NA )[/C][C](NA )[/C][C](NA )[/C][C](NA )[/C][C](NA )[/C][/ROW]
[ROW][C]Estimates ( 12 )[/C][C]NA[/C][C]NA[/C][C]NA[/C][C]NA[/C][C]NA[/C][C]NA[/C][C]NA[/C][/ROW]
[ROW][C](p-val)[/C][C](NA )[/C][C](NA )[/C][C](NA )[/C][C](NA )[/C][C](NA )[/C][C](NA )[/C][C](NA )[/C][/ROW]
[ROW][C]Estimates ( 13 )[/C][C]NA[/C][C]NA[/C][C]NA[/C][C]NA[/C][C]NA[/C][C]NA[/C][C]NA[/C][/ROW]
[ROW][C](p-val)[/C][C](NA )[/C][C](NA )[/C][C](NA )[/C][C](NA )[/C][C](NA )[/C][C](NA )[/C][C](NA )[/C][/ROW]
[/TABLE]
Source: https://freestatistics.org/blog/index.php?pk=69900&T=1

Globally Unique Identifier (entire table): ba.freestatistics.org/blog/index.php?pk=69900&T=1

As an alternative you can also use a QR Code:  

The GUIDs for individual cells are displayed in the table below:

ARIMA Parameter Estimation and Backward Selection
Iterationar1ar2ar3ma1sar1sar2sma1
Estimates ( 1 )-0.5737-0.12930.2027-0.9962-0.6538-0.1017-0.028
(p-val)(6e-04 )(0.49 )(0.1698 )(0 )(0.8345 )(0.9548 )(0.9931 )
Estimates ( 2 )-0.5718-0.12780.2016-0.9835-0.6838-0.11920
(p-val)(6e-04 )(0.4947 )(0.1777 )(0 )(9e-04 )(0.5975 )(NA )
Estimates ( 3 )-0.5904-0.14290.1978-1.0122-0.609300
(p-val)(3e-04 )(0.4391 )(0.1862 )(0 )(0 )(NA )(NA )
Estimates ( 4 )-0.523200.2676-1.0053-0.632700
(p-val)(1e-04 )(NA )(0.0279 )(0 )(0 )(NA )(NA )
Estimates ( 5 )NANANANANANANA
(p-val)(NA )(NA )(NA )(NA )(NA )(NA )(NA )
Estimates ( 6 )NANANANANANANA
(p-val)(NA )(NA )(NA )(NA )(NA )(NA )(NA )
Estimates ( 7 )NANANANANANANA
(p-val)(NA )(NA )(NA )(NA )(NA )(NA )(NA )
Estimates ( 8 )NANANANANANANA
(p-val)(NA )(NA )(NA )(NA )(NA )(NA )(NA )
Estimates ( 9 )NANANANANANANA
(p-val)(NA )(NA )(NA )(NA )(NA )(NA )(NA )
Estimates ( 10 )NANANANANANANA
(p-val)(NA )(NA )(NA )(NA )(NA )(NA )(NA )
Estimates ( 11 )NANANANANANANA
(p-val)(NA )(NA )(NA )(NA )(NA )(NA )(NA )
Estimates ( 12 )NANANANANANANA
(p-val)(NA )(NA )(NA )(NA )(NA )(NA )(NA )
Estimates ( 13 )NANANANANANANA
(p-val)(NA )(NA )(NA )(NA )(NA )(NA )(NA )


Estimated ARIMA Residuals
Value
0.633621329294116
4.77836053550782
-5.03822536990257
15.4094104734941
-5.25636005092733
27.0606563293149
-18.8005836727666
-0.087809207843086
31.6742171360919
19.7780444396614
-39.8805773503001
-30.8725218355347
-24.0462130469381
59.0801588141248
-46.3712355516772
-0.209845470002021
-34.8714962005317
-2.68070063530275
-31.2148236550538
32.1026118141053
61.961204456991
-11.0908514597262
-17.3709632374006
36.0235691171691
9.8625045943802
-94.5822067805587
57.5257747267995
21.9755651206047
10.6227310131967
-11.9981494827979
-48.470682585790
39.788527501812
22.5578920227326
29.4483544963258
101.452786253041
-31.595658482905
34.5483263242259
18.3635711206508
-8.45568586107267
-83.4158404308507
-4.62877490197433
-57.3573669595227
-32.9975743651262
-24.7653139019548
-6.4837861495204
-36.6999272803440

\begin{tabular}{lllllllll}
\hline
Estimated ARIMA Residuals \tabularnewline
Value \tabularnewline
0.633621329294116 \tabularnewline
4.77836053550782 \tabularnewline
-5.03822536990257 \tabularnewline
15.4094104734941 \tabularnewline
-5.25636005092733 \tabularnewline
27.0606563293149 \tabularnewline
-18.8005836727666 \tabularnewline
-0.087809207843086 \tabularnewline
31.6742171360919 \tabularnewline
19.7780444396614 \tabularnewline
-39.8805773503001 \tabularnewline
-30.8725218355347 \tabularnewline
-24.0462130469381 \tabularnewline
59.0801588141248 \tabularnewline
-46.3712355516772 \tabularnewline
-0.209845470002021 \tabularnewline
-34.8714962005317 \tabularnewline
-2.68070063530275 \tabularnewline
-31.2148236550538 \tabularnewline
32.1026118141053 \tabularnewline
61.961204456991 \tabularnewline
-11.0908514597262 \tabularnewline
-17.3709632374006 \tabularnewline
36.0235691171691 \tabularnewline
9.8625045943802 \tabularnewline
-94.5822067805587 \tabularnewline
57.5257747267995 \tabularnewline
21.9755651206047 \tabularnewline
10.6227310131967 \tabularnewline
-11.9981494827979 \tabularnewline
-48.470682585790 \tabularnewline
39.788527501812 \tabularnewline
22.5578920227326 \tabularnewline
29.4483544963258 \tabularnewline
101.452786253041 \tabularnewline
-31.595658482905 \tabularnewline
34.5483263242259 \tabularnewline
18.3635711206508 \tabularnewline
-8.45568586107267 \tabularnewline
-83.4158404308507 \tabularnewline
-4.62877490197433 \tabularnewline
-57.3573669595227 \tabularnewline
-32.9975743651262 \tabularnewline
-24.7653139019548 \tabularnewline
-6.4837861495204 \tabularnewline
-36.6999272803440 \tabularnewline
\hline
\end{tabular}
%Source: https://freestatistics.org/blog/index.php?pk=69900&T=2

[TABLE]
[ROW][C]Estimated ARIMA Residuals[/C][/ROW]
[ROW][C]Value[/C][/ROW]
[ROW][C]0.633621329294116[/C][/ROW]
[ROW][C]4.77836053550782[/C][/ROW]
[ROW][C]-5.03822536990257[/C][/ROW]
[ROW][C]15.4094104734941[/C][/ROW]
[ROW][C]-5.25636005092733[/C][/ROW]
[ROW][C]27.0606563293149[/C][/ROW]
[ROW][C]-18.8005836727666[/C][/ROW]
[ROW][C]-0.087809207843086[/C][/ROW]
[ROW][C]31.6742171360919[/C][/ROW]
[ROW][C]19.7780444396614[/C][/ROW]
[ROW][C]-39.8805773503001[/C][/ROW]
[ROW][C]-30.8725218355347[/C][/ROW]
[ROW][C]-24.0462130469381[/C][/ROW]
[ROW][C]59.0801588141248[/C][/ROW]
[ROW][C]-46.3712355516772[/C][/ROW]
[ROW][C]-0.209845470002021[/C][/ROW]
[ROW][C]-34.8714962005317[/C][/ROW]
[ROW][C]-2.68070063530275[/C][/ROW]
[ROW][C]-31.2148236550538[/C][/ROW]
[ROW][C]32.1026118141053[/C][/ROW]
[ROW][C]61.961204456991[/C][/ROW]
[ROW][C]-11.0908514597262[/C][/ROW]
[ROW][C]-17.3709632374006[/C][/ROW]
[ROW][C]36.0235691171691[/C][/ROW]
[ROW][C]9.8625045943802[/C][/ROW]
[ROW][C]-94.5822067805587[/C][/ROW]
[ROW][C]57.5257747267995[/C][/ROW]
[ROW][C]21.9755651206047[/C][/ROW]
[ROW][C]10.6227310131967[/C][/ROW]
[ROW][C]-11.9981494827979[/C][/ROW]
[ROW][C]-48.470682585790[/C][/ROW]
[ROW][C]39.788527501812[/C][/ROW]
[ROW][C]22.5578920227326[/C][/ROW]
[ROW][C]29.4483544963258[/C][/ROW]
[ROW][C]101.452786253041[/C][/ROW]
[ROW][C]-31.595658482905[/C][/ROW]
[ROW][C]34.5483263242259[/C][/ROW]
[ROW][C]18.3635711206508[/C][/ROW]
[ROW][C]-8.45568586107267[/C][/ROW]
[ROW][C]-83.4158404308507[/C][/ROW]
[ROW][C]-4.62877490197433[/C][/ROW]
[ROW][C]-57.3573669595227[/C][/ROW]
[ROW][C]-32.9975743651262[/C][/ROW]
[ROW][C]-24.7653139019548[/C][/ROW]
[ROW][C]-6.4837861495204[/C][/ROW]
[ROW][C]-36.6999272803440[/C][/ROW]
[/TABLE]
Source: https://freestatistics.org/blog/index.php?pk=69900&T=2

Globally Unique Identifier (entire table): ba.freestatistics.org/blog/index.php?pk=69900&T=2

As an alternative you can also use a QR Code:  

The GUIDs for individual cells are displayed in the table below:

Estimated ARIMA Residuals
Value
0.633621329294116
4.77836053550782
-5.03822536990257
15.4094104734941
-5.25636005092733
27.0606563293149
-18.8005836727666
-0.087809207843086
31.6742171360919
19.7780444396614
-39.8805773503001
-30.8725218355347
-24.0462130469381
59.0801588141248
-46.3712355516772
-0.209845470002021
-34.8714962005317
-2.68070063530275
-31.2148236550538
32.1026118141053
61.961204456991
-11.0908514597262
-17.3709632374006
36.0235691171691
9.8625045943802
-94.5822067805587
57.5257747267995
21.9755651206047
10.6227310131967
-11.9981494827979
-48.470682585790
39.788527501812
22.5578920227326
29.4483544963258
101.452786253041
-31.595658482905
34.5483263242259
18.3635711206508
-8.45568586107267
-83.4158404308507
-4.62877490197433
-57.3573669595227
-32.9975743651262
-24.7653139019548
-6.4837861495204
-36.6999272803440


Parameters (Session):
par1 = FALSE ; par2 = 1 ; par3 = 2 ; par4 = 1 ; par5 = 12 ; par6 = 3 ; par7 = 1 ; par8 = 2 ; par9 = 1 ;
Parameters (R input):
par1 = FALSE ; par2 = 1 ; par3 = 2 ; par4 = 1 ; par5 = 12 ; par6 = 3 ; par7 = 1 ; par8 = 2 ; par9 = 1 ;
R code (references can be found in the software module):
library(lattice)
if (par1 == 'TRUE') par1 <- TRUE
if (par1 == 'FALSE') par1 <- FALSE
par2 <- as.numeric(par2) #Box-Cox lambda transformation parameter
par3 <- as.numeric(par3) #degree of non-seasonal differencing
par4 <- as.numeric(par4) #degree of seasonal differencing
par5 <- as.numeric(par5) #seasonal period
par6 <- as.numeric(par6) #degree (p) of the non-seasonal AR(p) polynomial
par7 <- as.numeric(par7) #degree (q) of the non-seasonal MA(q) polynomial
par8 <- as.numeric(par8) #degree (P) of the seasonal AR(P) polynomial
par9 <- as.numeric(par9) #degree (Q) of the seasonal MA(Q) polynomial
armaGR <- function(arima.out, names, n){
try1 <- arima.out$coef
try2 <- sqrt(diag(arima.out$var.coef))
try.data.frame <- data.frame(matrix(NA,ncol=4,nrow=length(names)))
dimnames(try.data.frame) <- list(names,c('coef','std','tstat','pv'))
try.data.frame[,1] <- try1
for(i in 1:length(try2)) try.data.frame[which(rownames(try.data.frame)==names(try2)[i]),2] <- try2[i]
try.data.frame[,3] <- try.data.frame[,1] / try.data.frame[,2]
try.data.frame[,4] <- round((1-pt(abs(try.data.frame[,3]),df=n-(length(try2)+1)))*2,5)
vector <- rep(NA,length(names))
vector[is.na(try.data.frame[,4])] <- 0
maxi <- which.max(try.data.frame[,4])
continue <- max(try.data.frame[,4],na.rm=TRUE) > .05
vector[maxi] <- 0
list(summary=try.data.frame,next.vector=vector,continue=continue)
}
arimaSelect <- function(series, order=c(13,0,0), seasonal=list(order=c(2,0,0),period=12), include.mean=F){
nrc <- order[1]+order[3]+seasonal$order[1]+seasonal$order[3]
coeff <- matrix(NA, nrow=nrc*2, ncol=nrc)
pval <- matrix(NA, nrow=nrc*2, ncol=nrc)
mylist <- rep(list(NULL), nrc)
names <- NULL
if(order[1] > 0) names <- paste('ar',1:order[1],sep='')
if(order[3] > 0) names <- c( names , paste('ma',1:order[3],sep='') )
if(seasonal$order[1] > 0) names <- c(names, paste('sar',1:seasonal$order[1],sep=''))
if(seasonal$order[3] > 0) names <- c(names, paste('sma',1:seasonal$order[3],sep=''))
arima.out <- arima(series, order=order, seasonal=seasonal, include.mean=include.mean, method='ML')
mylist[[1]] <- arima.out
last.arma <- armaGR(arima.out, names, length(series))
mystop <- FALSE
i <- 1
coeff[i,] <- last.arma[[1]][,1]
pval [i,] <- last.arma[[1]][,4]
i <- 2
aic <- arima.out$aic
while(!mystop){
mylist[[i]] <- arima.out
arima.out <- arima(series, order=order, seasonal=seasonal, include.mean=include.mean, method='ML', fixed=last.arma$next.vector)
aic <- c(aic, arima.out$aic)
last.arma <- armaGR(arima.out, names, length(series))
mystop <- !last.arma$continue
coeff[i,] <- last.arma[[1]][,1]
pval [i,] <- last.arma[[1]][,4]
i <- i+1
}
list(coeff, pval, mylist, aic=aic)
}
arimaSelectplot <- function(arimaSelect.out,noms,choix){
noms <- names(arimaSelect.out[[3]][[1]]$coef)
coeff <- arimaSelect.out[[1]]
k <- min(which(is.na(coeff[,1])))-1
coeff <- coeff[1:k,]
pval <- arimaSelect.out[[2]][1:k,]
aic <- arimaSelect.out$aic[1:k]
coeff[coeff==0] <- NA
n <- ncol(coeff)
if(missing(choix)) choix <- k
layout(matrix(c(1,1,1,2,
3,3,3,2,
3,3,3,4,
5,6,7,7),nr=4),
widths=c(10,35,45,15),
heights=c(30,30,15,15))
couleurs <- rainbow(75)[1:50]#(50)
ticks <- pretty(coeff)
par(mar=c(1,1,3,1))
plot(aic,k:1-.5,type='o',pch=21,bg='blue',cex=2,axes=F,lty=2,xpd=NA)
points(aic[choix],k-choix+.5,pch=21,cex=4,bg=2,xpd=NA)
title('aic',line=2)
par(mar=c(3,0,0,0))
plot(0,axes=F,xlab='',ylab='',xlim=range(ticks),ylim=c(.1,1))
rect(xleft = min(ticks) + (0:49)/50*(max(ticks)-min(ticks)),
xright = min(ticks) + (1:50)/50*(max(ticks)-min(ticks)),
ytop = rep(1,50),
ybottom= rep(0,50),col=couleurs,border=NA)
axis(1,ticks)
rect(xleft=min(ticks),xright=max(ticks),ytop=1,ybottom=0)
text(mean(coeff,na.rm=T),.5,'coefficients',cex=2,font=2)
par(mar=c(1,1,3,1))
image(1:n,1:k,t(coeff[k:1,]),axes=F,col=couleurs,zlim=range(ticks))
for(i in 1:n) for(j in 1:k) if(!is.na(coeff[j,i])) {
if(pval[j,i]<.01) symb = 'green'
else if( (pval[j,i]<.05) & (pval[j,i]>=.01)) symb = 'orange'
else if( (pval[j,i]<.1) & (pval[j,i]>=.05)) symb = 'red'
else symb = 'black'
polygon(c(i+.5 ,i+.2 ,i+.5 ,i+.5),
c(k-j+0.5,k-j+0.5,k-j+0.8,k-j+0.5),
col=symb)
if(j==choix) {
rect(xleft=i-.5,
xright=i+.5,
ybottom=k-j+1.5,
ytop=k-j+.5,
lwd=4)
text(i,
k-j+1,
round(coeff[j,i],2),
cex=1.2,
font=2)
}
else{
rect(xleft=i-.5,xright=i+.5,ybottom=k-j+1.5,ytop=k-j+.5)
text(i,k-j+1,round(coeff[j,i],2),cex=1.2,font=1)
}
}
axis(3,1:n,noms)
par(mar=c(0.5,0,0,0.5))
plot(0,axes=F,xlab='',ylab='',type='n',xlim=c(0,8),ylim=c(-.2,.8))
cols <- c('green','orange','red','black')
niv <- c('0','0.01','0.05','0.1')
for(i in 0:3){
polygon(c(1+2*i ,1+2*i ,1+2*i-.5 ,1+2*i),
c(.4 ,.7 , .4 , .4),
col=cols[i+1])
text(2*i,0.5,niv[i+1],cex=1.5)
}
text(8,.5,1,cex=1.5)
text(4,0,'p-value',cex=2)
box()
residus <- arimaSelect.out[[3]][[choix]]$res
par(mar=c(1,2,4,1))
acf(residus,main='')
title('acf',line=.5)
par(mar=c(1,2,4,1))
pacf(residus,main='')
title('pacf',line=.5)
par(mar=c(2,2,4,1))
qqnorm(residus,main='')
title('qq-norm',line=.5)
qqline(residus)
residus
}
if (par2 == 0) x <- log(x)
if (par2 != 0) x <- x^par2
(selection <- arimaSelect(x, order=c(par6,par3,par7), seasonal=list(order=c(par8,par4,par9), period=par5)))
bitmap(file='test1.png')
resid <- arimaSelectplot(selection)
dev.off()
resid
bitmap(file='test2.png')
acf(resid,length(resid)/2, main='Residual Autocorrelation Function')
dev.off()
bitmap(file='test3.png')
pacf(resid,length(resid)/2, main='Residual Partial Autocorrelation Function')
dev.off()
bitmap(file='test4.png')
cpgram(resid, main='Residual Cumulative Periodogram')
dev.off()
bitmap(file='test5.png')
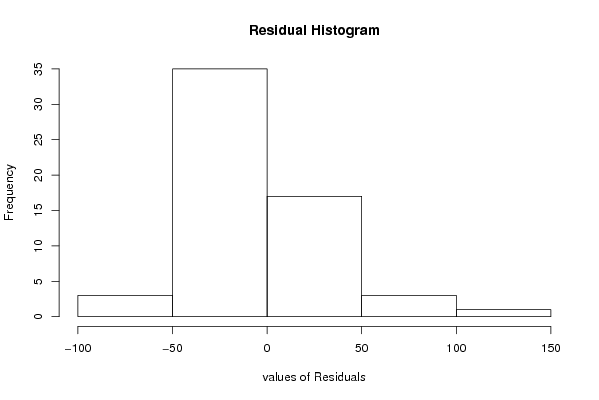
hist(resid, main='Residual Histogram', xlab='values of Residuals')
dev.off()
bitmap(file='test6.png')
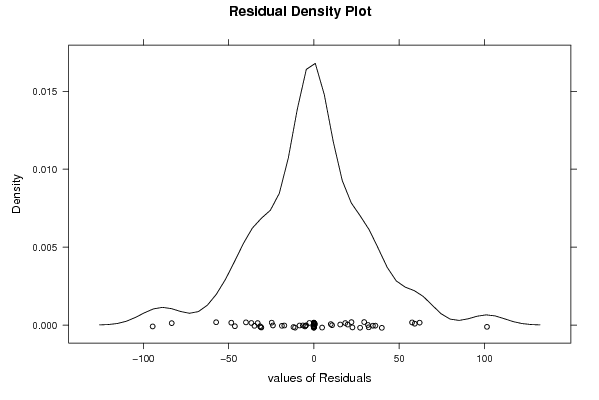
densityplot(~resid,col='black',main='Residual Density Plot', xlab='values of Residuals')
dev.off()
bitmap(file='test7.png')
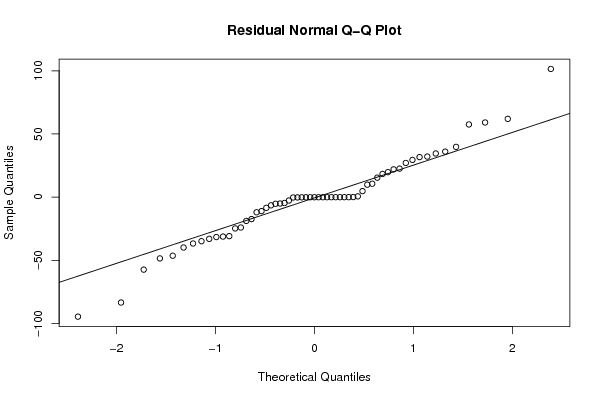
qqnorm(resid, main='Residual Normal Q-Q Plot')
qqline(resid)
dev.off()
ncols <- length(selection[[1]][1,])
nrows <- length(selection[[2]][,1])-1
load(file='createtable')
a<-table.start()
a<-table.row.start(a)
a<-table.element(a,'ARIMA Parameter Estimation and Backward Selection', ncols+1,TRUE)
a<-table.row.end(a)
a<-table.row.start(a)
a<-table.element(a,'Iteration', header=TRUE)
for (i in 1:ncols) {
a<-table.element(a,names(selection[[3]][[1]]$coef)[i],header=TRUE)
}
a<-table.row.end(a)
for (j in 1:nrows) {
a<-table.row.start(a)
mydum <- 'Estimates ('
mydum <- paste(mydum,j)
mydum <- paste(mydum,')')
a<-table.element(a,mydum, header=TRUE)
for (i in 1:ncols) {
a<-table.element(a,round(selection[[1]][j,i],4))
}
a<-table.row.end(a)
a<-table.row.start(a)
a<-table.element(a,'(p-val)', header=TRUE)
for (i in 1:ncols) {
mydum <- '('
mydum <- paste(mydum,round(selection[[2]][j,i],4),sep='')
mydum <- paste(mydum,')')
a<-table.element(a,mydum)
}
a<-table.row.end(a)
}
a<-table.end(a)
table.save(a,file='mytable.tab')
a<-table.start()
a<-table.row.start(a)
a<-table.element(a,'Estimated ARIMA Residuals', 1,TRUE)
a<-table.row.end(a)
a<-table.row.start(a)
a<-table.element(a,'Value', 1,TRUE)
a<-table.row.end(a)
for (i in (par4*par5+par3):length(resid)) {
a<-table.row.start(a)
a<-table.element(a,resid[i])
a<-table.row.end(a)
}
a<-table.end(a)
table.save(a,file='mytable1.tab')