Free Statistics

of Irreproducible Research!

Author's title

Author*The author of this computation has been verified*
R Software Modulerwasp_multipleregression.wasp
Title produced by softwareMultiple Regression
Date of computationSun, 20 Dec 2009 08:09:56 -0700
Cite this page as followsStatistical Computations at FreeStatistics.org, Office for Research Development and Education, URL https://freestatistics.org/blog/index.php?v=date/2009/Dec/20/t1261323491xeifv8ovdyvnq6w.htm/, Retrieved Sat, 27 Apr 2024 10:52:54 +0000
Statistical Computations at FreeStatistics.org, Office for Research Development and Education, URL https://freestatistics.org/blog/index.php?pk=69917, Retrieved Sat, 27 Apr 2024 10:52:54 +0000
QR Codes:

Original text written by user:
IsPrivate?No (this computation is public)
User-defined keywords
Estimated Impact123
Family? (F = Feedback message, R = changed R code, M = changed R Module, P = changed Parameters, D = changed Data)
-     [Multiple Regression] [Q1 The Seatbeltlaw] [2007-11-14 19:27:43] [8cd6641b921d30ebe00b648d1481bba0]
- RM D  [Multiple Regression] [Seatbelt] [2009-11-12 14:10:54] [b98453cac15ba1066b407e146608df68]
-    D      [Multiple Regression] [] [2009-12-20 15:09:56] [aa8eb70c35ea8a87edcd21d6427e653e] [Current]
Feedback Forum

Post a new message
Dataseries X:
2849,27	10872	2756,76	2645,64	2497,84	2448,05	2454,62	2407,6	2472,81	2408,64	2440,25	2350,44	2196,72	2174,56
2921,44	10625	2849,27	2756,76	2645,64	2497,84	2448,05	2454,62	2407,6	2472,81	2408,64	2440,25	2350,44	2196,72
2981,85	10407	2921,44	2849,27	2756,76	2645,64	2497,84	2448,05	2454,62	2407,6	2472,81	2408,64	2440,25	2350,44
3080,58	10463	2981,85	2921,44	2849,27	2756,76	2645,64	2497,84	2448,05	2454,62	2407,6	2472,81	2408,64	2440,25
3106,22	10556	3080,58	2981,85	2921,44	2849,27	2756,76	2645,64	2497,84	2448,05	2454,62	2407,6	2472,81	2408,64
3119,31	10646	3106,22	3080,58	2981,85	2921,44	2849,27	2756,76	2645,64	2497,84	2448,05	2454,62	2407,6	2472,81
3061,26	10702	3119,31	3106,22	3080,58	2981,85	2921,44	2849,27	2756,76	2645,64	2497,84	2448,05	2454,62	2407,6
3097,31	11353	3061,26	3119,31	3106,22	3080,58	2981,85	2921,44	2849,27	2756,76	2645,64	2497,84	2448,05	2454,62
3161,69	11346	3097,31	3061,26	3119,31	3106,22	3080,58	2981,85	2921,44	2849,27	2756,76	2645,64	2497,84	2448,05
3257,16	11451	3161,69	3097,31	3061,26	3119,31	3106,22	3080,58	2981,85	2921,44	2849,27	2756,76	2645,64	2497,84
3277,01	11964	3257,16	3161,69	3097,31	3061,26	3119,31	3106,22	3080,58	2981,85	2921,44	2849,27	2756,76	2645,64
3295,32	12574	3277,01	3257,16	3161,69	3097,31	3061,26	3119,31	3106,22	3080,58	2981,85	2921,44	2849,27	2756,76
3363,99	13031	3295,32	3277,01	3257,16	3161,69	3097,31	3061,26	3119,31	3106,22	3080,58	2981,85	2921,44	2849,27
3494,17	13812	3363,99	3295,32	3277,01	3257,16	3161,69	3097,31	3061,26	3119,31	3106,22	3080,58	2981,85	2921,44
3667,03	14544	3494,17	3363,99	3295,32	3277,01	3257,16	3161,69	3097,31	3061,26	3119,31	3106,22	3080,58	2981,85
3813,06	14931	3667,03	3494,17	3363,99	3295,32	3277,01	3257,16	3161,69	3097,31	3061,26	3119,31	3106,22	3080,58
3917,96	14886	3813,06	3667,03	3494,17	3363,99	3295,32	3277,01	3257,16	3161,69	3097,31	3061,26	3119,31	3106,22
3895,51	16005	3917,96	3813,06	3667,03	3494,17	3363,99	3295,32	3277,01	3257,16	3161,69	3097,31	3061,26	3119,31
3801,06	17064	3895,51	3917,96	3813,06	3667,03	3494,17	3363,99	3295,32	3277,01	3257,16	3161,69	3097,31	3061,26
3570,12	15168	3801,06	3895,51	3917,96	3813,06	3667,03	3494,17	3363,99	3295,32	3277,01	3257,16	3161,69	3097,31
3701,61	16050	3570,12	3801,06	3895,51	3917,96	3813,06	3667,03	3494,17	3363,99	3295,32	3277,01	3257,16	3161,69
3862,27	15839	3701,61	3570,12	3801,06	3895,51	3917,96	3813,06	3667,03	3494,17	3363,99	3295,32	3277,01	3257,16
3970,1	15137	3862,27	3701,61	3570,12	3801,06	3895,51	3917,96	3813,06	3667,03	3494,17	3363,99	3295,32	3277,01
4138,52	14954	3970,1	3862,27	3701,61	3570,12	3801,06	3895,51	3917,96	3813,06	3667,03	3494,17	3363,99	3295,32
4199,75	15648	4138,52	3970,1	3862,27	3701,61	3570,12	3801,06	3895,51	3917,96	3813,06	3667,03	3494,17	3363,99
4290,89	15305	4199,75	4138,52	3970,1	3862,27	3701,61	3570,12	3801,06	3895,51	3917,96	3813,06	3667,03	3494,17
4443,91	15579	4290,89	4199,75	4138,52	3970,1	3862,27	3701,61	3570,12	3801,06	3895,51	3917,96	3813,06	3667,03
4502,64	16348	4443,91	4290,89	4199,75	4138,52	3970,1	3862,27	3701,61	3570,12	3801,06	3895,51	3917,96	3813,06
4356,98	15928	4502,64	4443,91	4290,89	4199,75	4138,52	3970,1	3862,27	3701,61	3570,12	3801,06	3895,51	3917,96
4591,27	16171	4356,98	4502,64	4443,91	4290,89	4199,75	4138,52	3970,1	3862,27	3701,61	3570,12	3801,06	3895,51
4696,96	15937	4591,27	4356,98	4502,64	4443,91	4290,89	4199,75	4138,52	3970,1	3862,27	3701,61	3570,12	3801,06
4621,4	15713	4696,96	4591,27	4356,98	4502,64	4443,91	4290,89	4199,75	4138,52	3970,1	3862,27	3701,61	3570,12
4562,84	15594	4621,4	4696,96	4591,27	4356,98	4502,64	4443,91	4290,89	4199,75	4138,52	3970,1	3862,27	3701,61
4202,52	15683	4562,84	4621,4	4696,96	4591,27	4356,98	4502,64	4443,91	4290,89	4199,75	4138,52	3970,1	3862,27
4296,49	16438	4202,52	4562,84	4621,4	4696,96	4591,27	4356,98	4502,64	4443,91	4290,89	4199,75	4138,52	3970,1
4435,23	17032	4296,49	4202,52	4562,84	4621,4	4696,96	4591,27	4356,98	4502,64	4443,91	4290,89	4199,75	4138,52
4105,18	17696	4435,23	4296,49	4202,52	4562,84	4621,4	4696,96	4591,27	4356,98	4502,64	4443,91	4290,89	4199,75
4116,68	17745	4105,18	4435,23	4296,49	4202,52	4562,84	4621,4	4696,96	4591,27	4356,98	4502,64	4443,91	4290,89
3844,49	19394	4116,68	4105,18	4435,23	4296,49	4202,52	4562,84	4621,4	4696,96	4591,27	4356,98	4502,64	4443,91
3720,98	20148	3844,49	4116,68	4105,18	4435,23	4296,49	4202,52	4562,84	4621,4	4696,96	4591,27	4356,98	4502,64
3674,4	20108	3720,98	3844,49	4116,68	4105,18	4435,23	4296,49	4202,52	4562,84	4621,4	4696,96	4591,27	4356,98
3857,62	18584	3674,4	3720,98	3844,49	4116,68	4105,18	4435,23	4296,49	4202,52	4562,84	4621,4	4696,96	4591,27
3801,06	18441	3857,62	3674,4	3720,98	3844,49	4116,68	4105,18	4435,23	4296,49	4202,52	4562,84	4621,4	4696,96
3504,37	18391	3801,06	3857,62	3674,4	3720,98	3844,49	4116,68	4105,18	4435,23	4296,49	4202,52	4562,84	4621,4
3032,6	19178	3504,37	3801,06	3857,62	3674,4	3720,98	3844,49	4116,68	4105,18	4435,23	4296,49	4202,52	4562,84
3047,03	18079	3032,6	3504,37	3801,06	3857,62	3674,4	3720,98	3844,49	4116,68	4105,18	4435,23	4296,49	4202,52
2962,34	18483	3047,03	3032,6	3504,37	3801,06	3857,62	3674,4	3720,98	3844,49	4116,68	4105,18	4435,23	4296,49
2197,82	19644	2962,34	3047,03	3032,6	3504,37	3801,06	3857,62	3674,4	3720,98	3844,49	4116,68	4105,18	4435,23
2014,45	19195	2197,82	2962,34	3047,03	3032,6	3504,37	3801,06	3857,62	3674,4	3720,98	3844,49	4116,68	4105,18
1862,83	19650	2014,45	2197,82	2962,34	3047,03	3032,6	3504,37	3801,06	3857,62	3674,4	3720,98	3844,49	4116,68
1905,41	20830	1862,83	2014,45	2197,82	2962,34	3047,03	3032,6	3504,37	3801,06	3857,62	3674,4	3720,98	3844,49
1810,99	23595	1905,41	1862,83	2014,45	2197,82	2962,34	3047,03	3032,6	3504,37	3801,06	3857,62	3674,4	3720,98
1670,07	22937	1810,99	1905,41	1862,83	2014,45	2197,82	2962,34	3047,03	3032,6	3504,37	3801,06	3857,62	3674,4
1864,44	21814	1670,07	1810,99	1905,41	1862,83	2014,45	2197,82	2962,34	3047,03	3032,6	3504,37	3801,06	3857,62
2052,02	21928	1864,44	1670,07	1810,99	1905,41	1862,83	2014,45	2197,82	2962,34	3047,03	3032,6	3504,37	3801,06
2029,6	21777	2052,02	1864,44	1670,07	1810,99	1905,41	1862,83	2014,45	2197,82	2962,34	3047,03	3032,6	3504,37
2070,83	21383	2029,6	2052,02	1864,44	1670,07	1810,99	1905,41	1862,83	2014,45	2197,82	2962,34	3047,03	3032,6
2293,41	21467	2070,83	2029,6	2052,02	1864,44	1670,07	1810,99	1905,41	1862,83	2014,45	2197,82	2962,34	3047,03
2443,27	22052	2293,41	2070,83	2029,6	2052,02	1864,44	1670,07	1810,99	1905,41	1862,83	2014,45	2197,82	2962,34
2513,17	22680	2443,27	2293,41	2070,83	2029,6	2052,02	1864,44	1670,07	1810,99	1905,41	1862,83	2014,45	2197,82


Summary of computational transaction
Raw Inputview raw input (R code)
Raw Outputview raw output of R engine
Computing time4 seconds
R Server'Gwilym Jenkins' @ 72.249.127.135

\begin{tabular}{lllllllll}
\hline
Summary of computational transaction \tabularnewline
Raw Input & view raw input (R code)  \tabularnewline
Raw Output & view raw output of R engine  \tabularnewline
Computing time & 4 seconds \tabularnewline
R Server & 'Gwilym Jenkins' @ 72.249.127.135 \tabularnewline
\hline
\end{tabular}
%Source: https://freestatistics.org/blog/index.php?pk=69917&T=0

[TABLE]
[ROW][C]Summary of computational transaction[/C][/ROW]
[ROW][C]Raw Input[/C][C]view raw input (R code) [/C][/ROW]
[ROW][C]Raw Output[/C][C]view raw output of R engine [/C][/ROW]
[ROW][C]Computing time[/C][C]4 seconds[/C][/ROW]
[ROW][C]R Server[/C][C]'Gwilym Jenkins' @ 72.249.127.135[/C][/ROW]
[/TABLE]
Source: https://freestatistics.org/blog/index.php?pk=69917&T=0

Globally Unique Identifier (entire table): ba.freestatistics.org/blog/index.php?pk=69917&T=0

As an alternative you can also use a QR Code:  

The GUIDs for individual cells are displayed in the table below:

Summary of computational transaction
Raw Inputview raw input (R code)
Raw Outputview raw output of R engine
Computing time4 seconds
R Server'Gwilym Jenkins' @ 72.249.127.135


Multiple Linear Regression - Estimated Regression Equation
Y[t] = + 263.734200766228 + 0.000253339919810202X[t] + 1.23877863761127Y1[t] -0.317282826192632Y2[t] + 0.169813272838906Y3[t] -0.0593898141762464Y4[t] + 0.230078665812567Y5[t] -0.455301377384477Y6[t] + 0.133074244597905Y7[t] + 0.144344462501845Y8[t] + 0.0194396382456085Y9[t] -0.264854112662661Y10[t] + 0.55307300684554Y11[t] -0.525001084215331Y12[t] + 47.9017286725281M1[t] + 94.2651699586358M2[t] + 60.4857327806912M3[t] + 121.951904260527M4[t] + 40.5584718885717M5[t] + 228.392489428843M6[t] + 66.902963518707M7[t] -25.7832520296353M8[t] + 39.6934894694768M9[t] + 58.4457634559164M10[t] + 78.4448469281772M11[t] + 3.98110966935865t + e[t]

\begin{tabular}{lllllllll}
\hline
Multiple Linear Regression - Estimated Regression Equation \tabularnewline
Y[t] =  +  263.734200766228 +  0.000253339919810202X[t] +  1.23877863761127Y1[t] -0.317282826192632Y2[t] +  0.169813272838906Y3[t] -0.0593898141762464Y4[t] +  0.230078665812567Y5[t] -0.455301377384477Y6[t] +  0.133074244597905Y7[t] +  0.144344462501845Y8[t] +  0.0194396382456085Y9[t] -0.264854112662661Y10[t] +  0.55307300684554Y11[t] -0.525001084215331Y12[t] +  47.9017286725281M1[t] +  94.2651699586358M2[t] +  60.4857327806912M3[t] +  121.951904260527M4[t] +  40.5584718885717M5[t] +  228.392489428843M6[t] +  66.902963518707M7[t] -25.7832520296353M8[t] +  39.6934894694768M9[t] +  58.4457634559164M10[t] +  78.4448469281772M11[t] +  3.98110966935865t  + e[t] \tabularnewline
\hline
\end{tabular}
%Source: https://freestatistics.org/blog/index.php?pk=69917&T=1

[TABLE]
[ROW][C]Multiple Linear Regression - Estimated Regression Equation[/C][/ROW]
[ROW][C]Y[t] =  +  263.734200766228 +  0.000253339919810202X[t] +  1.23877863761127Y1[t] -0.317282826192632Y2[t] +  0.169813272838906Y3[t] -0.0593898141762464Y4[t] +  0.230078665812567Y5[t] -0.455301377384477Y6[t] +  0.133074244597905Y7[t] +  0.144344462501845Y8[t] +  0.0194396382456085Y9[t] -0.264854112662661Y10[t] +  0.55307300684554Y11[t] -0.525001084215331Y12[t] +  47.9017286725281M1[t] +  94.2651699586358M2[t] +  60.4857327806912M3[t] +  121.951904260527M4[t] +  40.5584718885717M5[t] +  228.392489428843M6[t] +  66.902963518707M7[t] -25.7832520296353M8[t] +  39.6934894694768M9[t] +  58.4457634559164M10[t] +  78.4448469281772M11[t] +  3.98110966935865t  + e[t][/C][/ROW]
[/TABLE]
Source: https://freestatistics.org/blog/index.php?pk=69917&T=1

Globally Unique Identifier (entire table): ba.freestatistics.org/blog/index.php?pk=69917&T=1

As an alternative you can also use a QR Code:  

The GUIDs for individual cells are displayed in the table below:

Multiple Linear Regression - Estimated Regression Equation
Y[t] = + 263.734200766228 + 0.000253339919810202X[t] + 1.23877863761127Y1[t] -0.317282826192632Y2[t] + 0.169813272838906Y3[t] -0.0593898141762464Y4[t] + 0.230078665812567Y5[t] -0.455301377384477Y6[t] + 0.133074244597905Y7[t] + 0.144344462501845Y8[t] + 0.0194396382456085Y9[t] -0.264854112662661Y10[t] + 0.55307300684554Y11[t] -0.525001084215331Y12[t] + 47.9017286725281M1[t] + 94.2651699586358M2[t] + 60.4857327806912M3[t] + 121.951904260527M4[t] + 40.5584718885717M5[t] + 228.392489428843M6[t] + 66.902963518707M7[t] -25.7832520296353M8[t] + 39.6934894694768M9[t] + 58.4457634559164M10[t] + 78.4448469281772M11[t] + 3.98110966935865t + e[t]


Multiple Linear Regression - Ordinary Least Squares
VariableParameterS.D.T-STATH0: parameter = 02-tail p-value1-tail p-value
(Intercept)263.734200766228318.6720450.82760.4136660.206833
X0.0002533399198102020.0266480.00950.992470.496235
Y11.238778637611270.155157.984400
Y2-0.3172828261926320.242012-1.3110.1986360.099318
Y30.1698132728389060.2447080.69390.4924320.246216
Y4-0.05938981417624640.246685-0.24080.8111940.405597
Y50.2300786658125670.2434120.94520.3512140.175607
Y6-0.4553013773844770.245696-1.85310.0725620.036281
Y70.1330742445979050.2475210.53760.5943360.297168
Y80.1443444625018450.2421460.59610.5550530.277527
Y90.01943963824560850.2464110.07890.9375820.468791
Y10-0.2648541126626610.244295-1.08420.2859240.142962
Y110.553073006845540.2480932.22930.0325070.016254
Y12-0.5250010842153310.191239-2.74530.009590.004795
M147.9017286725281118.2618710.4050.687980.34399
M294.2651699586358121.0233410.77890.4414260.220713
M360.4857327806912123.4367820.490.6272710.313636
M4121.951904260527123.8014330.98510.3315530.165776
M540.5584718885717122.9926990.32980.7436020.371801
M6228.392489428843125.4224461.8210.0774190.03871
M766.902963518707120.6873840.55430.5829680.291484
M8-25.7832520296353113.91537-0.22630.8222950.411147
M939.6934894694768117.4518430.3380.7374750.368737
M1058.4457634559164121.2937470.48190.6329980.316499
M1178.4448469281772115.3955370.67980.5012390.25062
t3.981109669358656.6498760.59870.5533580.276679

\begin{tabular}{lllllllll}
\hline
Multiple Linear Regression - Ordinary Least Squares \tabularnewline
Variable & Parameter & S.D. & T-STATH0: parameter = 0 & 2-tail p-value & 1-tail p-value \tabularnewline
(Intercept) & 263.734200766228 & 318.672045 & 0.8276 & 0.413666 & 0.206833 \tabularnewline
X & 0.000253339919810202 & 0.026648 & 0.0095 & 0.99247 & 0.496235 \tabularnewline
Y1 & 1.23877863761127 & 0.15515 & 7.9844 & 0 & 0 \tabularnewline
Y2 & -0.317282826192632 & 0.242012 & -1.311 & 0.198636 & 0.099318 \tabularnewline
Y3 & 0.169813272838906 & 0.244708 & 0.6939 & 0.492432 & 0.246216 \tabularnewline
Y4 & -0.0593898141762464 & 0.246685 & -0.2408 & 0.811194 & 0.405597 \tabularnewline
Y5 & 0.230078665812567 & 0.243412 & 0.9452 & 0.351214 & 0.175607 \tabularnewline
Y6 & -0.455301377384477 & 0.245696 & -1.8531 & 0.072562 & 0.036281 \tabularnewline
Y7 & 0.133074244597905 & 0.247521 & 0.5376 & 0.594336 & 0.297168 \tabularnewline
Y8 & 0.144344462501845 & 0.242146 & 0.5961 & 0.555053 & 0.277527 \tabularnewline
Y9 & 0.0194396382456085 & 0.246411 & 0.0789 & 0.937582 & 0.468791 \tabularnewline
Y10 & -0.264854112662661 & 0.244295 & -1.0842 & 0.285924 & 0.142962 \tabularnewline
Y11 & 0.55307300684554 & 0.248093 & 2.2293 & 0.032507 & 0.016254 \tabularnewline
Y12 & -0.525001084215331 & 0.191239 & -2.7453 & 0.00959 & 0.004795 \tabularnewline
M1 & 47.9017286725281 & 118.261871 & 0.405 & 0.68798 & 0.34399 \tabularnewline
M2 & 94.2651699586358 & 121.023341 & 0.7789 & 0.441426 & 0.220713 \tabularnewline
M3 & 60.4857327806912 & 123.436782 & 0.49 & 0.627271 & 0.313636 \tabularnewline
M4 & 121.951904260527 & 123.801433 & 0.9851 & 0.331553 & 0.165776 \tabularnewline
M5 & 40.5584718885717 & 122.992699 & 0.3298 & 0.743602 & 0.371801 \tabularnewline
M6 & 228.392489428843 & 125.422446 & 1.821 & 0.077419 & 0.03871 \tabularnewline
M7 & 66.902963518707 & 120.687384 & 0.5543 & 0.582968 & 0.291484 \tabularnewline
M8 & -25.7832520296353 & 113.91537 & -0.2263 & 0.822295 & 0.411147 \tabularnewline
M9 & 39.6934894694768 & 117.451843 & 0.338 & 0.737475 & 0.368737 \tabularnewline
M10 & 58.4457634559164 & 121.293747 & 0.4819 & 0.632998 & 0.316499 \tabularnewline
M11 & 78.4448469281772 & 115.395537 & 0.6798 & 0.501239 & 0.25062 \tabularnewline
t & 3.98110966935865 & 6.649876 & 0.5987 & 0.553358 & 0.276679 \tabularnewline
\hline
\end{tabular}
%Source: https://freestatistics.org/blog/index.php?pk=69917&T=2

[TABLE]
[ROW][C]Multiple Linear Regression - Ordinary Least Squares[/C][/ROW]
[ROW][C]Variable[/C][C]Parameter[/C][C]S.D.[/C][C]T-STATH0: parameter = 0[/C][C]2-tail p-value[/C][C]1-tail p-value[/C][/ROW]
[ROW][C](Intercept)[/C][C]263.734200766228[/C][C]318.672045[/C][C]0.8276[/C][C]0.413666[/C][C]0.206833[/C][/ROW]
[ROW][C]X[/C][C]0.000253339919810202[/C][C]0.026648[/C][C]0.0095[/C][C]0.99247[/C][C]0.496235[/C][/ROW]
[ROW][C]Y1[/C][C]1.23877863761127[/C][C]0.15515[/C][C]7.9844[/C][C]0[/C][C]0[/C][/ROW]
[ROW][C]Y2[/C][C]-0.317282826192632[/C][C]0.242012[/C][C]-1.311[/C][C]0.198636[/C][C]0.099318[/C][/ROW]
[ROW][C]Y3[/C][C]0.169813272838906[/C][C]0.244708[/C][C]0.6939[/C][C]0.492432[/C][C]0.246216[/C][/ROW]
[ROW][C]Y4[/C][C]-0.0593898141762464[/C][C]0.246685[/C][C]-0.2408[/C][C]0.811194[/C][C]0.405597[/C][/ROW]
[ROW][C]Y5[/C][C]0.230078665812567[/C][C]0.243412[/C][C]0.9452[/C][C]0.351214[/C][C]0.175607[/C][/ROW]
[ROW][C]Y6[/C][C]-0.455301377384477[/C][C]0.245696[/C][C]-1.8531[/C][C]0.072562[/C][C]0.036281[/C][/ROW]
[ROW][C]Y7[/C][C]0.133074244597905[/C][C]0.247521[/C][C]0.5376[/C][C]0.594336[/C][C]0.297168[/C][/ROW]
[ROW][C]Y8[/C][C]0.144344462501845[/C][C]0.242146[/C][C]0.5961[/C][C]0.555053[/C][C]0.277527[/C][/ROW]
[ROW][C]Y9[/C][C]0.0194396382456085[/C][C]0.246411[/C][C]0.0789[/C][C]0.937582[/C][C]0.468791[/C][/ROW]
[ROW][C]Y10[/C][C]-0.264854112662661[/C][C]0.244295[/C][C]-1.0842[/C][C]0.285924[/C][C]0.142962[/C][/ROW]
[ROW][C]Y11[/C][C]0.55307300684554[/C][C]0.248093[/C][C]2.2293[/C][C]0.032507[/C][C]0.016254[/C][/ROW]
[ROW][C]Y12[/C][C]-0.525001084215331[/C][C]0.191239[/C][C]-2.7453[/C][C]0.00959[/C][C]0.004795[/C][/ROW]
[ROW][C]M1[/C][C]47.9017286725281[/C][C]118.261871[/C][C]0.405[/C][C]0.68798[/C][C]0.34399[/C][/ROW]
[ROW][C]M2[/C][C]94.2651699586358[/C][C]121.023341[/C][C]0.7789[/C][C]0.441426[/C][C]0.220713[/C][/ROW]
[ROW][C]M3[/C][C]60.4857327806912[/C][C]123.436782[/C][C]0.49[/C][C]0.627271[/C][C]0.313636[/C][/ROW]
[ROW][C]M4[/C][C]121.951904260527[/C][C]123.801433[/C][C]0.9851[/C][C]0.331553[/C][C]0.165776[/C][/ROW]
[ROW][C]M5[/C][C]40.5584718885717[/C][C]122.992699[/C][C]0.3298[/C][C]0.743602[/C][C]0.371801[/C][/ROW]
[ROW][C]M6[/C][C]228.392489428843[/C][C]125.422446[/C][C]1.821[/C][C]0.077419[/C][C]0.03871[/C][/ROW]
[ROW][C]M7[/C][C]66.902963518707[/C][C]120.687384[/C][C]0.5543[/C][C]0.582968[/C][C]0.291484[/C][/ROW]
[ROW][C]M8[/C][C]-25.7832520296353[/C][C]113.91537[/C][C]-0.2263[/C][C]0.822295[/C][C]0.411147[/C][/ROW]
[ROW][C]M9[/C][C]39.6934894694768[/C][C]117.451843[/C][C]0.338[/C][C]0.737475[/C][C]0.368737[/C][/ROW]
[ROW][C]M10[/C][C]58.4457634559164[/C][C]121.293747[/C][C]0.4819[/C][C]0.632998[/C][C]0.316499[/C][/ROW]
[ROW][C]M11[/C][C]78.4448469281772[/C][C]115.395537[/C][C]0.6798[/C][C]0.501239[/C][C]0.25062[/C][/ROW]
[ROW][C]t[/C][C]3.98110966935865[/C][C]6.649876[/C][C]0.5987[/C][C]0.553358[/C][C]0.276679[/C][/ROW]
[/TABLE]
Source: https://freestatistics.org/blog/index.php?pk=69917&T=2

Globally Unique Identifier (entire table): ba.freestatistics.org/blog/index.php?pk=69917&T=2

As an alternative you can also use a QR Code:  

The GUIDs for individual cells are displayed in the table below:

Multiple Linear Regression - Ordinary Least Squares
VariableParameterS.D.T-STATH0: parameter = 02-tail p-value1-tail p-value
(Intercept)263.734200766228318.6720450.82760.4136660.206833
X0.0002533399198102020.0266480.00950.992470.496235
Y11.238778637611270.155157.984400
Y2-0.3172828261926320.242012-1.3110.1986360.099318
Y30.1698132728389060.2447080.69390.4924320.246216
Y4-0.05938981417624640.246685-0.24080.8111940.405597
Y50.2300786658125670.2434120.94520.3512140.175607
Y6-0.4553013773844770.245696-1.85310.0725620.036281
Y70.1330742445979050.2475210.53760.5943360.297168
Y80.1443444625018450.2421460.59610.5550530.277527
Y90.01943963824560850.2464110.07890.9375820.468791
Y10-0.2648541126626610.244295-1.08420.2859240.142962
Y110.553073006845540.2480932.22930.0325070.016254
Y12-0.5250010842153310.191239-2.74530.009590.004795
M147.9017286725281118.2618710.4050.687980.34399
M294.2651699586358121.0233410.77890.4414260.220713
M360.4857327806912123.4367820.490.6272710.313636
M4121.951904260527123.8014330.98510.3315530.165776
M540.5584718885717122.9926990.32980.7436020.371801
M6228.392489428843125.4224461.8210.0774190.03871
M766.902963518707120.6873840.55430.5829680.291484
M8-25.7832520296353113.91537-0.22630.8222950.411147
M939.6934894694768117.4518430.3380.7374750.368737
M1058.4457634559164121.2937470.48190.6329980.316499
M1178.4448469281772115.3955370.67980.5012390.25062
t3.981109669358656.6498760.59870.5533580.276679


Multiple Linear Regression - Regression Statistics
Multiple R0.988781225067778
R-squared0.977688311046536
Adjusted R-squared0.961282657404283
F-TEST (value)59.5945966168931
F-TEST (DF numerator)25
F-TEST (DF denominator)34
p-value0
Multiple Linear Regression - Residual Statistics
Residual Standard Deviation167.808885383951
Sum Squared Residuals957433.948469338

\begin{tabular}{lllllllll}
\hline
Multiple Linear Regression - Regression Statistics \tabularnewline
Multiple R & 0.988781225067778 \tabularnewline
R-squared & 0.977688311046536 \tabularnewline
Adjusted R-squared & 0.961282657404283 \tabularnewline
F-TEST (value) & 59.5945966168931 \tabularnewline
F-TEST (DF numerator) & 25 \tabularnewline
F-TEST (DF denominator) & 34 \tabularnewline
p-value & 0 \tabularnewline
Multiple Linear Regression - Residual Statistics \tabularnewline
Residual Standard Deviation & 167.808885383951 \tabularnewline
Sum Squared Residuals & 957433.948469338 \tabularnewline
\hline
\end{tabular}
%Source: https://freestatistics.org/blog/index.php?pk=69917&T=3

[TABLE]
[ROW][C]Multiple Linear Regression - Regression Statistics[/C][/ROW]
[ROW][C]Multiple R[/C][C]0.988781225067778[/C][/ROW]
[ROW][C]R-squared[/C][C]0.977688311046536[/C][/ROW]
[ROW][C]Adjusted R-squared[/C][C]0.961282657404283[/C][/ROW]
[ROW][C]F-TEST (value)[/C][C]59.5945966168931[/C][/ROW]
[ROW][C]F-TEST (DF numerator)[/C][C]25[/C][/ROW]
[ROW][C]F-TEST (DF denominator)[/C][C]34[/C][/ROW]
[ROW][C]p-value[/C][C]0[/C][/ROW]
[ROW][C]Multiple Linear Regression - Residual Statistics[/C][/ROW]
[ROW][C]Residual Standard Deviation[/C][C]167.808885383951[/C][/ROW]
[ROW][C]Sum Squared Residuals[/C][C]957433.948469338[/C][/ROW]
[/TABLE]
Source: https://freestatistics.org/blog/index.php?pk=69917&T=3

Globally Unique Identifier (entire table): ba.freestatistics.org/blog/index.php?pk=69917&T=3

As an alternative you can also use a QR Code:  

The GUIDs for individual cells are displayed in the table below:

Multiple Linear Regression - Regression Statistics
Multiple R0.988781225067778
R-squared0.977688311046536
Adjusted R-squared0.961282657404283
F-TEST (value)59.5945966168931
F-TEST (DF numerator)25
F-TEST (DF denominator)34
p-value0
Multiple Linear Regression - Residual Statistics
Residual Standard Deviation167.808885383951
Sum Squared Residuals957433.948469338


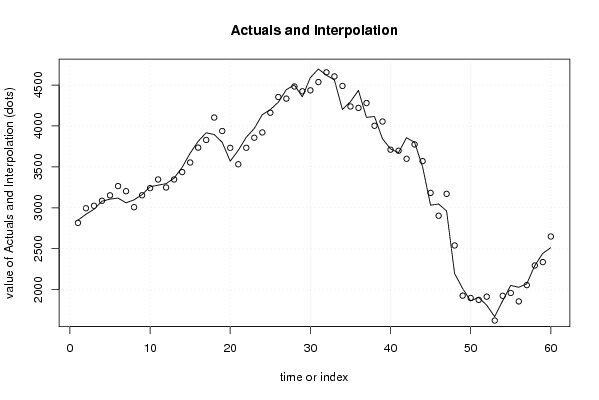
Multiple Linear Regression - Actuals, Interpolation, and Residuals
Time or IndexActualsInterpolationForecastResidualsPrediction Error
12849.272816.2750842820732.9949157179337
22921.442994.6896361064-73.2496361063972
32981.853024.85793243141-43.0079324314072
43080.583085.71836399457-5.13836399457217
53106.223152.44982234285-46.2298223428475
63119.313265.90736121444-146.597361214440
73061.263203.22651156427-141.966511564271
83097.313007.8695122921689.4404877078393
93161.693153.271570744548.41842925545732
103257.163241.0868300821216.0731699178766
113277.013346.56555055549-69.5555505554946
123295.323248.5803723467946.7396276532099
133363.993346.785898589417.2041014106021
143494.173436.7211932685657.4488067314444
153667.033553.93972106815113.090278931848
163813.063735.5124919722477.5475080277635
173917.963829.1968781233788.7631218766249
183895.514103.14352127401-207.633521274014
193801.063938.5486635358-137.488663535800
203570.123732.68652617856-162.566526178561
213701.613532.4409747153169.169025284701
223862.273733.35929508236128.910704917641
233970.13856.36344203787113.736557962129
244138.523921.27749320525217.242506794749
254199.754162.2580475705537.4919524294548
264290.894353.91182206719-63.021822067185
274443.914334.37922231134109.530777688664
284502.644482.342342982420.2976570176018
294356.984423.91805323185-66.9380532318512
304591.274435.50795617548155.762043824521
314696.964536.49989715262160.460102847375
324621.44655.78653367334-34.3865336733385
334562.844605.86279664817-43.0227966481657
344202.524489.22308052641-286.703080526411
354296.494238.7296780429157.7603219570854
364435.234220.70906782703214.520932172969
374105.184280.62612881557-175.446128815567
384116.684002.66949525508114.010504744920
393844.494054.47376382167-209.983763821667
403720.983710.5767065111210.4032934888799
413674.43697.39253654014-22.9925365401388
423857.623599.11699593431258.503004065688
433801.063774.6847838007926.3752161992075
443504.373569.97868720109-65.6086872010924
453032.63182.59820690516-149.998206905158
463047.032903.21761383401143.812386165994
472962.343170.51292384835-208.172923848345
482197.822540.18267213309-342.362672133095
492014.451926.6948407424287.7551592575769
501862.831898.01785330278-35.1878533027819
511905.411875.0393603674430.3706396325610
521810.991914.10009453967-103.110094539673
531670.071622.6727097617947.3972902382125
541864.441924.47416540175-60.0341654017546
552052.021959.4001439465192.6198560534883
562029.61856.47874065485173.121259345153
572070.832055.3964509868315.4335490131661
582293.412295.5031804751-2.09318047510133
592443.272337.03840551537106.231594484625
602513.172649.31039448783-136.140394487834

\begin{tabular}{lllllllll}
\hline
Multiple Linear Regression - Actuals, Interpolation, and Residuals \tabularnewline
Time or Index & Actuals & InterpolationForecast & ResidualsPrediction Error \tabularnewline
1 & 2849.27 & 2816.27508428207 & 32.9949157179337 \tabularnewline
2 & 2921.44 & 2994.6896361064 & -73.2496361063972 \tabularnewline
3 & 2981.85 & 3024.85793243141 & -43.0079324314072 \tabularnewline
4 & 3080.58 & 3085.71836399457 & -5.13836399457217 \tabularnewline
5 & 3106.22 & 3152.44982234285 & -46.2298223428475 \tabularnewline
6 & 3119.31 & 3265.90736121444 & -146.597361214440 \tabularnewline
7 & 3061.26 & 3203.22651156427 & -141.966511564271 \tabularnewline
8 & 3097.31 & 3007.86951229216 & 89.4404877078393 \tabularnewline
9 & 3161.69 & 3153.27157074454 & 8.41842925545732 \tabularnewline
10 & 3257.16 & 3241.08683008212 & 16.0731699178766 \tabularnewline
11 & 3277.01 & 3346.56555055549 & -69.5555505554946 \tabularnewline
12 & 3295.32 & 3248.58037234679 & 46.7396276532099 \tabularnewline
13 & 3363.99 & 3346.7858985894 & 17.2041014106021 \tabularnewline
14 & 3494.17 & 3436.72119326856 & 57.4488067314444 \tabularnewline
15 & 3667.03 & 3553.93972106815 & 113.090278931848 \tabularnewline
16 & 3813.06 & 3735.51249197224 & 77.5475080277635 \tabularnewline
17 & 3917.96 & 3829.19687812337 & 88.7631218766249 \tabularnewline
18 & 3895.51 & 4103.14352127401 & -207.633521274014 \tabularnewline
19 & 3801.06 & 3938.5486635358 & -137.488663535800 \tabularnewline
20 & 3570.12 & 3732.68652617856 & -162.566526178561 \tabularnewline
21 & 3701.61 & 3532.4409747153 & 169.169025284701 \tabularnewline
22 & 3862.27 & 3733.35929508236 & 128.910704917641 \tabularnewline
23 & 3970.1 & 3856.36344203787 & 113.736557962129 \tabularnewline
24 & 4138.52 & 3921.27749320525 & 217.242506794749 \tabularnewline
25 & 4199.75 & 4162.25804757055 & 37.4919524294548 \tabularnewline
26 & 4290.89 & 4353.91182206719 & -63.021822067185 \tabularnewline
27 & 4443.91 & 4334.37922231134 & 109.530777688664 \tabularnewline
28 & 4502.64 & 4482.3423429824 & 20.2976570176018 \tabularnewline
29 & 4356.98 & 4423.91805323185 & -66.9380532318512 \tabularnewline
30 & 4591.27 & 4435.50795617548 & 155.762043824521 \tabularnewline
31 & 4696.96 & 4536.49989715262 & 160.460102847375 \tabularnewline
32 & 4621.4 & 4655.78653367334 & -34.3865336733385 \tabularnewline
33 & 4562.84 & 4605.86279664817 & -43.0227966481657 \tabularnewline
34 & 4202.52 & 4489.22308052641 & -286.703080526411 \tabularnewline
35 & 4296.49 & 4238.72967804291 & 57.7603219570854 \tabularnewline
36 & 4435.23 & 4220.70906782703 & 214.520932172969 \tabularnewline
37 & 4105.18 & 4280.62612881557 & -175.446128815567 \tabularnewline
38 & 4116.68 & 4002.66949525508 & 114.010504744920 \tabularnewline
39 & 3844.49 & 4054.47376382167 & -209.983763821667 \tabularnewline
40 & 3720.98 & 3710.57670651112 & 10.4032934888799 \tabularnewline
41 & 3674.4 & 3697.39253654014 & -22.9925365401388 \tabularnewline
42 & 3857.62 & 3599.11699593431 & 258.503004065688 \tabularnewline
43 & 3801.06 & 3774.68478380079 & 26.3752161992075 \tabularnewline
44 & 3504.37 & 3569.97868720109 & -65.6086872010924 \tabularnewline
45 & 3032.6 & 3182.59820690516 & -149.998206905158 \tabularnewline
46 & 3047.03 & 2903.21761383401 & 143.812386165994 \tabularnewline
47 & 2962.34 & 3170.51292384835 & -208.172923848345 \tabularnewline
48 & 2197.82 & 2540.18267213309 & -342.362672133095 \tabularnewline
49 & 2014.45 & 1926.69484074242 & 87.7551592575769 \tabularnewline
50 & 1862.83 & 1898.01785330278 & -35.1878533027819 \tabularnewline
51 & 1905.41 & 1875.03936036744 & 30.3706396325610 \tabularnewline
52 & 1810.99 & 1914.10009453967 & -103.110094539673 \tabularnewline
53 & 1670.07 & 1622.67270976179 & 47.3972902382125 \tabularnewline
54 & 1864.44 & 1924.47416540175 & -60.0341654017546 \tabularnewline
55 & 2052.02 & 1959.40014394651 & 92.6198560534883 \tabularnewline
56 & 2029.6 & 1856.47874065485 & 173.121259345153 \tabularnewline
57 & 2070.83 & 2055.39645098683 & 15.4335490131661 \tabularnewline
58 & 2293.41 & 2295.5031804751 & -2.09318047510133 \tabularnewline
59 & 2443.27 & 2337.03840551537 & 106.231594484625 \tabularnewline
60 & 2513.17 & 2649.31039448783 & -136.140394487834 \tabularnewline
\hline
\end{tabular}
%Source: https://freestatistics.org/blog/index.php?pk=69917&T=4

[TABLE]
[ROW][C]Multiple Linear Regression - Actuals, Interpolation, and Residuals[/C][/ROW]
[ROW][C]Time or Index[/C][C]Actuals[/C][C]InterpolationForecast[/C][C]ResidualsPrediction Error[/C][/ROW]
[ROW][C]1[/C][C]2849.27[/C][C]2816.27508428207[/C][C]32.9949157179337[/C][/ROW]
[ROW][C]2[/C][C]2921.44[/C][C]2994.6896361064[/C][C]-73.2496361063972[/C][/ROW]
[ROW][C]3[/C][C]2981.85[/C][C]3024.85793243141[/C][C]-43.0079324314072[/C][/ROW]
[ROW][C]4[/C][C]3080.58[/C][C]3085.71836399457[/C][C]-5.13836399457217[/C][/ROW]
[ROW][C]5[/C][C]3106.22[/C][C]3152.44982234285[/C][C]-46.2298223428475[/C][/ROW]
[ROW][C]6[/C][C]3119.31[/C][C]3265.90736121444[/C][C]-146.597361214440[/C][/ROW]
[ROW][C]7[/C][C]3061.26[/C][C]3203.22651156427[/C][C]-141.966511564271[/C][/ROW]
[ROW][C]8[/C][C]3097.31[/C][C]3007.86951229216[/C][C]89.4404877078393[/C][/ROW]
[ROW][C]9[/C][C]3161.69[/C][C]3153.27157074454[/C][C]8.41842925545732[/C][/ROW]
[ROW][C]10[/C][C]3257.16[/C][C]3241.08683008212[/C][C]16.0731699178766[/C][/ROW]
[ROW][C]11[/C][C]3277.01[/C][C]3346.56555055549[/C][C]-69.5555505554946[/C][/ROW]
[ROW][C]12[/C][C]3295.32[/C][C]3248.58037234679[/C][C]46.7396276532099[/C][/ROW]
[ROW][C]13[/C][C]3363.99[/C][C]3346.7858985894[/C][C]17.2041014106021[/C][/ROW]
[ROW][C]14[/C][C]3494.17[/C][C]3436.72119326856[/C][C]57.4488067314444[/C][/ROW]
[ROW][C]15[/C][C]3667.03[/C][C]3553.93972106815[/C][C]113.090278931848[/C][/ROW]
[ROW][C]16[/C][C]3813.06[/C][C]3735.51249197224[/C][C]77.5475080277635[/C][/ROW]
[ROW][C]17[/C][C]3917.96[/C][C]3829.19687812337[/C][C]88.7631218766249[/C][/ROW]
[ROW][C]18[/C][C]3895.51[/C][C]4103.14352127401[/C][C]-207.633521274014[/C][/ROW]
[ROW][C]19[/C][C]3801.06[/C][C]3938.5486635358[/C][C]-137.488663535800[/C][/ROW]
[ROW][C]20[/C][C]3570.12[/C][C]3732.68652617856[/C][C]-162.566526178561[/C][/ROW]
[ROW][C]21[/C][C]3701.61[/C][C]3532.4409747153[/C][C]169.169025284701[/C][/ROW]
[ROW][C]22[/C][C]3862.27[/C][C]3733.35929508236[/C][C]128.910704917641[/C][/ROW]
[ROW][C]23[/C][C]3970.1[/C][C]3856.36344203787[/C][C]113.736557962129[/C][/ROW]
[ROW][C]24[/C][C]4138.52[/C][C]3921.27749320525[/C][C]217.242506794749[/C][/ROW]
[ROW][C]25[/C][C]4199.75[/C][C]4162.25804757055[/C][C]37.4919524294548[/C][/ROW]
[ROW][C]26[/C][C]4290.89[/C][C]4353.91182206719[/C][C]-63.021822067185[/C][/ROW]
[ROW][C]27[/C][C]4443.91[/C][C]4334.37922231134[/C][C]109.530777688664[/C][/ROW]
[ROW][C]28[/C][C]4502.64[/C][C]4482.3423429824[/C][C]20.2976570176018[/C][/ROW]
[ROW][C]29[/C][C]4356.98[/C][C]4423.91805323185[/C][C]-66.9380532318512[/C][/ROW]
[ROW][C]30[/C][C]4591.27[/C][C]4435.50795617548[/C][C]155.762043824521[/C][/ROW]
[ROW][C]31[/C][C]4696.96[/C][C]4536.49989715262[/C][C]160.460102847375[/C][/ROW]
[ROW][C]32[/C][C]4621.4[/C][C]4655.78653367334[/C][C]-34.3865336733385[/C][/ROW]
[ROW][C]33[/C][C]4562.84[/C][C]4605.86279664817[/C][C]-43.0227966481657[/C][/ROW]
[ROW][C]34[/C][C]4202.52[/C][C]4489.22308052641[/C][C]-286.703080526411[/C][/ROW]
[ROW][C]35[/C][C]4296.49[/C][C]4238.72967804291[/C][C]57.7603219570854[/C][/ROW]
[ROW][C]36[/C][C]4435.23[/C][C]4220.70906782703[/C][C]214.520932172969[/C][/ROW]
[ROW][C]37[/C][C]4105.18[/C][C]4280.62612881557[/C][C]-175.446128815567[/C][/ROW]
[ROW][C]38[/C][C]4116.68[/C][C]4002.66949525508[/C][C]114.010504744920[/C][/ROW]
[ROW][C]39[/C][C]3844.49[/C][C]4054.47376382167[/C][C]-209.983763821667[/C][/ROW]
[ROW][C]40[/C][C]3720.98[/C][C]3710.57670651112[/C][C]10.4032934888799[/C][/ROW]
[ROW][C]41[/C][C]3674.4[/C][C]3697.39253654014[/C][C]-22.9925365401388[/C][/ROW]
[ROW][C]42[/C][C]3857.62[/C][C]3599.11699593431[/C][C]258.503004065688[/C][/ROW]
[ROW][C]43[/C][C]3801.06[/C][C]3774.68478380079[/C][C]26.3752161992075[/C][/ROW]
[ROW][C]44[/C][C]3504.37[/C][C]3569.97868720109[/C][C]-65.6086872010924[/C][/ROW]
[ROW][C]45[/C][C]3032.6[/C][C]3182.59820690516[/C][C]-149.998206905158[/C][/ROW]
[ROW][C]46[/C][C]3047.03[/C][C]2903.21761383401[/C][C]143.812386165994[/C][/ROW]
[ROW][C]47[/C][C]2962.34[/C][C]3170.51292384835[/C][C]-208.172923848345[/C][/ROW]
[ROW][C]48[/C][C]2197.82[/C][C]2540.18267213309[/C][C]-342.362672133095[/C][/ROW]
[ROW][C]49[/C][C]2014.45[/C][C]1926.69484074242[/C][C]87.7551592575769[/C][/ROW]
[ROW][C]50[/C][C]1862.83[/C][C]1898.01785330278[/C][C]-35.1878533027819[/C][/ROW]
[ROW][C]51[/C][C]1905.41[/C][C]1875.03936036744[/C][C]30.3706396325610[/C][/ROW]
[ROW][C]52[/C][C]1810.99[/C][C]1914.10009453967[/C][C]-103.110094539673[/C][/ROW]
[ROW][C]53[/C][C]1670.07[/C][C]1622.67270976179[/C][C]47.3972902382125[/C][/ROW]
[ROW][C]54[/C][C]1864.44[/C][C]1924.47416540175[/C][C]-60.0341654017546[/C][/ROW]
[ROW][C]55[/C][C]2052.02[/C][C]1959.40014394651[/C][C]92.6198560534883[/C][/ROW]
[ROW][C]56[/C][C]2029.6[/C][C]1856.47874065485[/C][C]173.121259345153[/C][/ROW]
[ROW][C]57[/C][C]2070.83[/C][C]2055.39645098683[/C][C]15.4335490131661[/C][/ROW]
[ROW][C]58[/C][C]2293.41[/C][C]2295.5031804751[/C][C]-2.09318047510133[/C][/ROW]
[ROW][C]59[/C][C]2443.27[/C][C]2337.03840551537[/C][C]106.231594484625[/C][/ROW]
[ROW][C]60[/C][C]2513.17[/C][C]2649.31039448783[/C][C]-136.140394487834[/C][/ROW]
[/TABLE]
Source: https://freestatistics.org/blog/index.php?pk=69917&T=4

Globally Unique Identifier (entire table): ba.freestatistics.org/blog/index.php?pk=69917&T=4

As an alternative you can also use a QR Code:  

The GUIDs for individual cells are displayed in the table below:

Multiple Linear Regression - Actuals, Interpolation, and Residuals
Time or IndexActualsInterpolationForecastResidualsPrediction Error
12849.272816.2750842820732.9949157179337
22921.442994.6896361064-73.2496361063972
32981.853024.85793243141-43.0079324314072
43080.583085.71836399457-5.13836399457217
53106.223152.44982234285-46.2298223428475
63119.313265.90736121444-146.597361214440
73061.263203.22651156427-141.966511564271
83097.313007.8695122921689.4404877078393
93161.693153.271570744548.41842925545732
103257.163241.0868300821216.0731699178766
113277.013346.56555055549-69.5555505554946
123295.323248.5803723467946.7396276532099
133363.993346.785898589417.2041014106021
143494.173436.7211932685657.4488067314444
153667.033553.93972106815113.090278931848
163813.063735.5124919722477.5475080277635
173917.963829.1968781233788.7631218766249
183895.514103.14352127401-207.633521274014
193801.063938.5486635358-137.488663535800
203570.123732.68652617856-162.566526178561
213701.613532.4409747153169.169025284701
223862.273733.35929508236128.910704917641
233970.13856.36344203787113.736557962129
244138.523921.27749320525217.242506794749
254199.754162.2580475705537.4919524294548
264290.894353.91182206719-63.021822067185
274443.914334.37922231134109.530777688664
284502.644482.342342982420.2976570176018
294356.984423.91805323185-66.9380532318512
304591.274435.50795617548155.762043824521
314696.964536.49989715262160.460102847375
324621.44655.78653367334-34.3865336733385
334562.844605.86279664817-43.0227966481657
344202.524489.22308052641-286.703080526411
354296.494238.7296780429157.7603219570854
364435.234220.70906782703214.520932172969
374105.184280.62612881557-175.446128815567
384116.684002.66949525508114.010504744920
393844.494054.47376382167-209.983763821667
403720.983710.5767065111210.4032934888799
413674.43697.39253654014-22.9925365401388
423857.623599.11699593431258.503004065688
433801.063774.6847838007926.3752161992075
443504.373569.97868720109-65.6086872010924
453032.63182.59820690516-149.998206905158
463047.032903.21761383401143.812386165994
472962.343170.51292384835-208.172923848345
482197.822540.18267213309-342.362672133095
492014.451926.6948407424287.7551592575769
501862.831898.01785330278-35.1878533027819
511905.411875.0393603674430.3706396325610
521810.991914.10009453967-103.110094539673
531670.071622.6727097617947.3972902382125
541864.441924.47416540175-60.0341654017546
552052.021959.4001439465192.6198560534883
562029.61856.47874065485173.121259345153
572070.832055.3964509868315.4335490131661
582293.412295.5031804751-2.09318047510133
592443.272337.03840551537106.231594484625
602513.172649.31039448783-136.140394487834


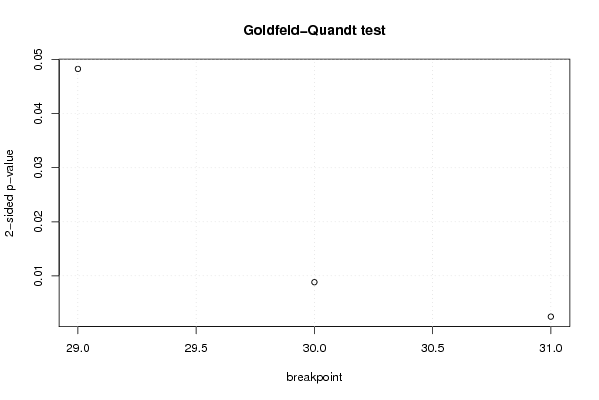
Goldfeld-Quandt test for Heteroskedasticity
p-valuesAlternative Hypothesis
breakpoint indexgreater2-sidedless
290.02413745384472780.04827490768945570.975862546155272
300.004407805056394650.00881561011278930.995592194943605
310.001220770326878330.002441540653756670.998779229673122

\begin{tabular}{lllllllll}
\hline
Goldfeld-Quandt test for Heteroskedasticity \tabularnewline
p-values & Alternative Hypothesis \tabularnewline
breakpoint index & greater & 2-sided & less \tabularnewline
29 & 0.0241374538447278 & 0.0482749076894557 & 0.975862546155272 \tabularnewline
30 & 0.00440780505639465 & 0.0088156101127893 & 0.995592194943605 \tabularnewline
31 & 0.00122077032687833 & 0.00244154065375667 & 0.998779229673122 \tabularnewline
\hline
\end{tabular}
%Source: https://freestatistics.org/blog/index.php?pk=69917&T=5

[TABLE]
[ROW][C]Goldfeld-Quandt test for Heteroskedasticity[/C][/ROW]
[ROW][C]p-values[/C][C]Alternative Hypothesis[/C][/ROW]
[ROW][C]breakpoint index[/C][C]greater[/C][C]2-sided[/C][C]less[/C][/ROW]
[ROW][C]29[/C][C]0.0241374538447278[/C][C]0.0482749076894557[/C][C]0.975862546155272[/C][/ROW]
[ROW][C]30[/C][C]0.00440780505639465[/C][C]0.0088156101127893[/C][C]0.995592194943605[/C][/ROW]
[ROW][C]31[/C][C]0.00122077032687833[/C][C]0.00244154065375667[/C][C]0.998779229673122[/C][/ROW]
[/TABLE]
Source: https://freestatistics.org/blog/index.php?pk=69917&T=5

Globally Unique Identifier (entire table): ba.freestatistics.org/blog/index.php?pk=69917&T=5

As an alternative you can also use a QR Code:  

The GUIDs for individual cells are displayed in the table below:

Goldfeld-Quandt test for Heteroskedasticity
p-valuesAlternative Hypothesis
breakpoint indexgreater2-sidedless
290.02413745384472780.04827490768945570.975862546155272
300.004407805056394650.00881561011278930.995592194943605
310.001220770326878330.002441540653756670.998779229673122


Meta Analysis of Goldfeld-Quandt test for Heteroskedasticity
Description# significant tests% significant testsOK/NOK
1% type I error level20.666666666666667NOK
5% type I error level31NOK
10% type I error level31NOK

\begin{tabular}{lllllllll}
\hline
Meta Analysis of Goldfeld-Quandt test for Heteroskedasticity \tabularnewline
Description & # significant tests & % significant tests & OK/NOK \tabularnewline
1% type I error level & 2 & 0.666666666666667 & NOK \tabularnewline
5% type I error level & 3 & 1 & NOK \tabularnewline
10% type I error level & 3 & 1 & NOK \tabularnewline
\hline
\end{tabular}
%Source: https://freestatistics.org/blog/index.php?pk=69917&T=6

[TABLE]
[ROW][C]Meta Analysis of Goldfeld-Quandt test for Heteroskedasticity[/C][/ROW]
[ROW][C]Description[/C][C]# significant tests[/C][C]% significant tests[/C][C]OK/NOK[/C][/ROW]
[ROW][C]1% type I error level[/C][C]2[/C][C]0.666666666666667[/C][C]NOK[/C][/ROW]
[ROW][C]5% type I error level[/C][C]3[/C][C]1[/C][C]NOK[/C][/ROW]
[ROW][C]10% type I error level[/C][C]3[/C][C]1[/C][C]NOK[/C][/ROW]
[/TABLE]
Source: https://freestatistics.org/blog/index.php?pk=69917&T=6

Globally Unique Identifier (entire table): ba.freestatistics.org/blog/index.php?pk=69917&T=6

As an alternative you can also use a QR Code:  

The GUIDs for individual cells are displayed in the table below:

Meta Analysis of Goldfeld-Quandt test for Heteroskedasticity
Description# significant tests% significant testsOK/NOK
1% type I error level20.666666666666667NOK
5% type I error level31NOK
10% type I error level31NOK


Parameters (Session):
par1 = 1 ; par2 = Include Monthly Dummies ; par3 = Linear Trend ;
Parameters (R input):
par1 = 1 ; par2 = Include Monthly Dummies ; par3 = Linear Trend ;
R code (references can be found in the software module):
library(lattice)
library(lmtest)
n25 <- 25 #minimum number of obs. for Goldfeld-Quandt test
par1 <- as.numeric(par1)
x <- t(y)
k <- length(x[1,])
n <- length(x[,1])
x1 <- cbind(x[,par1], x[,1:k!=par1])
mycolnames <- c(colnames(x)[par1], colnames(x)[1:k!=par1])
colnames(x1) <- mycolnames #colnames(x)[par1]
x <- x1
if (par3 == 'First Differences'){
x2 <- array(0, dim=c(n-1,k), dimnames=list(1:(n-1), paste('(1-B)',colnames(x),sep='')))
for (i in 1:n-1) {
for (j in 1:k) {
x2[i,j] <- x[i+1,j] - x[i,j]
}
}
x <- x2
}
if (par2 == 'Include Monthly Dummies'){
x2 <- array(0, dim=c(n,11), dimnames=list(1:n, paste('M', seq(1:11), sep ='')))
for (i in 1:11){
x2[seq(i,n,12),i] <- 1
}
x <- cbind(x, x2)
}
if (par2 == 'Include Quarterly Dummies'){
x2 <- array(0, dim=c(n,3), dimnames=list(1:n, paste('Q', seq(1:3), sep ='')))
for (i in 1:3){
x2[seq(i,n,4),i] <- 1
}
x <- cbind(x, x2)
}
k <- length(x[1,])
if (par3 == 'Linear Trend'){
x <- cbind(x, c(1:n))
colnames(x)[k+1] <- 't'
}
x
k <- length(x[1,])
df <- as.data.frame(x)
(mylm <- lm(df))
(mysum <- summary(mylm))
if (n > n25) {
kp3 <- k + 3
nmkm3 <- n - k - 3
gqarr <- array(NA, dim=c(nmkm3-kp3+1,3))
numgqtests <- 0
numsignificant1 <- 0
numsignificant5 <- 0
numsignificant10 <- 0
for (mypoint in kp3:nmkm3) {
j <- 0
numgqtests <- numgqtests + 1
for (myalt in c('greater', 'two.sided', 'less')) {
j <- j + 1
gqarr[mypoint-kp3+1,j] <- gqtest(mylm, point=mypoint, alternative=myalt)$p.value
}
if (gqarr[mypoint-kp3+1,2] < 0.01) numsignificant1 <- numsignificant1 + 1
if (gqarr[mypoint-kp3+1,2] < 0.05) numsignificant5 <- numsignificant5 + 1
if (gqarr[mypoint-kp3+1,2] < 0.10) numsignificant10 <- numsignificant10 + 1
}
gqarr
}
bitmap(file='test0.png')
plot(x[,1], type='l', main='Actuals and Interpolation', ylab='value of Actuals and Interpolation (dots)', xlab='time or index')
points(x[,1]-mysum$resid)
grid()
dev.off()
bitmap(file='test1.png')
plot(mysum$resid, type='b', pch=19, main='Residuals', ylab='value of Residuals', xlab='time or index')
grid()
dev.off()
bitmap(file='test2.png')
hist(mysum$resid, main='Residual Histogram', xlab='values of Residuals')
grid()
dev.off()
bitmap(file='test3.png')
densityplot(~mysum$resid,col='black',main='Residual Density Plot', xlab='values of Residuals')
dev.off()
bitmap(file='test4.png')
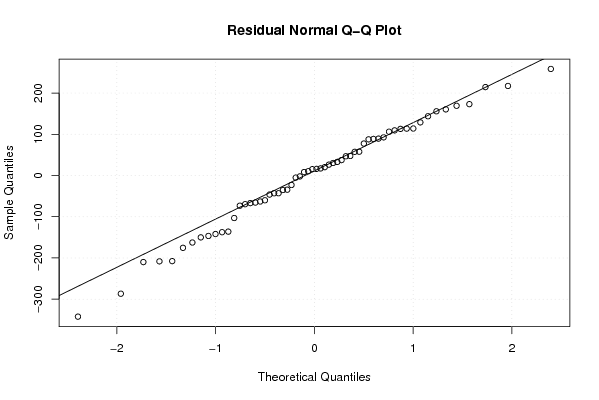
qqnorm(mysum$resid, main='Residual Normal Q-Q Plot')
qqline(mysum$resid)
grid()
dev.off()
(myerror <- as.ts(mysum$resid))
bitmap(file='test5.png')
dum <- cbind(lag(myerror,k=1),myerror)
dum
dum1 <- dum[2:length(myerror),]
dum1
z <- as.data.frame(dum1)
z
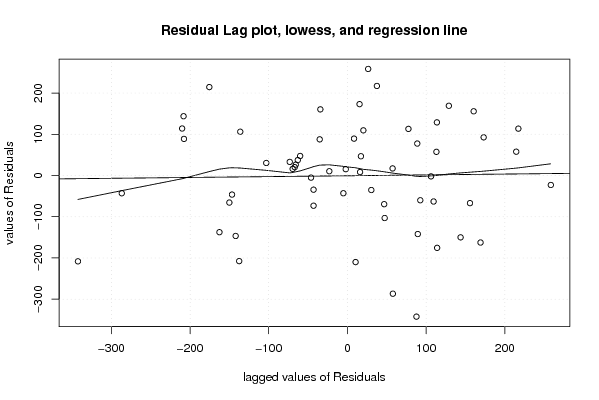
plot(z,main=paste('Residual Lag plot, lowess, and regression line'), ylab='values of Residuals', xlab='lagged values of Residuals')
lines(lowess(z))
abline(lm(z))
grid()
dev.off()
bitmap(file='test6.png')
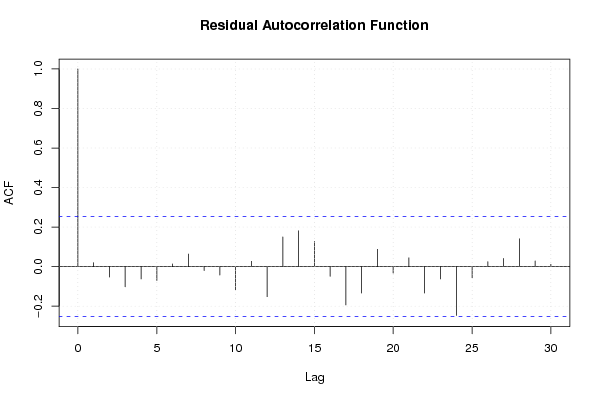
acf(mysum$resid, lag.max=length(mysum$resid)/2, main='Residual Autocorrelation Function')
grid()
dev.off()
bitmap(file='test7.png')
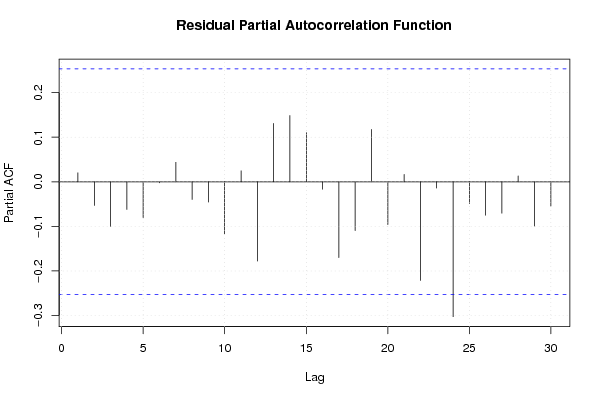
pacf(mysum$resid, lag.max=length(mysum$resid)/2, main='Residual Partial Autocorrelation Function')
grid()
dev.off()
bitmap(file='test8.png')
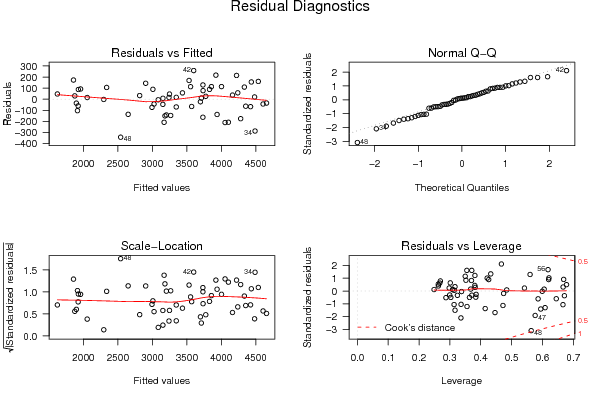
opar <- par(mfrow = c(2,2), oma = c(0, 0, 1.1, 0))
plot(mylm, las = 1, sub='Residual Diagnostics')
par(opar)
dev.off()
if (n > n25) {
bitmap(file='test9.png')
plot(kp3:nmkm3,gqarr[,2], main='Goldfeld-Quandt test',ylab='2-sided p-value',xlab='breakpoint')
grid()
dev.off()
}
load(file='createtable')
a<-table.start()
a<-table.row.start(a)
a<-table.element(a, 'Multiple Linear Regression - Estimated Regression Equation', 1, TRUE)
a<-table.row.end(a)
myeq <- colnames(x)[1]
myeq <- paste(myeq, '[t] = ', sep='')
for (i in 1:k){
if (mysum$coefficients[i,1] > 0) myeq <- paste(myeq, '+', '')
myeq <- paste(myeq, mysum$coefficients[i,1], sep=' ')
if (rownames(mysum$coefficients)[i] != '(Intercept)') {
myeq <- paste(myeq, rownames(mysum$coefficients)[i], sep='')
if (rownames(mysum$coefficients)[i] != 't') myeq <- paste(myeq, '[t]', sep='')
}
}
myeq <- paste(myeq, ' + e[t]')
a<-table.row.start(a)
a<-table.element(a, myeq)
a<-table.row.end(a)
a<-table.end(a)
table.save(a,file='mytable1.tab')
a<-table.start()
a<-table.row.start(a)
a<-table.element(a,hyperlink('ols1.htm','Multiple Linear Regression - Ordinary Least Squares',''), 6, TRUE)
a<-table.row.end(a)
a<-table.row.start(a)
a<-table.element(a,'Variable',header=TRUE)
a<-table.element(a,'Parameter',header=TRUE)
a<-table.element(a,'S.D.',header=TRUE)
a<-table.element(a,'T-STAT
H0: parameter = 0',header=TRUE)
a<-table.element(a,'2-tail p-value',header=TRUE)
a<-table.element(a,'1-tail p-value',header=TRUE)
a<-table.row.end(a)
for (i in 1:k){
a<-table.row.start(a)
a<-table.element(a,rownames(mysum$coefficients)[i],header=TRUE)
a<-table.element(a,mysum$coefficients[i,1])
a<-table.element(a, round(mysum$coefficients[i,2],6))
a<-table.element(a, round(mysum$coefficients[i,3],4))
a<-table.element(a, round(mysum$coefficients[i,4],6))
a<-table.element(a, round(mysum$coefficients[i,4]/2,6))
a<-table.row.end(a)
}
a<-table.end(a)
table.save(a,file='mytable2.tab')
a<-table.start()
a<-table.row.start(a)
a<-table.element(a, 'Multiple Linear Regression - Regression Statistics', 2, TRUE)
a<-table.row.end(a)
a<-table.row.start(a)
a<-table.element(a, 'Multiple R',1,TRUE)
a<-table.element(a, sqrt(mysum$r.squared))
a<-table.row.end(a)
a<-table.row.start(a)
a<-table.element(a, 'R-squared',1,TRUE)
a<-table.element(a, mysum$r.squared)
a<-table.row.end(a)
a<-table.row.start(a)
a<-table.element(a, 'Adjusted R-squared',1,TRUE)
a<-table.element(a, mysum$adj.r.squared)
a<-table.row.end(a)
a<-table.row.start(a)
a<-table.element(a, 'F-TEST (value)',1,TRUE)
a<-table.element(a, mysum$fstatistic[1])
a<-table.row.end(a)
a<-table.row.start(a)
a<-table.element(a, 'F-TEST (DF numerator)',1,TRUE)
a<-table.element(a, mysum$fstatistic[2])
a<-table.row.end(a)
a<-table.row.start(a)
a<-table.element(a, 'F-TEST (DF denominator)',1,TRUE)
a<-table.element(a, mysum$fstatistic[3])
a<-table.row.end(a)
a<-table.row.start(a)
a<-table.element(a, 'p-value',1,TRUE)
a<-table.element(a, 1-pf(mysum$fstatistic[1],mysum$fstatistic[2],mysum$fstatistic[3]))
a<-table.row.end(a)
a<-table.row.start(a)
a<-table.element(a, 'Multiple Linear Regression - Residual Statistics', 2, TRUE)
a<-table.row.end(a)
a<-table.row.start(a)
a<-table.element(a, 'Residual Standard Deviation',1,TRUE)
a<-table.element(a, mysum$sigma)
a<-table.row.end(a)
a<-table.row.start(a)
a<-table.element(a, 'Sum Squared Residuals',1,TRUE)
a<-table.element(a, sum(myerror*myerror))
a<-table.row.end(a)
a<-table.end(a)
table.save(a,file='mytable3.tab')
a<-table.start()
a<-table.row.start(a)
a<-table.element(a, 'Multiple Linear Regression - Actuals, Interpolation, and Residuals', 4, TRUE)
a<-table.row.end(a)
a<-table.row.start(a)
a<-table.element(a, 'Time or Index', 1, TRUE)
a<-table.element(a, 'Actuals', 1, TRUE)
a<-table.element(a, 'Interpolation
Forecast', 1, TRUE)
a<-table.element(a, 'Residuals
Prediction Error', 1, TRUE)
a<-table.row.end(a)
for (i in 1:n) {
a<-table.row.start(a)
a<-table.element(a,i, 1, TRUE)
a<-table.element(a,x[i])
a<-table.element(a,x[i]-mysum$resid[i])
a<-table.element(a,mysum$resid[i])
a<-table.row.end(a)
}
a<-table.end(a)
table.save(a,file='mytable4.tab')
if (n > n25) {
a<-table.start()
a<-table.row.start(a)
a<-table.element(a,'Goldfeld-Quandt test for Heteroskedasticity',4,TRUE)
a<-table.row.end(a)
a<-table.row.start(a)
a<-table.element(a,'p-values',header=TRUE)
a<-table.element(a,'Alternative Hypothesis',3,header=TRUE)
a<-table.row.end(a)
a<-table.row.start(a)
a<-table.element(a,'breakpoint index',header=TRUE)
a<-table.element(a,'greater',header=TRUE)
a<-table.element(a,'2-sided',header=TRUE)
a<-table.element(a,'less',header=TRUE)
a<-table.row.end(a)
for (mypoint in kp3:nmkm3) {
a<-table.row.start(a)
a<-table.element(a,mypoint,header=TRUE)
a<-table.element(a,gqarr[mypoint-kp3+1,1])
a<-table.element(a,gqarr[mypoint-kp3+1,2])
a<-table.element(a,gqarr[mypoint-kp3+1,3])
a<-table.row.end(a)
}
a<-table.end(a)
table.save(a,file='mytable5.tab')
a<-table.start()
a<-table.row.start(a)
a<-table.element(a,'Meta Analysis of Goldfeld-Quandt test for Heteroskedasticity',4,TRUE)
a<-table.row.end(a)
a<-table.row.start(a)
a<-table.element(a,'Description',header=TRUE)
a<-table.element(a,'# significant tests',header=TRUE)
a<-table.element(a,'% significant tests',header=TRUE)
a<-table.element(a,'OK/NOK',header=TRUE)
a<-table.row.end(a)
a<-table.row.start(a)
a<-table.element(a,'1% type I error level',header=TRUE)
a<-table.element(a,numsignificant1)
a<-table.element(a,numsignificant1/numgqtests)
if (numsignificant1/numgqtests < 0.01) dum <- 'OK' else dum <- 'NOK'
a<-table.element(a,dum)
a<-table.row.end(a)
a<-table.row.start(a)
a<-table.element(a,'5% type I error level',header=TRUE)
a<-table.element(a,numsignificant5)
a<-table.element(a,numsignificant5/numgqtests)
if (numsignificant5/numgqtests < 0.05) dum <- 'OK' else dum <- 'NOK'
a<-table.element(a,dum)
a<-table.row.end(a)
a<-table.row.start(a)
a<-table.element(a,'10% type I error level',header=TRUE)
a<-table.element(a,numsignificant10)
a<-table.element(a,numsignificant10/numgqtests)
if (numsignificant10/numgqtests < 0.1) dum <- 'OK' else dum <- 'NOK'
a<-table.element(a,dum)
a<-table.row.end(a)
a<-table.end(a)
table.save(a,file='mytable6.tab')
}