Free Statistics

of Irreproducible Research!

Author's title

Author*The author of this computation has been verified*
R Software Modulerwasp_multipleregression.wasp
Title produced by softwareMultiple Regression
Date of computationSun, 20 Dec 2009 11:17:03 -0700
Cite this page as followsStatistical Computations at FreeStatistics.org, Office for Research Development and Education, URL https://freestatistics.org/blog/index.php?v=date/2009/Dec/20/t1261333432iyg4ggrcvwbddve.htm/, Retrieved Sat, 27 Apr 2024 08:35:26 +0000
Statistical Computations at FreeStatistics.org, Office for Research Development and Education, URL https://freestatistics.org/blog/index.php?pk=69971, Retrieved Sat, 27 Apr 2024 08:35:26 +0000
QR Codes:

Original text written by user:
IsPrivate?No (this computation is public)
User-defined keywords
Estimated Impact130
Family? (F = Feedback message, R = changed R code, M = changed R Module, P = changed Parameters, D = changed Data)
F     [Multiple Regression] [W6Q3 (2)] [2008-11-27 13:15:57] [fefc9cefce013a6daab207c2a2eec05e]
-       [Multiple Regression] [AH paper 3] [2008-12-15 18:18:03] [74be16979710d4c4e7c6647856088456]
- RM D      [Multiple Regression] [Multiple Regression] [2009-12-20 18:17:03] [95bc1f3b1182fbde76c5a24f1f253203] [Current]
Feedback Forum

Post a new message
Dataseries X:
149,8
137,7
151,7
156,8
180
180,4
170,4
191,6
199,5
218,2
217,5
205
194
199,3
219,3
211,1
215,2
240,2
242,2
240,7
255,4
253
218,2
203,7
205,6
215,6
188,5
202,9
214
230,3
230
241
259,6
247,8
270,3
289,7
322,7
315
320,2
329,5
360,6
382,2
435,4
464
468,8
403
351,6
252
188
146,5
152,9
148,1
165,1
177
206,1
244,9
228,6
253,4
241,1
261,4
273,7


Summary of computational transaction
Raw Inputview raw input (R code)
Raw Outputview raw output of R engine
Computing time4 seconds
R Server'Gwilym Jenkins' @ 72.249.127.135

\begin{tabular}{lllllllll}
\hline
Summary of computational transaction \tabularnewline
Raw Input & view raw input (R code)  \tabularnewline
Raw Output & view raw output of R engine  \tabularnewline
Computing time & 4 seconds \tabularnewline
R Server & 'Gwilym Jenkins' @ 72.249.127.135 \tabularnewline
\hline
\end{tabular}
%Source: https://freestatistics.org/blog/index.php?pk=69971&T=0

[TABLE]
[ROW][C]Summary of computational transaction[/C][/ROW]
[ROW][C]Raw Input[/C][C]view raw input (R code) [/C][/ROW]
[ROW][C]Raw Output[/C][C]view raw output of R engine [/C][/ROW]
[ROW][C]Computing time[/C][C]4 seconds[/C][/ROW]
[ROW][C]R Server[/C][C]'Gwilym Jenkins' @ 72.249.127.135[/C][/ROW]
[/TABLE]
Source: https://freestatistics.org/blog/index.php?pk=69971&T=0

Globally Unique Identifier (entire table): ba.freestatistics.org/blog/index.php?pk=69971&T=0

As an alternative you can also use a QR Code:  

The GUIDs for individual cells are displayed in the table below:

Summary of computational transaction
Raw Inputview raw input (R code)
Raw Outputview raw output of R engine
Computing time4 seconds
R Server'Gwilym Jenkins' @ 72.249.127.135


Multiple Linear Regression - Estimated Regression Equation
Indexprijs[t] = + 186.456470588235 -12.2956209150327M1[t] -24.0112418300654M2[t] -21.8641176470589M3[t] -20.2569934640523M4[t] -4.50986928104575M5[t] + 8.97725490196074M6[t] + 22.2243790849673M7[t] + 40.2915032679738M8[t] + 44.6786274509804M9[t] + 35.8257516339870M10[t] + 18.9328758169935M11[t] + 1.55287581699346t + e[t]

\begin{tabular}{lllllllll}
\hline
Multiple Linear Regression - Estimated Regression Equation \tabularnewline
Indexprijs[t] =  +  186.456470588235 -12.2956209150327M1[t] -24.0112418300654M2[t] -21.8641176470589M3[t] -20.2569934640523M4[t] -4.50986928104575M5[t] +  8.97725490196074M6[t] +  22.2243790849673M7[t] +  40.2915032679738M8[t] +  44.6786274509804M9[t] +  35.8257516339870M10[t] +  18.9328758169935M11[t] +  1.55287581699346t  + e[t] \tabularnewline
\hline
\end{tabular}
%Source: https://freestatistics.org/blog/index.php?pk=69971&T=1

[TABLE]
[ROW][C]Multiple Linear Regression - Estimated Regression Equation[/C][/ROW]
[ROW][C]Indexprijs[t] =  +  186.456470588235 -12.2956209150327M1[t] -24.0112418300654M2[t] -21.8641176470589M3[t] -20.2569934640523M4[t] -4.50986928104575M5[t] +  8.97725490196074M6[t] +  22.2243790849673M7[t] +  40.2915032679738M8[t] +  44.6786274509804M9[t] +  35.8257516339870M10[t] +  18.9328758169935M11[t] +  1.55287581699346t  + e[t][/C][/ROW]
[/TABLE]
Source: https://freestatistics.org/blog/index.php?pk=69971&T=1

Globally Unique Identifier (entire table): ba.freestatistics.org/blog/index.php?pk=69971&T=1

As an alternative you can also use a QR Code:  

The GUIDs for individual cells are displayed in the table below:

Multiple Linear Regression - Estimated Regression Equation
Indexprijs[t] = + 186.456470588235 -12.2956209150327M1[t] -24.0112418300654M2[t] -21.8641176470589M3[t] -20.2569934640523M4[t] -4.50986928104575M5[t] + 8.97725490196074M6[t] + 22.2243790849673M7[t] + 40.2915032679738M8[t] + 44.6786274509804M9[t] + 35.8257516339870M10[t] + 18.9328758169935M11[t] + 1.55287581699346t + e[t]


Multiple Linear Regression - Ordinary Least Squares
VariableParameterS.D.T-STATH0: parameter = 02-tail p-value1-tail p-value
(Intercept)186.45647058823538.4500534.84931.3e-057e-06
M1-12.295620915032744.841807-0.27420.7851080.392554
M2-24.011241830065447.066221-0.51020.6122780.306139
M3-21.864117647058947.006117-0.46510.6439390.32197
M4-20.256993464052346.952274-0.43140.6680820.334041
M5-4.5098692810457546.904715-0.09610.9238020.461901
M68.9772549019607446.8634580.19160.8488930.424447
M722.224379084967346.8285190.47460.6372310.318615
M840.291503267973846.7999140.86090.3935560.196778
M944.678627450980446.7776530.95510.3442990.172149
M1035.825751633987046.7617460.76610.4473480.223674
M1118.932875816993546.7521990.4050.6873040.343652
t1.552875816993460.5455142.84660.0064820.003241

\begin{tabular}{lllllllll}
\hline
Multiple Linear Regression - Ordinary Least Squares \tabularnewline
Variable & Parameter & S.D. & T-STATH0: parameter = 0 & 2-tail p-value & 1-tail p-value \tabularnewline
(Intercept) & 186.456470588235 & 38.450053 & 4.8493 & 1.3e-05 & 7e-06 \tabularnewline
M1 & -12.2956209150327 & 44.841807 & -0.2742 & 0.785108 & 0.392554 \tabularnewline
M2 & -24.0112418300654 & 47.066221 & -0.5102 & 0.612278 & 0.306139 \tabularnewline
M3 & -21.8641176470589 & 47.006117 & -0.4651 & 0.643939 & 0.32197 \tabularnewline
M4 & -20.2569934640523 & 46.952274 & -0.4314 & 0.668082 & 0.334041 \tabularnewline
M5 & -4.50986928104575 & 46.904715 & -0.0961 & 0.923802 & 0.461901 \tabularnewline
M6 & 8.97725490196074 & 46.863458 & 0.1916 & 0.848893 & 0.424447 \tabularnewline
M7 & 22.2243790849673 & 46.828519 & 0.4746 & 0.637231 & 0.318615 \tabularnewline
M8 & 40.2915032679738 & 46.799914 & 0.8609 & 0.393556 & 0.196778 \tabularnewline
M9 & 44.6786274509804 & 46.777653 & 0.9551 & 0.344299 & 0.172149 \tabularnewline
M10 & 35.8257516339870 & 46.761746 & 0.7661 & 0.447348 & 0.223674 \tabularnewline
M11 & 18.9328758169935 & 46.752199 & 0.405 & 0.687304 & 0.343652 \tabularnewline
t & 1.55287581699346 & 0.545514 & 2.8466 & 0.006482 & 0.003241 \tabularnewline
\hline
\end{tabular}
%Source: https://freestatistics.org/blog/index.php?pk=69971&T=2

[TABLE]
[ROW][C]Multiple Linear Regression - Ordinary Least Squares[/C][/ROW]
[ROW][C]Variable[/C][C]Parameter[/C][C]S.D.[/C][C]T-STATH0: parameter = 0[/C][C]2-tail p-value[/C][C]1-tail p-value[/C][/ROW]
[ROW][C](Intercept)[/C][C]186.456470588235[/C][C]38.450053[/C][C]4.8493[/C][C]1.3e-05[/C][C]7e-06[/C][/ROW]
[ROW][C]M1[/C][C]-12.2956209150327[/C][C]44.841807[/C][C]-0.2742[/C][C]0.785108[/C][C]0.392554[/C][/ROW]
[ROW][C]M2[/C][C]-24.0112418300654[/C][C]47.066221[/C][C]-0.5102[/C][C]0.612278[/C][C]0.306139[/C][/ROW]
[ROW][C]M3[/C][C]-21.8641176470589[/C][C]47.006117[/C][C]-0.4651[/C][C]0.643939[/C][C]0.32197[/C][/ROW]
[ROW][C]M4[/C][C]-20.2569934640523[/C][C]46.952274[/C][C]-0.4314[/C][C]0.668082[/C][C]0.334041[/C][/ROW]
[ROW][C]M5[/C][C]-4.50986928104575[/C][C]46.904715[/C][C]-0.0961[/C][C]0.923802[/C][C]0.461901[/C][/ROW]
[ROW][C]M6[/C][C]8.97725490196074[/C][C]46.863458[/C][C]0.1916[/C][C]0.848893[/C][C]0.424447[/C][/ROW]
[ROW][C]M7[/C][C]22.2243790849673[/C][C]46.828519[/C][C]0.4746[/C][C]0.637231[/C][C]0.318615[/C][/ROW]
[ROW][C]M8[/C][C]40.2915032679738[/C][C]46.799914[/C][C]0.8609[/C][C]0.393556[/C][C]0.196778[/C][/ROW]
[ROW][C]M9[/C][C]44.6786274509804[/C][C]46.777653[/C][C]0.9551[/C][C]0.344299[/C][C]0.172149[/C][/ROW]
[ROW][C]M10[/C][C]35.8257516339870[/C][C]46.761746[/C][C]0.7661[/C][C]0.447348[/C][C]0.223674[/C][/ROW]
[ROW][C]M11[/C][C]18.9328758169935[/C][C]46.752199[/C][C]0.405[/C][C]0.687304[/C][C]0.343652[/C][/ROW]
[ROW][C]t[/C][C]1.55287581699346[/C][C]0.545514[/C][C]2.8466[/C][C]0.006482[/C][C]0.003241[/C][/ROW]
[/TABLE]
Source: https://freestatistics.org/blog/index.php?pk=69971&T=2

Globally Unique Identifier (entire table): ba.freestatistics.org/blog/index.php?pk=69971&T=2

As an alternative you can also use a QR Code:  

The GUIDs for individual cells are displayed in the table below:

Multiple Linear Regression - Ordinary Least Squares
VariableParameterS.D.T-STATH0: parameter = 02-tail p-value1-tail p-value
(Intercept)186.45647058823538.4500534.84931.3e-057e-06
M1-12.295620915032744.841807-0.27420.7851080.392554
M2-24.011241830065447.066221-0.51020.6122780.306139
M3-21.864117647058947.006117-0.46510.6439390.32197
M4-20.256993464052346.952274-0.43140.6680820.334041
M5-4.5098692810457546.904715-0.09610.9238020.461901
M68.9772549019607446.8634580.19160.8488930.424447
M722.224379084967346.8285190.47460.6372310.318615
M840.291503267973846.7999140.86090.3935560.196778
M944.678627450980446.7776530.95510.3442990.172149
M1035.825751633987046.7617460.76610.4473480.223674
M1118.932875816993546.7521990.4050.6873040.343652
t1.552875816993460.5455142.84660.0064820.003241


Multiple Linear Regression - Regression Statistics
Multiple R0.503660876987238
R-squared0.253674279007554
Adjusted R-squared0.0670928487594425
F-TEST (value)1.35959017288175
F-TEST (DF numerator)12
F-TEST (DF denominator)48
p-value0.218275722619624
Multiple Linear Regression - Residual Statistics
Residual Standard Deviation73.9166856665979
Sum Squared Residuals262256.468156863

\begin{tabular}{lllllllll}
\hline
Multiple Linear Regression - Regression Statistics \tabularnewline
Multiple R & 0.503660876987238 \tabularnewline
R-squared & 0.253674279007554 \tabularnewline
Adjusted R-squared & 0.0670928487594425 \tabularnewline
F-TEST (value) & 1.35959017288175 \tabularnewline
F-TEST (DF numerator) & 12 \tabularnewline
F-TEST (DF denominator) & 48 \tabularnewline
p-value & 0.218275722619624 \tabularnewline
Multiple Linear Regression - Residual Statistics \tabularnewline
Residual Standard Deviation & 73.9166856665979 \tabularnewline
Sum Squared Residuals & 262256.468156863 \tabularnewline
\hline
\end{tabular}
%Source: https://freestatistics.org/blog/index.php?pk=69971&T=3

[TABLE]
[ROW][C]Multiple Linear Regression - Regression Statistics[/C][/ROW]
[ROW][C]Multiple R[/C][C]0.503660876987238[/C][/ROW]
[ROW][C]R-squared[/C][C]0.253674279007554[/C][/ROW]
[ROW][C]Adjusted R-squared[/C][C]0.0670928487594425[/C][/ROW]
[ROW][C]F-TEST (value)[/C][C]1.35959017288175[/C][/ROW]
[ROW][C]F-TEST (DF numerator)[/C][C]12[/C][/ROW]
[ROW][C]F-TEST (DF denominator)[/C][C]48[/C][/ROW]
[ROW][C]p-value[/C][C]0.218275722619624[/C][/ROW]
[ROW][C]Multiple Linear Regression - Residual Statistics[/C][/ROW]
[ROW][C]Residual Standard Deviation[/C][C]73.9166856665979[/C][/ROW]
[ROW][C]Sum Squared Residuals[/C][C]262256.468156863[/C][/ROW]
[/TABLE]
Source: https://freestatistics.org/blog/index.php?pk=69971&T=3

Globally Unique Identifier (entire table): ba.freestatistics.org/blog/index.php?pk=69971&T=3

As an alternative you can also use a QR Code:  

The GUIDs for individual cells are displayed in the table below:

Multiple Linear Regression - Regression Statistics
Multiple R0.503660876987238
R-squared0.253674279007554
Adjusted R-squared0.0670928487594425
F-TEST (value)1.35959017288175
F-TEST (DF numerator)12
F-TEST (DF denominator)48
p-value0.218275722619624
Multiple Linear Regression - Residual Statistics
Residual Standard Deviation73.9166856665979
Sum Squared Residuals262256.468156863


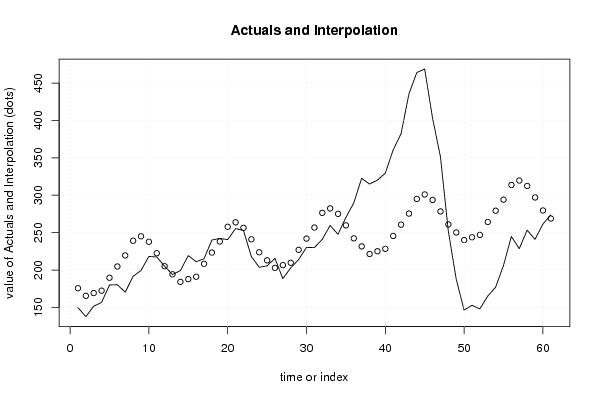
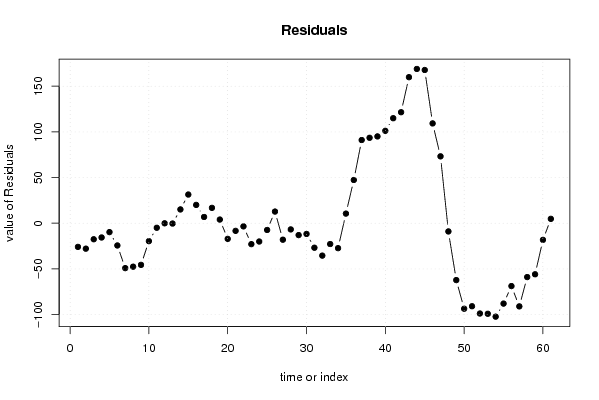
Multiple Linear Regression - Actuals, Interpolation, and Residuals
Time or IndexActualsInterpolationForecastResidualsPrediction Error
1149.8175.713725490196-25.9137254901962
2137.7165.550980392157-27.8509803921568
3151.7169.250980392157-17.5509803921568
4156.8172.410980392157-15.6109803921568
5180189.710980392157-9.71098039215681
6180.4204.750980392157-24.3509803921569
7170.4219.550980392157-49.1509803921568
8191.6239.170980392157-47.5709803921569
9199.5245.110980392157-45.6109803921567
10218.2237.810980392157-19.6109803921568
11217.5222.470980392157-4.97098039215689
12205205.090980392157-0.0909803921568542
13194194.348235294118-0.348235294117580
14199.3184.18549019607815.1145098039215
15219.3187.88549019607831.4145098039216
16211.1191.04549019607820.0545098039215
17215.2208.3454901960786.85450980392158
18240.2223.38549019607816.8145098039216
19242.2238.1854901960784.01450980392158
20240.7257.805490196078-17.1054901960784
21255.4263.745490196078-8.34549019607845
22253256.445490196078-3.44549019607845
23218.2241.105490196078-22.9054901960784
24203.7223.725490196078-20.0254901960784
25205.6212.982745098039-7.3827450980392
26215.6202.8212.7800000000000
27188.5206.52-18.02
28202.9209.68-6.78000000000001
29214226.98-12.9800000000000
30230.3242.02-11.7200000000000
31230256.82-26.82
32241276.44-35.44
33259.6282.38-22.78
34247.8275.08-27.28
35270.3259.7410.56
36289.7242.3647.34
37322.7231.61725490196191.0827450980393
38315221.45450980392293.5454901960784
39320.2225.15450980392295.0454901960784
40329.5228.314509803922101.185490196078
41360.6245.614509803922114.985490196078
42382.2260.654509803922121.545490196078
43435.4275.454509803922159.945490196078
44464295.074509803922168.925490196078
45468.8301.014509803922167.785490196078
46403293.714509803922109.285490196078
47351.6278.37450980392273.2254901960785
48252260.994509803922-8.99450980392156
49188250.251764705882-62.2517647058823
50146.5240.089019607843-93.5890196078431
51152.9243.789019607843-90.8890196078431
52148.1246.949019607843-98.8490196078431
53165.1264.249019607843-99.1490196078432
54177279.289019607843-102.289019607843
55206.1294.089019607843-87.9890196078431
56244.9313.709019607843-68.8090196078431
57228.6319.649019607843-91.0490196078432
58253.4312.349019607843-58.9490196078431
59241.1297.009019607843-55.9090196078431
60261.4279.629019607843-18.2290196078431
61273.7268.8862745098044.8137254901961

\begin{tabular}{lllllllll}
\hline
Multiple Linear Regression - Actuals, Interpolation, and Residuals \tabularnewline
Time or Index & Actuals & InterpolationForecast & ResidualsPrediction Error \tabularnewline
1 & 149.8 & 175.713725490196 & -25.9137254901962 \tabularnewline
2 & 137.7 & 165.550980392157 & -27.8509803921568 \tabularnewline
3 & 151.7 & 169.250980392157 & -17.5509803921568 \tabularnewline
4 & 156.8 & 172.410980392157 & -15.6109803921568 \tabularnewline
5 & 180 & 189.710980392157 & -9.71098039215681 \tabularnewline
6 & 180.4 & 204.750980392157 & -24.3509803921569 \tabularnewline
7 & 170.4 & 219.550980392157 & -49.1509803921568 \tabularnewline
8 & 191.6 & 239.170980392157 & -47.5709803921569 \tabularnewline
9 & 199.5 & 245.110980392157 & -45.6109803921567 \tabularnewline
10 & 218.2 & 237.810980392157 & -19.6109803921568 \tabularnewline
11 & 217.5 & 222.470980392157 & -4.97098039215689 \tabularnewline
12 & 205 & 205.090980392157 & -0.0909803921568542 \tabularnewline
13 & 194 & 194.348235294118 & -0.348235294117580 \tabularnewline
14 & 199.3 & 184.185490196078 & 15.1145098039215 \tabularnewline
15 & 219.3 & 187.885490196078 & 31.4145098039216 \tabularnewline
16 & 211.1 & 191.045490196078 & 20.0545098039215 \tabularnewline
17 & 215.2 & 208.345490196078 & 6.85450980392158 \tabularnewline
18 & 240.2 & 223.385490196078 & 16.8145098039216 \tabularnewline
19 & 242.2 & 238.185490196078 & 4.01450980392158 \tabularnewline
20 & 240.7 & 257.805490196078 & -17.1054901960784 \tabularnewline
21 & 255.4 & 263.745490196078 & -8.34549019607845 \tabularnewline
22 & 253 & 256.445490196078 & -3.44549019607845 \tabularnewline
23 & 218.2 & 241.105490196078 & -22.9054901960784 \tabularnewline
24 & 203.7 & 223.725490196078 & -20.0254901960784 \tabularnewline
25 & 205.6 & 212.982745098039 & -7.3827450980392 \tabularnewline
26 & 215.6 & 202.82 & 12.7800000000000 \tabularnewline
27 & 188.5 & 206.52 & -18.02 \tabularnewline
28 & 202.9 & 209.68 & -6.78000000000001 \tabularnewline
29 & 214 & 226.98 & -12.9800000000000 \tabularnewline
30 & 230.3 & 242.02 & -11.7200000000000 \tabularnewline
31 & 230 & 256.82 & -26.82 \tabularnewline
32 & 241 & 276.44 & -35.44 \tabularnewline
33 & 259.6 & 282.38 & -22.78 \tabularnewline
34 & 247.8 & 275.08 & -27.28 \tabularnewline
35 & 270.3 & 259.74 & 10.56 \tabularnewline
36 & 289.7 & 242.36 & 47.34 \tabularnewline
37 & 322.7 & 231.617254901961 & 91.0827450980393 \tabularnewline
38 & 315 & 221.454509803922 & 93.5454901960784 \tabularnewline
39 & 320.2 & 225.154509803922 & 95.0454901960784 \tabularnewline
40 & 329.5 & 228.314509803922 & 101.185490196078 \tabularnewline
41 & 360.6 & 245.614509803922 & 114.985490196078 \tabularnewline
42 & 382.2 & 260.654509803922 & 121.545490196078 \tabularnewline
43 & 435.4 & 275.454509803922 & 159.945490196078 \tabularnewline
44 & 464 & 295.074509803922 & 168.925490196078 \tabularnewline
45 & 468.8 & 301.014509803922 & 167.785490196078 \tabularnewline
46 & 403 & 293.714509803922 & 109.285490196078 \tabularnewline
47 & 351.6 & 278.374509803922 & 73.2254901960785 \tabularnewline
48 & 252 & 260.994509803922 & -8.99450980392156 \tabularnewline
49 & 188 & 250.251764705882 & -62.2517647058823 \tabularnewline
50 & 146.5 & 240.089019607843 & -93.5890196078431 \tabularnewline
51 & 152.9 & 243.789019607843 & -90.8890196078431 \tabularnewline
52 & 148.1 & 246.949019607843 & -98.8490196078431 \tabularnewline
53 & 165.1 & 264.249019607843 & -99.1490196078432 \tabularnewline
54 & 177 & 279.289019607843 & -102.289019607843 \tabularnewline
55 & 206.1 & 294.089019607843 & -87.9890196078431 \tabularnewline
56 & 244.9 & 313.709019607843 & -68.8090196078431 \tabularnewline
57 & 228.6 & 319.649019607843 & -91.0490196078432 \tabularnewline
58 & 253.4 & 312.349019607843 & -58.9490196078431 \tabularnewline
59 & 241.1 & 297.009019607843 & -55.9090196078431 \tabularnewline
60 & 261.4 & 279.629019607843 & -18.2290196078431 \tabularnewline
61 & 273.7 & 268.886274509804 & 4.8137254901961 \tabularnewline
\hline
\end{tabular}
%Source: https://freestatistics.org/blog/index.php?pk=69971&T=4

[TABLE]
[ROW][C]Multiple Linear Regression - Actuals, Interpolation, and Residuals[/C][/ROW]
[ROW][C]Time or Index[/C][C]Actuals[/C][C]InterpolationForecast[/C][C]ResidualsPrediction Error[/C][/ROW]
[ROW][C]1[/C][C]149.8[/C][C]175.713725490196[/C][C]-25.9137254901962[/C][/ROW]
[ROW][C]2[/C][C]137.7[/C][C]165.550980392157[/C][C]-27.8509803921568[/C][/ROW]
[ROW][C]3[/C][C]151.7[/C][C]169.250980392157[/C][C]-17.5509803921568[/C][/ROW]
[ROW][C]4[/C][C]156.8[/C][C]172.410980392157[/C][C]-15.6109803921568[/C][/ROW]
[ROW][C]5[/C][C]180[/C][C]189.710980392157[/C][C]-9.71098039215681[/C][/ROW]
[ROW][C]6[/C][C]180.4[/C][C]204.750980392157[/C][C]-24.3509803921569[/C][/ROW]
[ROW][C]7[/C][C]170.4[/C][C]219.550980392157[/C][C]-49.1509803921568[/C][/ROW]
[ROW][C]8[/C][C]191.6[/C][C]239.170980392157[/C][C]-47.5709803921569[/C][/ROW]
[ROW][C]9[/C][C]199.5[/C][C]245.110980392157[/C][C]-45.6109803921567[/C][/ROW]
[ROW][C]10[/C][C]218.2[/C][C]237.810980392157[/C][C]-19.6109803921568[/C][/ROW]
[ROW][C]11[/C][C]217.5[/C][C]222.470980392157[/C][C]-4.97098039215689[/C][/ROW]
[ROW][C]12[/C][C]205[/C][C]205.090980392157[/C][C]-0.0909803921568542[/C][/ROW]
[ROW][C]13[/C][C]194[/C][C]194.348235294118[/C][C]-0.348235294117580[/C][/ROW]
[ROW][C]14[/C][C]199.3[/C][C]184.185490196078[/C][C]15.1145098039215[/C][/ROW]
[ROW][C]15[/C][C]219.3[/C][C]187.885490196078[/C][C]31.4145098039216[/C][/ROW]
[ROW][C]16[/C][C]211.1[/C][C]191.045490196078[/C][C]20.0545098039215[/C][/ROW]
[ROW][C]17[/C][C]215.2[/C][C]208.345490196078[/C][C]6.85450980392158[/C][/ROW]
[ROW][C]18[/C][C]240.2[/C][C]223.385490196078[/C][C]16.8145098039216[/C][/ROW]
[ROW][C]19[/C][C]242.2[/C][C]238.185490196078[/C][C]4.01450980392158[/C][/ROW]
[ROW][C]20[/C][C]240.7[/C][C]257.805490196078[/C][C]-17.1054901960784[/C][/ROW]
[ROW][C]21[/C][C]255.4[/C][C]263.745490196078[/C][C]-8.34549019607845[/C][/ROW]
[ROW][C]22[/C][C]253[/C][C]256.445490196078[/C][C]-3.44549019607845[/C][/ROW]
[ROW][C]23[/C][C]218.2[/C][C]241.105490196078[/C][C]-22.9054901960784[/C][/ROW]
[ROW][C]24[/C][C]203.7[/C][C]223.725490196078[/C][C]-20.0254901960784[/C][/ROW]
[ROW][C]25[/C][C]205.6[/C][C]212.982745098039[/C][C]-7.3827450980392[/C][/ROW]
[ROW][C]26[/C][C]215.6[/C][C]202.82[/C][C]12.7800000000000[/C][/ROW]
[ROW][C]27[/C][C]188.5[/C][C]206.52[/C][C]-18.02[/C][/ROW]
[ROW][C]28[/C][C]202.9[/C][C]209.68[/C][C]-6.78000000000001[/C][/ROW]
[ROW][C]29[/C][C]214[/C][C]226.98[/C][C]-12.9800000000000[/C][/ROW]
[ROW][C]30[/C][C]230.3[/C][C]242.02[/C][C]-11.7200000000000[/C][/ROW]
[ROW][C]31[/C][C]230[/C][C]256.82[/C][C]-26.82[/C][/ROW]
[ROW][C]32[/C][C]241[/C][C]276.44[/C][C]-35.44[/C][/ROW]
[ROW][C]33[/C][C]259.6[/C][C]282.38[/C][C]-22.78[/C][/ROW]
[ROW][C]34[/C][C]247.8[/C][C]275.08[/C][C]-27.28[/C][/ROW]
[ROW][C]35[/C][C]270.3[/C][C]259.74[/C][C]10.56[/C][/ROW]
[ROW][C]36[/C][C]289.7[/C][C]242.36[/C][C]47.34[/C][/ROW]
[ROW][C]37[/C][C]322.7[/C][C]231.617254901961[/C][C]91.0827450980393[/C][/ROW]
[ROW][C]38[/C][C]315[/C][C]221.454509803922[/C][C]93.5454901960784[/C][/ROW]
[ROW][C]39[/C][C]320.2[/C][C]225.154509803922[/C][C]95.0454901960784[/C][/ROW]
[ROW][C]40[/C][C]329.5[/C][C]228.314509803922[/C][C]101.185490196078[/C][/ROW]
[ROW][C]41[/C][C]360.6[/C][C]245.614509803922[/C][C]114.985490196078[/C][/ROW]
[ROW][C]42[/C][C]382.2[/C][C]260.654509803922[/C][C]121.545490196078[/C][/ROW]
[ROW][C]43[/C][C]435.4[/C][C]275.454509803922[/C][C]159.945490196078[/C][/ROW]
[ROW][C]44[/C][C]464[/C][C]295.074509803922[/C][C]168.925490196078[/C][/ROW]
[ROW][C]45[/C][C]468.8[/C][C]301.014509803922[/C][C]167.785490196078[/C][/ROW]
[ROW][C]46[/C][C]403[/C][C]293.714509803922[/C][C]109.285490196078[/C][/ROW]
[ROW][C]47[/C][C]351.6[/C][C]278.374509803922[/C][C]73.2254901960785[/C][/ROW]
[ROW][C]48[/C][C]252[/C][C]260.994509803922[/C][C]-8.99450980392156[/C][/ROW]
[ROW][C]49[/C][C]188[/C][C]250.251764705882[/C][C]-62.2517647058823[/C][/ROW]
[ROW][C]50[/C][C]146.5[/C][C]240.089019607843[/C][C]-93.5890196078431[/C][/ROW]
[ROW][C]51[/C][C]152.9[/C][C]243.789019607843[/C][C]-90.8890196078431[/C][/ROW]
[ROW][C]52[/C][C]148.1[/C][C]246.949019607843[/C][C]-98.8490196078431[/C][/ROW]
[ROW][C]53[/C][C]165.1[/C][C]264.249019607843[/C][C]-99.1490196078432[/C][/ROW]
[ROW][C]54[/C][C]177[/C][C]279.289019607843[/C][C]-102.289019607843[/C][/ROW]
[ROW][C]55[/C][C]206.1[/C][C]294.089019607843[/C][C]-87.9890196078431[/C][/ROW]
[ROW][C]56[/C][C]244.9[/C][C]313.709019607843[/C][C]-68.8090196078431[/C][/ROW]
[ROW][C]57[/C][C]228.6[/C][C]319.649019607843[/C][C]-91.0490196078432[/C][/ROW]
[ROW][C]58[/C][C]253.4[/C][C]312.349019607843[/C][C]-58.9490196078431[/C][/ROW]
[ROW][C]59[/C][C]241.1[/C][C]297.009019607843[/C][C]-55.9090196078431[/C][/ROW]
[ROW][C]60[/C][C]261.4[/C][C]279.629019607843[/C][C]-18.2290196078431[/C][/ROW]
[ROW][C]61[/C][C]273.7[/C][C]268.886274509804[/C][C]4.8137254901961[/C][/ROW]
[/TABLE]
Source: https://freestatistics.org/blog/index.php?pk=69971&T=4

Globally Unique Identifier (entire table): ba.freestatistics.org/blog/index.php?pk=69971&T=4

As an alternative you can also use a QR Code:  

The GUIDs for individual cells are displayed in the table below:

Multiple Linear Regression - Actuals, Interpolation, and Residuals
Time or IndexActualsInterpolationForecastResidualsPrediction Error
1149.8175.713725490196-25.9137254901962
2137.7165.550980392157-27.8509803921568
3151.7169.250980392157-17.5509803921568
4156.8172.410980392157-15.6109803921568
5180189.710980392157-9.71098039215681
6180.4204.750980392157-24.3509803921569
7170.4219.550980392157-49.1509803921568
8191.6239.170980392157-47.5709803921569
9199.5245.110980392157-45.6109803921567
10218.2237.810980392157-19.6109803921568
11217.5222.470980392157-4.97098039215689
12205205.090980392157-0.0909803921568542
13194194.348235294118-0.348235294117580
14199.3184.18549019607815.1145098039215
15219.3187.88549019607831.4145098039216
16211.1191.04549019607820.0545098039215
17215.2208.3454901960786.85450980392158
18240.2223.38549019607816.8145098039216
19242.2238.1854901960784.01450980392158
20240.7257.805490196078-17.1054901960784
21255.4263.745490196078-8.34549019607845
22253256.445490196078-3.44549019607845
23218.2241.105490196078-22.9054901960784
24203.7223.725490196078-20.0254901960784
25205.6212.982745098039-7.3827450980392
26215.6202.8212.7800000000000
27188.5206.52-18.02
28202.9209.68-6.78000000000001
29214226.98-12.9800000000000
30230.3242.02-11.7200000000000
31230256.82-26.82
32241276.44-35.44
33259.6282.38-22.78
34247.8275.08-27.28
35270.3259.7410.56
36289.7242.3647.34
37322.7231.61725490196191.0827450980393
38315221.45450980392293.5454901960784
39320.2225.15450980392295.0454901960784
40329.5228.314509803922101.185490196078
41360.6245.614509803922114.985490196078
42382.2260.654509803922121.545490196078
43435.4275.454509803922159.945490196078
44464295.074509803922168.925490196078
45468.8301.014509803922167.785490196078
46403293.714509803922109.285490196078
47351.6278.37450980392273.2254901960785
48252260.994509803922-8.99450980392156
49188250.251764705882-62.2517647058823
50146.5240.089019607843-93.5890196078431
51152.9243.789019607843-90.8890196078431
52148.1246.949019607843-98.8490196078431
53165.1264.249019607843-99.1490196078432
54177279.289019607843-102.289019607843
55206.1294.089019607843-87.9890196078431
56244.9313.709019607843-68.8090196078431
57228.6319.649019607843-91.0490196078432
58253.4312.349019607843-58.9490196078431
59241.1297.009019607843-55.9090196078431
60261.4279.629019607843-18.2290196078431
61273.7268.8862745098044.8137254901961


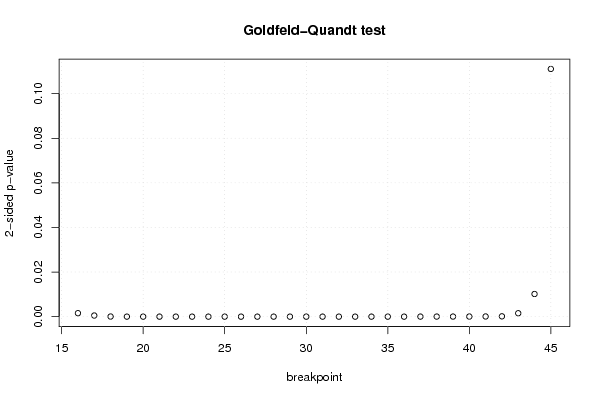
Goldfeld-Quandt test for Heteroskedasticity
p-valuesAlternative Hypothesis
breakpoint indexgreater2-sidedless
160.0007804901644778130.001560980328955630.999219509835522
170.0002538780934387210.0005077561868774410.999746121906561
182.57817939181908e-055.15635878363817e-050.999974218206082
195.58425863657065e-061.11685172731413e-050.999994415741363
206.04536223789105e-071.20907244757821e-060.999999395463776
215.31201894679895e-081.06240378935979e-070.99999994687981
221.74153591642974e-083.48307183285949e-080.99999998258464
232.44390843256174e-074.88781686512347e-070.999999755609157
244.21641227882270e-078.43282455764541e-070.999999578358772
252.08063058986654e-074.16126117973307e-070.99999979193694
264.16984492090240e-088.33968984180481e-080.99999995830155
279.16844287700599e-081.83368857540120e-070.999999908315571
283.74978251650155e-087.4995650330031e-080.999999962502175
291.56858798425946e-083.13717596851892e-080.99999998431412
305.41732713649657e-091.08346542729931e-080.999999994582673
312.43318218959333e-094.86636437918667e-090.999999997566818
321.93194310205314e-093.86388620410628e-090.999999998068057
331.78823086892251e-093.57646173784501e-090.99999999821177
346.11095551587227e-091.22219110317445e-080.999999993889044
351.69095799049995e-083.3819159809999e-080.99999998309042
361.54501463424023e-073.09002926848046e-070.999999845498537
378.86376561206864e-061.77275312241373e-050.999991136234388
381.65209022905853e-053.30418045811705e-050.99998347909771
392.04520744430858e-054.09041488861716e-050.999979547925557
402.31888948031983e-054.63777896063967e-050.999976811105197
414.02750683604052e-058.05501367208104e-050.99995972493164
427.25887105038182e-050.0001451774210076360.999927411289496
430.0007660284624849340.001532056924969870.999233971537515
440.005080843796725420.01016168759345080.994919156203275
450.05553992660302380.1110798532060480.944460073396976

\begin{tabular}{lllllllll}
\hline
Goldfeld-Quandt test for Heteroskedasticity \tabularnewline
p-values & Alternative Hypothesis \tabularnewline
breakpoint index & greater & 2-sided & less \tabularnewline
16 & 0.000780490164477813 & 0.00156098032895563 & 0.999219509835522 \tabularnewline
17 & 0.000253878093438721 & 0.000507756186877441 & 0.999746121906561 \tabularnewline
18 & 2.57817939181908e-05 & 5.15635878363817e-05 & 0.999974218206082 \tabularnewline
19 & 5.58425863657065e-06 & 1.11685172731413e-05 & 0.999994415741363 \tabularnewline
20 & 6.04536223789105e-07 & 1.20907244757821e-06 & 0.999999395463776 \tabularnewline
21 & 5.31201894679895e-08 & 1.06240378935979e-07 & 0.99999994687981 \tabularnewline
22 & 1.74153591642974e-08 & 3.48307183285949e-08 & 0.99999998258464 \tabularnewline
23 & 2.44390843256174e-07 & 4.88781686512347e-07 & 0.999999755609157 \tabularnewline
24 & 4.21641227882270e-07 & 8.43282455764541e-07 & 0.999999578358772 \tabularnewline
25 & 2.08063058986654e-07 & 4.16126117973307e-07 & 0.99999979193694 \tabularnewline
26 & 4.16984492090240e-08 & 8.33968984180481e-08 & 0.99999995830155 \tabularnewline
27 & 9.16844287700599e-08 & 1.83368857540120e-07 & 0.999999908315571 \tabularnewline
28 & 3.74978251650155e-08 & 7.4995650330031e-08 & 0.999999962502175 \tabularnewline
29 & 1.56858798425946e-08 & 3.13717596851892e-08 & 0.99999998431412 \tabularnewline
30 & 5.41732713649657e-09 & 1.08346542729931e-08 & 0.999999994582673 \tabularnewline
31 & 2.43318218959333e-09 & 4.86636437918667e-09 & 0.999999997566818 \tabularnewline
32 & 1.93194310205314e-09 & 3.86388620410628e-09 & 0.999999998068057 \tabularnewline
33 & 1.78823086892251e-09 & 3.57646173784501e-09 & 0.99999999821177 \tabularnewline
34 & 6.11095551587227e-09 & 1.22219110317445e-08 & 0.999999993889044 \tabularnewline
35 & 1.69095799049995e-08 & 3.3819159809999e-08 & 0.99999998309042 \tabularnewline
36 & 1.54501463424023e-07 & 3.09002926848046e-07 & 0.999999845498537 \tabularnewline
37 & 8.86376561206864e-06 & 1.77275312241373e-05 & 0.999991136234388 \tabularnewline
38 & 1.65209022905853e-05 & 3.30418045811705e-05 & 0.99998347909771 \tabularnewline
39 & 2.04520744430858e-05 & 4.09041488861716e-05 & 0.999979547925557 \tabularnewline
40 & 2.31888948031983e-05 & 4.63777896063967e-05 & 0.999976811105197 \tabularnewline
41 & 4.02750683604052e-05 & 8.05501367208104e-05 & 0.99995972493164 \tabularnewline
42 & 7.25887105038182e-05 & 0.000145177421007636 & 0.999927411289496 \tabularnewline
43 & 0.000766028462484934 & 0.00153205692496987 & 0.999233971537515 \tabularnewline
44 & 0.00508084379672542 & 0.0101616875934508 & 0.994919156203275 \tabularnewline
45 & 0.0555399266030238 & 0.111079853206048 & 0.944460073396976 \tabularnewline
\hline
\end{tabular}
%Source: https://freestatistics.org/blog/index.php?pk=69971&T=5

[TABLE]
[ROW][C]Goldfeld-Quandt test for Heteroskedasticity[/C][/ROW]
[ROW][C]p-values[/C][C]Alternative Hypothesis[/C][/ROW]
[ROW][C]breakpoint index[/C][C]greater[/C][C]2-sided[/C][C]less[/C][/ROW]
[ROW][C]16[/C][C]0.000780490164477813[/C][C]0.00156098032895563[/C][C]0.999219509835522[/C][/ROW]
[ROW][C]17[/C][C]0.000253878093438721[/C][C]0.000507756186877441[/C][C]0.999746121906561[/C][/ROW]
[ROW][C]18[/C][C]2.57817939181908e-05[/C][C]5.15635878363817e-05[/C][C]0.999974218206082[/C][/ROW]
[ROW][C]19[/C][C]5.58425863657065e-06[/C][C]1.11685172731413e-05[/C][C]0.999994415741363[/C][/ROW]
[ROW][C]20[/C][C]6.04536223789105e-07[/C][C]1.20907244757821e-06[/C][C]0.999999395463776[/C][/ROW]
[ROW][C]21[/C][C]5.31201894679895e-08[/C][C]1.06240378935979e-07[/C][C]0.99999994687981[/C][/ROW]
[ROW][C]22[/C][C]1.74153591642974e-08[/C][C]3.48307183285949e-08[/C][C]0.99999998258464[/C][/ROW]
[ROW][C]23[/C][C]2.44390843256174e-07[/C][C]4.88781686512347e-07[/C][C]0.999999755609157[/C][/ROW]
[ROW][C]24[/C][C]4.21641227882270e-07[/C][C]8.43282455764541e-07[/C][C]0.999999578358772[/C][/ROW]
[ROW][C]25[/C][C]2.08063058986654e-07[/C][C]4.16126117973307e-07[/C][C]0.99999979193694[/C][/ROW]
[ROW][C]26[/C][C]4.16984492090240e-08[/C][C]8.33968984180481e-08[/C][C]0.99999995830155[/C][/ROW]
[ROW][C]27[/C][C]9.16844287700599e-08[/C][C]1.83368857540120e-07[/C][C]0.999999908315571[/C][/ROW]
[ROW][C]28[/C][C]3.74978251650155e-08[/C][C]7.4995650330031e-08[/C][C]0.999999962502175[/C][/ROW]
[ROW][C]29[/C][C]1.56858798425946e-08[/C][C]3.13717596851892e-08[/C][C]0.99999998431412[/C][/ROW]
[ROW][C]30[/C][C]5.41732713649657e-09[/C][C]1.08346542729931e-08[/C][C]0.999999994582673[/C][/ROW]
[ROW][C]31[/C][C]2.43318218959333e-09[/C][C]4.86636437918667e-09[/C][C]0.999999997566818[/C][/ROW]
[ROW][C]32[/C][C]1.93194310205314e-09[/C][C]3.86388620410628e-09[/C][C]0.999999998068057[/C][/ROW]
[ROW][C]33[/C][C]1.78823086892251e-09[/C][C]3.57646173784501e-09[/C][C]0.99999999821177[/C][/ROW]
[ROW][C]34[/C][C]6.11095551587227e-09[/C][C]1.22219110317445e-08[/C][C]0.999999993889044[/C][/ROW]
[ROW][C]35[/C][C]1.69095799049995e-08[/C][C]3.3819159809999e-08[/C][C]0.99999998309042[/C][/ROW]
[ROW][C]36[/C][C]1.54501463424023e-07[/C][C]3.09002926848046e-07[/C][C]0.999999845498537[/C][/ROW]
[ROW][C]37[/C][C]8.86376561206864e-06[/C][C]1.77275312241373e-05[/C][C]0.999991136234388[/C][/ROW]
[ROW][C]38[/C][C]1.65209022905853e-05[/C][C]3.30418045811705e-05[/C][C]0.99998347909771[/C][/ROW]
[ROW][C]39[/C][C]2.04520744430858e-05[/C][C]4.09041488861716e-05[/C][C]0.999979547925557[/C][/ROW]
[ROW][C]40[/C][C]2.31888948031983e-05[/C][C]4.63777896063967e-05[/C][C]0.999976811105197[/C][/ROW]
[ROW][C]41[/C][C]4.02750683604052e-05[/C][C]8.05501367208104e-05[/C][C]0.99995972493164[/C][/ROW]
[ROW][C]42[/C][C]7.25887105038182e-05[/C][C]0.000145177421007636[/C][C]0.999927411289496[/C][/ROW]
[ROW][C]43[/C][C]0.000766028462484934[/C][C]0.00153205692496987[/C][C]0.999233971537515[/C][/ROW]
[ROW][C]44[/C][C]0.00508084379672542[/C][C]0.0101616875934508[/C][C]0.994919156203275[/C][/ROW]
[ROW][C]45[/C][C]0.0555399266030238[/C][C]0.111079853206048[/C][C]0.944460073396976[/C][/ROW]
[/TABLE]
Source: https://freestatistics.org/blog/index.php?pk=69971&T=5

Globally Unique Identifier (entire table): ba.freestatistics.org/blog/index.php?pk=69971&T=5

As an alternative you can also use a QR Code:  

The GUIDs for individual cells are displayed in the table below:

Goldfeld-Quandt test for Heteroskedasticity
p-valuesAlternative Hypothesis
breakpoint indexgreater2-sidedless
160.0007804901644778130.001560980328955630.999219509835522
170.0002538780934387210.0005077561868774410.999746121906561
182.57817939181908e-055.15635878363817e-050.999974218206082
195.58425863657065e-061.11685172731413e-050.999994415741363
206.04536223789105e-071.20907244757821e-060.999999395463776
215.31201894679895e-081.06240378935979e-070.99999994687981
221.74153591642974e-083.48307183285949e-080.99999998258464
232.44390843256174e-074.88781686512347e-070.999999755609157
244.21641227882270e-078.43282455764541e-070.999999578358772
252.08063058986654e-074.16126117973307e-070.99999979193694
264.16984492090240e-088.33968984180481e-080.99999995830155
279.16844287700599e-081.83368857540120e-070.999999908315571
283.74978251650155e-087.4995650330031e-080.999999962502175
291.56858798425946e-083.13717596851892e-080.99999998431412
305.41732713649657e-091.08346542729931e-080.999999994582673
312.43318218959333e-094.86636437918667e-090.999999997566818
321.93194310205314e-093.86388620410628e-090.999999998068057
331.78823086892251e-093.57646173784501e-090.99999999821177
346.11095551587227e-091.22219110317445e-080.999999993889044
351.69095799049995e-083.3819159809999e-080.99999998309042
361.54501463424023e-073.09002926848046e-070.999999845498537
378.86376561206864e-061.77275312241373e-050.999991136234388
381.65209022905853e-053.30418045811705e-050.99998347909771
392.04520744430858e-054.09041488861716e-050.999979547925557
402.31888948031983e-054.63777896063967e-050.999976811105197
414.02750683604052e-058.05501367208104e-050.99995972493164
427.25887105038182e-050.0001451774210076360.999927411289496
430.0007660284624849340.001532056924969870.999233971537515
440.005080843796725420.01016168759345080.994919156203275
450.05553992660302380.1110798532060480.944460073396976


Meta Analysis of Goldfeld-Quandt test for Heteroskedasticity
Description# significant tests% significant testsOK/NOK
1% type I error level280.933333333333333NOK
5% type I error level290.966666666666667NOK
10% type I error level290.966666666666667NOK

\begin{tabular}{lllllllll}
\hline
Meta Analysis of Goldfeld-Quandt test for Heteroskedasticity \tabularnewline
Description & # significant tests & % significant tests & OK/NOK \tabularnewline
1% type I error level & 28 & 0.933333333333333 & NOK \tabularnewline
5% type I error level & 29 & 0.966666666666667 & NOK \tabularnewline
10% type I error level & 29 & 0.966666666666667 & NOK \tabularnewline
\hline
\end{tabular}
%Source: https://freestatistics.org/blog/index.php?pk=69971&T=6

[TABLE]
[ROW][C]Meta Analysis of Goldfeld-Quandt test for Heteroskedasticity[/C][/ROW]
[ROW][C]Description[/C][C]# significant tests[/C][C]% significant tests[/C][C]OK/NOK[/C][/ROW]
[ROW][C]1% type I error level[/C][C]28[/C][C]0.933333333333333[/C][C]NOK[/C][/ROW]
[ROW][C]5% type I error level[/C][C]29[/C][C]0.966666666666667[/C][C]NOK[/C][/ROW]
[ROW][C]10% type I error level[/C][C]29[/C][C]0.966666666666667[/C][C]NOK[/C][/ROW]
[/TABLE]
Source: https://freestatistics.org/blog/index.php?pk=69971&T=6

Globally Unique Identifier (entire table): ba.freestatistics.org/blog/index.php?pk=69971&T=6

As an alternative you can also use a QR Code:  

The GUIDs for individual cells are displayed in the table below:

Meta Analysis of Goldfeld-Quandt test for Heteroskedasticity
Description# significant tests% significant testsOK/NOK
1% type I error level280.933333333333333NOK
5% type I error level290.966666666666667NOK
10% type I error level290.966666666666667NOK


Parameters (Session):
par1 = 1 ; par2 = Include Monthly Dummies ; par3 = Linear Trend ;
Parameters (R input):
par1 = 1 ; par2 = Include Monthly Dummies ; par3 = Linear Trend ;
R code (references can be found in the software module):
library(lattice)
library(lmtest)
n25 <- 25 #minimum number of obs. for Goldfeld-Quandt test
par1 <- as.numeric(par1)
x <- t(y)
k <- length(x[1,])
n <- length(x[,1])
x1 <- cbind(x[,par1], x[,1:k!=par1])
mycolnames <- c(colnames(x)[par1], colnames(x)[1:k!=par1])
colnames(x1) <- mycolnames #colnames(x)[par1]
x <- x1
if (par3 == 'First Differences'){
x2 <- array(0, dim=c(n-1,k), dimnames=list(1:(n-1), paste('(1-B)',colnames(x),sep='')))
for (i in 1:n-1) {
for (j in 1:k) {
x2[i,j] <- x[i+1,j] - x[i,j]
}
}
x <- x2
}
if (par2 == 'Include Monthly Dummies'){
x2 <- array(0, dim=c(n,11), dimnames=list(1:n, paste('M', seq(1:11), sep ='')))
for (i in 1:11){
x2[seq(i,n,12),i] <- 1
}
x <- cbind(x, x2)
}
if (par2 == 'Include Quarterly Dummies'){
x2 <- array(0, dim=c(n,3), dimnames=list(1:n, paste('Q', seq(1:3), sep ='')))
for (i in 1:3){
x2[seq(i,n,4),i] <- 1
}
x <- cbind(x, x2)
}
k <- length(x[1,])
if (par3 == 'Linear Trend'){
x <- cbind(x, c(1:n))
colnames(x)[k+1] <- 't'
}
x
k <- length(x[1,])
df <- as.data.frame(x)
(mylm <- lm(df))
(mysum <- summary(mylm))
if (n > n25) {
kp3 <- k + 3
nmkm3 <- n - k - 3
gqarr <- array(NA, dim=c(nmkm3-kp3+1,3))
numgqtests <- 0
numsignificant1 <- 0
numsignificant5 <- 0
numsignificant10 <- 0
for (mypoint in kp3:nmkm3) {
j <- 0
numgqtests <- numgqtests + 1
for (myalt in c('greater', 'two.sided', 'less')) {
j <- j + 1
gqarr[mypoint-kp3+1,j] <- gqtest(mylm, point=mypoint, alternative=myalt)$p.value
}
if (gqarr[mypoint-kp3+1,2] < 0.01) numsignificant1 <- numsignificant1 + 1
if (gqarr[mypoint-kp3+1,2] < 0.05) numsignificant5 <- numsignificant5 + 1
if (gqarr[mypoint-kp3+1,2] < 0.10) numsignificant10 <- numsignificant10 + 1
}
gqarr
}
bitmap(file='test0.png')
plot(x[,1], type='l', main='Actuals and Interpolation', ylab='value of Actuals and Interpolation (dots)', xlab='time or index')
points(x[,1]-mysum$resid)
grid()
dev.off()
bitmap(file='test1.png')
plot(mysum$resid, type='b', pch=19, main='Residuals', ylab='value of Residuals', xlab='time or index')
grid()
dev.off()
bitmap(file='test2.png')
hist(mysum$resid, main='Residual Histogram', xlab='values of Residuals')
grid()
dev.off()
bitmap(file='test3.png')
densityplot(~mysum$resid,col='black',main='Residual Density Plot', xlab='values of Residuals')
dev.off()
bitmap(file='test4.png')
qqnorm(mysum$resid, main='Residual Normal Q-Q Plot')
qqline(mysum$resid)
grid()
dev.off()
(myerror <- as.ts(mysum$resid))
bitmap(file='test5.png')
dum <- cbind(lag(myerror,k=1),myerror)
dum
dum1 <- dum[2:length(myerror),]
dum1
z <- as.data.frame(dum1)
z
plot(z,main=paste('Residual Lag plot, lowess, and regression line'), ylab='values of Residuals', xlab='lagged values of Residuals')
lines(lowess(z))
abline(lm(z))
grid()
dev.off()
bitmap(file='test6.png')
acf(mysum$resid, lag.max=length(mysum$resid)/2, main='Residual Autocorrelation Function')
grid()
dev.off()
bitmap(file='test7.png')
pacf(mysum$resid, lag.max=length(mysum$resid)/2, main='Residual Partial Autocorrelation Function')
grid()
dev.off()
bitmap(file='test8.png')
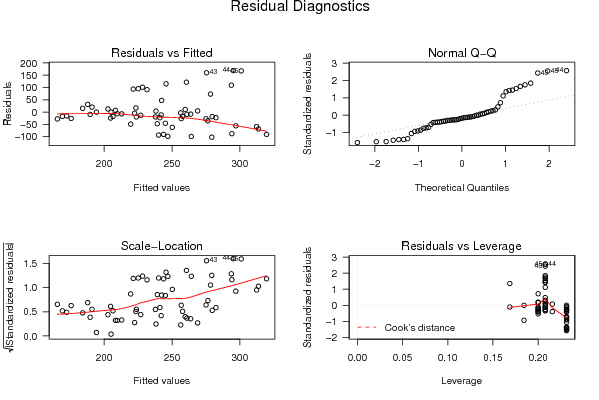
opar <- par(mfrow = c(2,2), oma = c(0, 0, 1.1, 0))
plot(mylm, las = 1, sub='Residual Diagnostics')
par(opar)
dev.off()
if (n > n25) {
bitmap(file='test9.png')
plot(kp3:nmkm3,gqarr[,2], main='Goldfeld-Quandt test',ylab='2-sided p-value',xlab='breakpoint')
grid()
dev.off()
}
load(file='createtable')
a<-table.start()
a<-table.row.start(a)
a<-table.element(a, 'Multiple Linear Regression - Estimated Regression Equation', 1, TRUE)
a<-table.row.end(a)
myeq <- colnames(x)[1]
myeq <- paste(myeq, '[t] = ', sep='')
for (i in 1:k){
if (mysum$coefficients[i,1] > 0) myeq <- paste(myeq, '+', '')
myeq <- paste(myeq, mysum$coefficients[i,1], sep=' ')
if (rownames(mysum$coefficients)[i] != '(Intercept)') {
myeq <- paste(myeq, rownames(mysum$coefficients)[i], sep='')
if (rownames(mysum$coefficients)[i] != 't') myeq <- paste(myeq, '[t]', sep='')
}
}
myeq <- paste(myeq, ' + e[t]')
a<-table.row.start(a)
a<-table.element(a, myeq)
a<-table.row.end(a)
a<-table.end(a)
table.save(a,file='mytable1.tab')
a<-table.start()
a<-table.row.start(a)
a<-table.element(a,hyperlink('ols1.htm','Multiple Linear Regression - Ordinary Least Squares',''), 6, TRUE)
a<-table.row.end(a)
a<-table.row.start(a)
a<-table.element(a,'Variable',header=TRUE)
a<-table.element(a,'Parameter',header=TRUE)
a<-table.element(a,'S.D.',header=TRUE)
a<-table.element(a,'T-STAT
H0: parameter = 0',header=TRUE)
a<-table.element(a,'2-tail p-value',header=TRUE)
a<-table.element(a,'1-tail p-value',header=TRUE)
a<-table.row.end(a)
for (i in 1:k){
a<-table.row.start(a)
a<-table.element(a,rownames(mysum$coefficients)[i],header=TRUE)
a<-table.element(a,mysum$coefficients[i,1])
a<-table.element(a, round(mysum$coefficients[i,2],6))
a<-table.element(a, round(mysum$coefficients[i,3],4))
a<-table.element(a, round(mysum$coefficients[i,4],6))
a<-table.element(a, round(mysum$coefficients[i,4]/2,6))
a<-table.row.end(a)
}
a<-table.end(a)
table.save(a,file='mytable2.tab')
a<-table.start()
a<-table.row.start(a)
a<-table.element(a, 'Multiple Linear Regression - Regression Statistics', 2, TRUE)
a<-table.row.end(a)
a<-table.row.start(a)
a<-table.element(a, 'Multiple R',1,TRUE)
a<-table.element(a, sqrt(mysum$r.squared))
a<-table.row.end(a)
a<-table.row.start(a)
a<-table.element(a, 'R-squared',1,TRUE)
a<-table.element(a, mysum$r.squared)
a<-table.row.end(a)
a<-table.row.start(a)
a<-table.element(a, 'Adjusted R-squared',1,TRUE)
a<-table.element(a, mysum$adj.r.squared)
a<-table.row.end(a)
a<-table.row.start(a)
a<-table.element(a, 'F-TEST (value)',1,TRUE)
a<-table.element(a, mysum$fstatistic[1])
a<-table.row.end(a)
a<-table.row.start(a)
a<-table.element(a, 'F-TEST (DF numerator)',1,TRUE)
a<-table.element(a, mysum$fstatistic[2])
a<-table.row.end(a)
a<-table.row.start(a)
a<-table.element(a, 'F-TEST (DF denominator)',1,TRUE)
a<-table.element(a, mysum$fstatistic[3])
a<-table.row.end(a)
a<-table.row.start(a)
a<-table.element(a, 'p-value',1,TRUE)
a<-table.element(a, 1-pf(mysum$fstatistic[1],mysum$fstatistic[2],mysum$fstatistic[3]))
a<-table.row.end(a)
a<-table.row.start(a)
a<-table.element(a, 'Multiple Linear Regression - Residual Statistics', 2, TRUE)
a<-table.row.end(a)
a<-table.row.start(a)
a<-table.element(a, 'Residual Standard Deviation',1,TRUE)
a<-table.element(a, mysum$sigma)
a<-table.row.end(a)
a<-table.row.start(a)
a<-table.element(a, 'Sum Squared Residuals',1,TRUE)
a<-table.element(a, sum(myerror*myerror))
a<-table.row.end(a)
a<-table.end(a)
table.save(a,file='mytable3.tab')
a<-table.start()
a<-table.row.start(a)
a<-table.element(a, 'Multiple Linear Regression - Actuals, Interpolation, and Residuals', 4, TRUE)
a<-table.row.end(a)
a<-table.row.start(a)
a<-table.element(a, 'Time or Index', 1, TRUE)
a<-table.element(a, 'Actuals', 1, TRUE)
a<-table.element(a, 'Interpolation
Forecast', 1, TRUE)
a<-table.element(a, 'Residuals
Prediction Error', 1, TRUE)
a<-table.row.end(a)
for (i in 1:n) {
a<-table.row.start(a)
a<-table.element(a,i, 1, TRUE)
a<-table.element(a,x[i])
a<-table.element(a,x[i]-mysum$resid[i])
a<-table.element(a,mysum$resid[i])
a<-table.row.end(a)
}
a<-table.end(a)
table.save(a,file='mytable4.tab')
if (n > n25) {
a<-table.start()
a<-table.row.start(a)
a<-table.element(a,'Goldfeld-Quandt test for Heteroskedasticity',4,TRUE)
a<-table.row.end(a)
a<-table.row.start(a)
a<-table.element(a,'p-values',header=TRUE)
a<-table.element(a,'Alternative Hypothesis',3,header=TRUE)
a<-table.row.end(a)
a<-table.row.start(a)
a<-table.element(a,'breakpoint index',header=TRUE)
a<-table.element(a,'greater',header=TRUE)
a<-table.element(a,'2-sided',header=TRUE)
a<-table.element(a,'less',header=TRUE)
a<-table.row.end(a)
for (mypoint in kp3:nmkm3) {
a<-table.row.start(a)
a<-table.element(a,mypoint,header=TRUE)
a<-table.element(a,gqarr[mypoint-kp3+1,1])
a<-table.element(a,gqarr[mypoint-kp3+1,2])
a<-table.element(a,gqarr[mypoint-kp3+1,3])
a<-table.row.end(a)
}
a<-table.end(a)
table.save(a,file='mytable5.tab')
a<-table.start()
a<-table.row.start(a)
a<-table.element(a,'Meta Analysis of Goldfeld-Quandt test for Heteroskedasticity',4,TRUE)
a<-table.row.end(a)
a<-table.row.start(a)
a<-table.element(a,'Description',header=TRUE)
a<-table.element(a,'# significant tests',header=TRUE)
a<-table.element(a,'% significant tests',header=TRUE)
a<-table.element(a,'OK/NOK',header=TRUE)
a<-table.row.end(a)
a<-table.row.start(a)
a<-table.element(a,'1% type I error level',header=TRUE)
a<-table.element(a,numsignificant1)
a<-table.element(a,numsignificant1/numgqtests)
if (numsignificant1/numgqtests < 0.01) dum <- 'OK' else dum <- 'NOK'
a<-table.element(a,dum)
a<-table.row.end(a)
a<-table.row.start(a)
a<-table.element(a,'5% type I error level',header=TRUE)
a<-table.element(a,numsignificant5)
a<-table.element(a,numsignificant5/numgqtests)
if (numsignificant5/numgqtests < 0.05) dum <- 'OK' else dum <- 'NOK'
a<-table.element(a,dum)
a<-table.row.end(a)
a<-table.row.start(a)
a<-table.element(a,'10% type I error level',header=TRUE)
a<-table.element(a,numsignificant10)
a<-table.element(a,numsignificant10/numgqtests)
if (numsignificant10/numgqtests < 0.1) dum <- 'OK' else dum <- 'NOK'
a<-table.element(a,dum)
a<-table.row.end(a)
a<-table.end(a)
table.save(a,file='mytable6.tab')
}