Free Statistics
of Irreproducible Research!
Description of Statistical Computation | |||||||||||||||||||||||||||||||||||||||||
|---|---|---|---|---|---|---|---|---|---|---|---|---|---|---|---|---|---|---|---|---|---|---|---|---|---|---|---|---|---|---|---|---|---|---|---|---|---|---|---|---|---|
| Author's title | |||||||||||||||||||||||||||||||||||||||||
| Author | *The author of this computation has been verified* | ||||||||||||||||||||||||||||||||||||||||
| R Software Module | rwasp_univariatedataseries.wasp | ||||||||||||||||||||||||||||||||||||||||
| Title produced by software | Univariate Data Series | ||||||||||||||||||||||||||||||||||||||||
| Date of computation | Sun, 20 Dec 2009 11:48:32 -0700 | ||||||||||||||||||||||||||||||||||||||||
| Cite this page as follows | Statistical Computations at FreeStatistics.org, Office for Research Development and Education, URL https://freestatistics.org/blog/index.php?v=date/2009/Dec/20/t1261335244ry1icgrdgztp6tt.htm/, Retrieved Sat, 27 Apr 2024 11:12:42 +0000 | ||||||||||||||||||||||||||||||||||||||||
| Statistical Computations at FreeStatistics.org, Office for Research Development and Education, URL https://freestatistics.org/blog/index.php?pk=69983, Retrieved Sat, 27 Apr 2024 11:12:42 +0000 | |||||||||||||||||||||||||||||||||||||||||
| QR Codes: | |||||||||||||||||||||||||||||||||||||||||
|
| |||||||||||||||||||||||||||||||||||||||||
| Original text written by user: | |||||||||||||||||||||||||||||||||||||||||
| IsPrivate? | No (this computation is public) | ||||||||||||||||||||||||||||||||||||||||
| User-defined keywords | |||||||||||||||||||||||||||||||||||||||||
| Estimated Impact | 142 | ||||||||||||||||||||||||||||||||||||||||
Tree of Dependent Computations | |||||||||||||||||||||||||||||||||||||||||
| Family? (F = Feedback message, R = changed R code, M = changed R Module, P = changed Parameters, D = changed Data) | |||||||||||||||||||||||||||||||||||||||||
| - [Univariate Data Series] [De Belgische uitv...] [2009-10-13 01:35:54] [df6326eec97a6ca984a853b142930499] - RMPD [Univariate Data Series] [ws8] [2009-11-27 12:04:12] [acdebb2ecda2ddb208f4e14f4a68b9e7] - PD [Univariate Data Series] [consumptiekrediet] [2009-12-04 10:09:44] [acdebb2ecda2ddb208f4e14f4a68b9e7] - PD [Univariate Data Series] [Verkoopprijzen pe...] [2009-12-20 18:48:32] [b243db81ea3e1f02fb3382887fb0f701] [Current] | |||||||||||||||||||||||||||||||||||||||||
| Feedback Forum | |||||||||||||||||||||||||||||||||||||||||
Post a new message | |||||||||||||||||||||||||||||||||||||||||
Dataset | |||||||||||||||||||||||||||||||||||||||||
| Dataseries X: | |||||||||||||||||||||||||||||||||||||||||
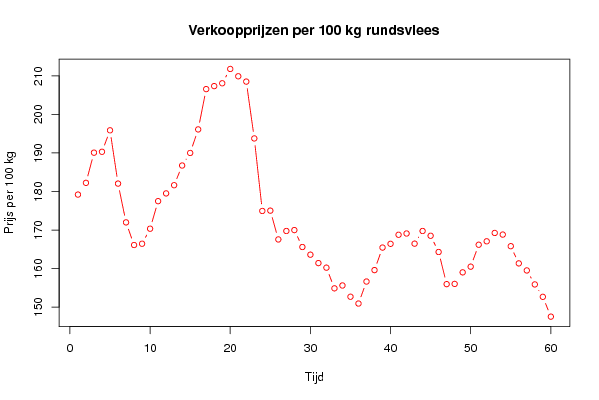
179,2000 182,2400 190,0700 190,3000 195,8800 182,0500 171,9800 166,1100 166,4400 170,3400 177,4900 179,5000 181,6300 186,7400 190,0000 196,1100 206,5700 207,3500 208,0800 211,8000 209,9000 208,5200 193,7700 174,9500 175,0300 167,5600 169,7500 169,9800 165,5900 163,6000 161,4200 160,2300 154,8700 155,6100 152,6900 150,9200 156,6300 159,6000 165,4500 166,4200 168,7700 169,1000 166,4600 169,7500 168,5100 164,3000 155,9600 156,0200 159,0157 160,4933 166,1796 167,0734 169,2398 168,8168 165,8043 161,3460 159,5113 155,8830 152,6651 147,5191 | |||||||||||||||||||||||||||||||||||||||||
Tables (Output of Computation) | |||||||||||||||||||||||||||||||||||||||||
| |||||||||||||||||||||||||||||||||||||||||
Figures (Output of Computation) | |||||||||||||||||||||||||||||||||||||||||
Input Parameters & R Code | |||||||||||||||||||||||||||||||||||||||||
| Parameters (Session): | |||||||||||||||||||||||||||||||||||||||||
| par1 = Verkoopprijzen per 100kg rundsvlees ; par2 = Eurostat ; par3 = Verkoopprijzen per 100 Kg rundsvlees ; | |||||||||||||||||||||||||||||||||||||||||
| Parameters (R input): | |||||||||||||||||||||||||||||||||||||||||
| par1 = Verkoopprijzen per 100kg rundsvlees ; par2 = Eurostat ; par3 = Verkoopprijzen per 100 Kg rundsvlees ; | |||||||||||||||||||||||||||||||||||||||||
| R code (references can be found in the software module): | |||||||||||||||||||||||||||||||||||||||||
bitmap(file='test1.png') | |||||||||||||||||||||||||||||||||||||||||