Free Statistics
of Irreproducible Research!
Description of Statistical Computation | |||||||||||||||||||||||||||||||||||||||||
|---|---|---|---|---|---|---|---|---|---|---|---|---|---|---|---|---|---|---|---|---|---|---|---|---|---|---|---|---|---|---|---|---|---|---|---|---|---|---|---|---|---|
| Author's title | |||||||||||||||||||||||||||||||||||||||||
| Author | *The author of this computation has been verified* | ||||||||||||||||||||||||||||||||||||||||
| R Software Module | rwasp_univariatedataseries.wasp | ||||||||||||||||||||||||||||||||||||||||
| Title produced by software | Univariate Data Series | ||||||||||||||||||||||||||||||||||||||||
| Date of computation | Sun, 20 Dec 2009 12:14:58 -0700 | ||||||||||||||||||||||||||||||||||||||||
| Cite this page as follows | Statistical Computations at FreeStatistics.org, Office for Research Development and Education, URL https://freestatistics.org/blog/index.php?v=date/2009/Dec/20/t1261336704e1qm2jxl75lez9e.htm/, Retrieved Sat, 27 Apr 2024 05:49:41 +0000 | ||||||||||||||||||||||||||||||||||||||||
| Statistical Computations at FreeStatistics.org, Office for Research Development and Education, URL https://freestatistics.org/blog/index.php?pk=69991, Retrieved Sat, 27 Apr 2024 05:49:41 +0000 | |||||||||||||||||||||||||||||||||||||||||
| QR Codes: | |||||||||||||||||||||||||||||||||||||||||
|
| |||||||||||||||||||||||||||||||||||||||||
| Original text written by user: | |||||||||||||||||||||||||||||||||||||||||
| IsPrivate? | No (this computation is public) | ||||||||||||||||||||||||||||||||||||||||
| User-defined keywords | |||||||||||||||||||||||||||||||||||||||||
| Estimated Impact | 157 | ||||||||||||||||||||||||||||||||||||||||
Tree of Dependent Computations | |||||||||||||||||||||||||||||||||||||||||
| Family? (F = Feedback message, R = changed R code, M = changed R Module, P = changed Parameters, D = changed Data) | |||||||||||||||||||||||||||||||||||||||||
| - [Univariate Data Series] [De Belgische uitv...] [2009-10-13 01:35:54] [df6326eec97a6ca984a853b142930499] - RMPD [Univariate Data Series] [ws8] [2009-11-27 12:04:12] [acdebb2ecda2ddb208f4e14f4a68b9e7] - PD [Univariate Data Series] [consumptiekrediet] [2009-12-04 10:09:44] [acdebb2ecda2ddb208f4e14f4a68b9e7] - PD [Univariate Data Series] [Aantal ton geslac...] [2009-12-20 19:14:58] [b243db81ea3e1f02fb3382887fb0f701] [Current] | |||||||||||||||||||||||||||||||||||||||||
| Feedback Forum | |||||||||||||||||||||||||||||||||||||||||
Post a new message | |||||||||||||||||||||||||||||||||||||||||
Dataset | |||||||||||||||||||||||||||||||||||||||||
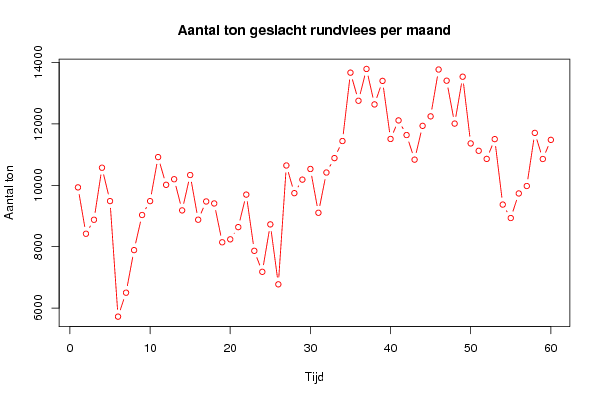
| Dataseries X: | |||||||||||||||||||||||||||||||||||||||||
9932 8421 8877 10572 9486 5721 6501 7889 9032 9485 10918 10015 10197 9182 10334 8878 9473 9408 8143 8240 8637 9696 7865 7181 8726 6774 10645 9743 10184 10531 9105 10415 10885 11441 13668 12753 13789 12634 13400 11509 12113 11636 10835 11936 12245 13770 13406 12009 13536 11363 11123 10859 11503 9371 8933 9734 9976 11706 10856 11479 | |||||||||||||||||||||||||||||||||||||||||
Tables (Output of Computation) | |||||||||||||||||||||||||||||||||||||||||
| |||||||||||||||||||||||||||||||||||||||||
Figures (Output of Computation) | |||||||||||||||||||||||||||||||||||||||||
Input Parameters & R Code | |||||||||||||||||||||||||||||||||||||||||
| Parameters (Session): | |||||||||||||||||||||||||||||||||||||||||
| par1 = Aantal ton geslacht rundvlees per maand ; par2 = Eurostat ; par3 = Aantal ton geslacht rundvlees per maand ; | |||||||||||||||||||||||||||||||||||||||||
| Parameters (R input): | |||||||||||||||||||||||||||||||||||||||||
| par1 = Aantal ton geslacht rundvlees per maand ; par2 = Eurostat ; par3 = Aantal ton geslacht rundvlees per maand ; | |||||||||||||||||||||||||||||||||||||||||
| R code (references can be found in the software module): | |||||||||||||||||||||||||||||||||||||||||
bitmap(file='test1.png') | |||||||||||||||||||||||||||||||||||||||||