Free Statistics

of Irreproducible Research!

Author's title

Author*The author of this computation has been verified*
R Software Modulerwasp_autocorrelation.wasp
Title produced by software(Partial) Autocorrelation Function
Date of computationSun, 20 Dec 2009 13:33:54 -0700
Cite this page as followsStatistical Computations at FreeStatistics.org, Office for Research Development and Education, URL https://freestatistics.org/blog/index.php?v=date/2009/Dec/20/t12613412901kwdfujtk9ho5yk.htm/, Retrieved Sat, 27 Apr 2024 13:04:18 +0000
Statistical Computations at FreeStatistics.org, Office for Research Development and Education, URL https://freestatistics.org/blog/index.php?pk=70017, Retrieved Sat, 27 Apr 2024 13:04:18 +0000
QR Codes:

Original text written by user:
IsPrivate?No (this computation is public)
User-defined keywords
Estimated Impact141
Family? (F = Feedback message, R = changed R code, M = changed R Module, P = changed Parameters, D = changed Data)
-     [(Partial) Autocorrelation Function] [Toon Wouters] [2008-12-10 10:46:51] [6610d6fd8f463fb18a844c14dc2c3579]
- RMP     [(Partial) Autocorrelation Function] [Sören Van Donink ...] [2009-12-20 20:33:54] [56eb6eb137e5652a8f2309d1e9c805c5] [Current]
Feedback Forum

Post a new message
Dataseries X:
467
460
448
443
436
431
484
510
513
503
471
471
476
475
470
461
455
456
517
525
523
519
509
512
519
517
510
509
501
507
569
580
578
565
547
555
562
561
555
544
537
543
594
611
613
611
594
595
591
589
584
573
567
569
621
629
628
612
595
597
593
590
580
574
573
573
620
626
620
588
566
557
561
549
532
526
511
499
555
565
542
527
510
514


Summary of computational transaction
Raw Inputview raw input (R code)
Raw Outputview raw output of R engine
Computing time12 seconds
R Server'Gwilym Jenkins' @ 72.249.127.135

\begin{tabular}{lllllllll}
\hline
Summary of computational transaction \tabularnewline
Raw Input & view raw input (R code)  \tabularnewline
Raw Output & view raw output of R engine  \tabularnewline
Computing time & 12 seconds \tabularnewline
R Server & 'Gwilym Jenkins' @ 72.249.127.135 \tabularnewline
\hline
\end{tabular}
%Source: https://freestatistics.org/blog/index.php?pk=70017&T=0

[TABLE]
[ROW][C]Summary of computational transaction[/C][/ROW]
[ROW][C]Raw Input[/C][C]view raw input (R code) [/C][/ROW]
[ROW][C]Raw Output[/C][C]view raw output of R engine [/C][/ROW]
[ROW][C]Computing time[/C][C]12 seconds[/C][/ROW]
[ROW][C]R Server[/C][C]'Gwilym Jenkins' @ 72.249.127.135[/C][/ROW]
[/TABLE]
Source: https://freestatistics.org/blog/index.php?pk=70017&T=0

Globally Unique Identifier (entire table): ba.freestatistics.org/blog/index.php?pk=70017&T=0

As an alternative you can also use a QR Code:  

The GUIDs for individual cells are displayed in the table below:

Summary of computational transaction
Raw Inputview raw input (R code)
Raw Outputview raw output of R engine
Computing time12 seconds
R Server'Gwilym Jenkins' @ 72.249.127.135


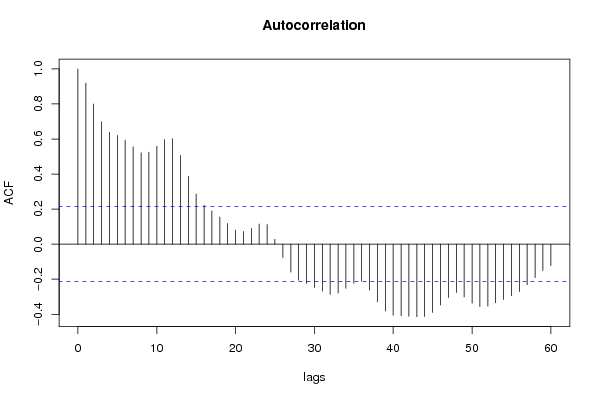
Autocorrelation Function
Time lag kACF(k)T-STATP-value
10.9187018.420
20.799337.3260
30.6983316.40030
40.638545.85230
50.6204885.68690
60.593775.4420
70.5559165.09511e-06
80.5215234.77984e-06
90.5248274.81013e-06
100.5587115.12071e-06
110.5962185.46440
120.6016895.51460
130.506294.64026e-06
140.3870023.54690.00032
150.2863172.62410.005158
160.2224422.03870.022311
170.1905981.74690.042158
180.1545891.41680.080115
190.1178071.07970.141678
200.0797130.73060.233535
210.0720310.66020.255474
220.0900920.82570.205655
230.1146671.05090.148149
240.1117981.02460.154237
250.0277030.25390.400096
26-0.07578-0.69450.244631
27-0.158893-1.45630.074522
28-0.205364-1.88220.031636
29-0.224743-2.05980.021256
30-0.247755-2.27070.012862
31-0.267663-2.45320.008114
32-0.286384-2.62480.00515
33-0.278916-2.55630.006189
34-0.251862-2.30840.011718
35-0.222553-2.03970.02226
36-0.210261-1.92710.028676
37-0.261555-2.39720.00937
38-0.328864-3.01410.001704
39-0.380638-3.48860.000388
40-0.405834-3.71950.00018
41-0.408749-3.74620.000164
42-0.411976-3.77580.000148
43-0.413595-3.79070.000141
44-0.413239-3.78740.000143
45-0.389475-3.56960.000297
46-0.34773-3.1870.00101
47-0.304654-2.79220.00324
48-0.275836-2.52810.00667
49-0.300994-2.75870.003561
50-0.33686-3.08740.001368
51-0.356039-3.26320.000797
52-0.353454-3.23950.000858
53-0.334653-3.06710.001454
54-0.3156-2.89250.002433
55-0.294082-2.69530.004246
56-0.270688-2.48090.00755
57-0.232114-2.12740.018161
58-0.190503-1.7460.042234
59-0.150796-1.38210.085308
60-0.121749-1.11580.133834

\begin{tabular}{lllllllll}
\hline
Autocorrelation Function \tabularnewline
Time lag k & ACF(k) & T-STAT & P-value \tabularnewline
1 & 0.918701 & 8.42 & 0 \tabularnewline
2 & 0.79933 & 7.326 & 0 \tabularnewline
3 & 0.698331 & 6.4003 & 0 \tabularnewline
4 & 0.63854 & 5.8523 & 0 \tabularnewline
5 & 0.620488 & 5.6869 & 0 \tabularnewline
6 & 0.59377 & 5.442 & 0 \tabularnewline
7 & 0.555916 & 5.0951 & 1e-06 \tabularnewline
8 & 0.521523 & 4.7798 & 4e-06 \tabularnewline
9 & 0.524827 & 4.8101 & 3e-06 \tabularnewline
10 & 0.558711 & 5.1207 & 1e-06 \tabularnewline
11 & 0.596218 & 5.4644 & 0 \tabularnewline
12 & 0.601689 & 5.5146 & 0 \tabularnewline
13 & 0.50629 & 4.6402 & 6e-06 \tabularnewline
14 & 0.387002 & 3.5469 & 0.00032 \tabularnewline
15 & 0.286317 & 2.6241 & 0.005158 \tabularnewline
16 & 0.222442 & 2.0387 & 0.022311 \tabularnewline
17 & 0.190598 & 1.7469 & 0.042158 \tabularnewline
18 & 0.154589 & 1.4168 & 0.080115 \tabularnewline
19 & 0.117807 & 1.0797 & 0.141678 \tabularnewline
20 & 0.079713 & 0.7306 & 0.233535 \tabularnewline
21 & 0.072031 & 0.6602 & 0.255474 \tabularnewline
22 & 0.090092 & 0.8257 & 0.205655 \tabularnewline
23 & 0.114667 & 1.0509 & 0.148149 \tabularnewline
24 & 0.111798 & 1.0246 & 0.154237 \tabularnewline
25 & 0.027703 & 0.2539 & 0.400096 \tabularnewline
26 & -0.07578 & -0.6945 & 0.244631 \tabularnewline
27 & -0.158893 & -1.4563 & 0.074522 \tabularnewline
28 & -0.205364 & -1.8822 & 0.031636 \tabularnewline
29 & -0.224743 & -2.0598 & 0.021256 \tabularnewline
30 & -0.247755 & -2.2707 & 0.012862 \tabularnewline
31 & -0.267663 & -2.4532 & 0.008114 \tabularnewline
32 & -0.286384 & -2.6248 & 0.00515 \tabularnewline
33 & -0.278916 & -2.5563 & 0.006189 \tabularnewline
34 & -0.251862 & -2.3084 & 0.011718 \tabularnewline
35 & -0.222553 & -2.0397 & 0.02226 \tabularnewline
36 & -0.210261 & -1.9271 & 0.028676 \tabularnewline
37 & -0.261555 & -2.3972 & 0.00937 \tabularnewline
38 & -0.328864 & -3.0141 & 0.001704 \tabularnewline
39 & -0.380638 & -3.4886 & 0.000388 \tabularnewline
40 & -0.405834 & -3.7195 & 0.00018 \tabularnewline
41 & -0.408749 & -3.7462 & 0.000164 \tabularnewline
42 & -0.411976 & -3.7758 & 0.000148 \tabularnewline
43 & -0.413595 & -3.7907 & 0.000141 \tabularnewline
44 & -0.413239 & -3.7874 & 0.000143 \tabularnewline
45 & -0.389475 & -3.5696 & 0.000297 \tabularnewline
46 & -0.34773 & -3.187 & 0.00101 \tabularnewline
47 & -0.304654 & -2.7922 & 0.00324 \tabularnewline
48 & -0.275836 & -2.5281 & 0.00667 \tabularnewline
49 & -0.300994 & -2.7587 & 0.003561 \tabularnewline
50 & -0.33686 & -3.0874 & 0.001368 \tabularnewline
51 & -0.356039 & -3.2632 & 0.000797 \tabularnewline
52 & -0.353454 & -3.2395 & 0.000858 \tabularnewline
53 & -0.334653 & -3.0671 & 0.001454 \tabularnewline
54 & -0.3156 & -2.8925 & 0.002433 \tabularnewline
55 & -0.294082 & -2.6953 & 0.004246 \tabularnewline
56 & -0.270688 & -2.4809 & 0.00755 \tabularnewline
57 & -0.232114 & -2.1274 & 0.018161 \tabularnewline
58 & -0.190503 & -1.746 & 0.042234 \tabularnewline
59 & -0.150796 & -1.3821 & 0.085308 \tabularnewline
60 & -0.121749 & -1.1158 & 0.133834 \tabularnewline
\hline
\end{tabular}
%Source: https://freestatistics.org/blog/index.php?pk=70017&T=1

[TABLE]
[ROW][C]Autocorrelation Function[/C][/ROW]
[ROW][C]Time lag k[/C][C]ACF(k)[/C][C]T-STAT[/C][C]P-value[/C][/ROW]
[ROW][C]1[/C][C]0.918701[/C][C]8.42[/C][C]0[/C][/ROW]
[ROW][C]2[/C][C]0.79933[/C][C]7.326[/C][C]0[/C][/ROW]
[ROW][C]3[/C][C]0.698331[/C][C]6.4003[/C][C]0[/C][/ROW]
[ROW][C]4[/C][C]0.63854[/C][C]5.8523[/C][C]0[/C][/ROW]
[ROW][C]5[/C][C]0.620488[/C][C]5.6869[/C][C]0[/C][/ROW]
[ROW][C]6[/C][C]0.59377[/C][C]5.442[/C][C]0[/C][/ROW]
[ROW][C]7[/C][C]0.555916[/C][C]5.0951[/C][C]1e-06[/C][/ROW]
[ROW][C]8[/C][C]0.521523[/C][C]4.7798[/C][C]4e-06[/C][/ROW]
[ROW][C]9[/C][C]0.524827[/C][C]4.8101[/C][C]3e-06[/C][/ROW]
[ROW][C]10[/C][C]0.558711[/C][C]5.1207[/C][C]1e-06[/C][/ROW]
[ROW][C]11[/C][C]0.596218[/C][C]5.4644[/C][C]0[/C][/ROW]
[ROW][C]12[/C][C]0.601689[/C][C]5.5146[/C][C]0[/C][/ROW]
[ROW][C]13[/C][C]0.50629[/C][C]4.6402[/C][C]6e-06[/C][/ROW]
[ROW][C]14[/C][C]0.387002[/C][C]3.5469[/C][C]0.00032[/C][/ROW]
[ROW][C]15[/C][C]0.286317[/C][C]2.6241[/C][C]0.005158[/C][/ROW]
[ROW][C]16[/C][C]0.222442[/C][C]2.0387[/C][C]0.022311[/C][/ROW]
[ROW][C]17[/C][C]0.190598[/C][C]1.7469[/C][C]0.042158[/C][/ROW]
[ROW][C]18[/C][C]0.154589[/C][C]1.4168[/C][C]0.080115[/C][/ROW]
[ROW][C]19[/C][C]0.117807[/C][C]1.0797[/C][C]0.141678[/C][/ROW]
[ROW][C]20[/C][C]0.079713[/C][C]0.7306[/C][C]0.233535[/C][/ROW]
[ROW][C]21[/C][C]0.072031[/C][C]0.6602[/C][C]0.255474[/C][/ROW]
[ROW][C]22[/C][C]0.090092[/C][C]0.8257[/C][C]0.205655[/C][/ROW]
[ROW][C]23[/C][C]0.114667[/C][C]1.0509[/C][C]0.148149[/C][/ROW]
[ROW][C]24[/C][C]0.111798[/C][C]1.0246[/C][C]0.154237[/C][/ROW]
[ROW][C]25[/C][C]0.027703[/C][C]0.2539[/C][C]0.400096[/C][/ROW]
[ROW][C]26[/C][C]-0.07578[/C][C]-0.6945[/C][C]0.244631[/C][/ROW]
[ROW][C]27[/C][C]-0.158893[/C][C]-1.4563[/C][C]0.074522[/C][/ROW]
[ROW][C]28[/C][C]-0.205364[/C][C]-1.8822[/C][C]0.031636[/C][/ROW]
[ROW][C]29[/C][C]-0.224743[/C][C]-2.0598[/C][C]0.021256[/C][/ROW]
[ROW][C]30[/C][C]-0.247755[/C][C]-2.2707[/C][C]0.012862[/C][/ROW]
[ROW][C]31[/C][C]-0.267663[/C][C]-2.4532[/C][C]0.008114[/C][/ROW]
[ROW][C]32[/C][C]-0.286384[/C][C]-2.6248[/C][C]0.00515[/C][/ROW]
[ROW][C]33[/C][C]-0.278916[/C][C]-2.5563[/C][C]0.006189[/C][/ROW]
[ROW][C]34[/C][C]-0.251862[/C][C]-2.3084[/C][C]0.011718[/C][/ROW]
[ROW][C]35[/C][C]-0.222553[/C][C]-2.0397[/C][C]0.02226[/C][/ROW]
[ROW][C]36[/C][C]-0.210261[/C][C]-1.9271[/C][C]0.028676[/C][/ROW]
[ROW][C]37[/C][C]-0.261555[/C][C]-2.3972[/C][C]0.00937[/C][/ROW]
[ROW][C]38[/C][C]-0.328864[/C][C]-3.0141[/C][C]0.001704[/C][/ROW]
[ROW][C]39[/C][C]-0.380638[/C][C]-3.4886[/C][C]0.000388[/C][/ROW]
[ROW][C]40[/C][C]-0.405834[/C][C]-3.7195[/C][C]0.00018[/C][/ROW]
[ROW][C]41[/C][C]-0.408749[/C][C]-3.7462[/C][C]0.000164[/C][/ROW]
[ROW][C]42[/C][C]-0.411976[/C][C]-3.7758[/C][C]0.000148[/C][/ROW]
[ROW][C]43[/C][C]-0.413595[/C][C]-3.7907[/C][C]0.000141[/C][/ROW]
[ROW][C]44[/C][C]-0.413239[/C][C]-3.7874[/C][C]0.000143[/C][/ROW]
[ROW][C]45[/C][C]-0.389475[/C][C]-3.5696[/C][C]0.000297[/C][/ROW]
[ROW][C]46[/C][C]-0.34773[/C][C]-3.187[/C][C]0.00101[/C][/ROW]
[ROW][C]47[/C][C]-0.304654[/C][C]-2.7922[/C][C]0.00324[/C][/ROW]
[ROW][C]48[/C][C]-0.275836[/C][C]-2.5281[/C][C]0.00667[/C][/ROW]
[ROW][C]49[/C][C]-0.300994[/C][C]-2.7587[/C][C]0.003561[/C][/ROW]
[ROW][C]50[/C][C]-0.33686[/C][C]-3.0874[/C][C]0.001368[/C][/ROW]
[ROW][C]51[/C][C]-0.356039[/C][C]-3.2632[/C][C]0.000797[/C][/ROW]
[ROW][C]52[/C][C]-0.353454[/C][C]-3.2395[/C][C]0.000858[/C][/ROW]
[ROW][C]53[/C][C]-0.334653[/C][C]-3.0671[/C][C]0.001454[/C][/ROW]
[ROW][C]54[/C][C]-0.3156[/C][C]-2.8925[/C][C]0.002433[/C][/ROW]
[ROW][C]55[/C][C]-0.294082[/C][C]-2.6953[/C][C]0.004246[/C][/ROW]
[ROW][C]56[/C][C]-0.270688[/C][C]-2.4809[/C][C]0.00755[/C][/ROW]
[ROW][C]57[/C][C]-0.232114[/C][C]-2.1274[/C][C]0.018161[/C][/ROW]
[ROW][C]58[/C][C]-0.190503[/C][C]-1.746[/C][C]0.042234[/C][/ROW]
[ROW][C]59[/C][C]-0.150796[/C][C]-1.3821[/C][C]0.085308[/C][/ROW]
[ROW][C]60[/C][C]-0.121749[/C][C]-1.1158[/C][C]0.133834[/C][/ROW]
[/TABLE]
Source: https://freestatistics.org/blog/index.php?pk=70017&T=1

Globally Unique Identifier (entire table): ba.freestatistics.org/blog/index.php?pk=70017&T=1

As an alternative you can also use a QR Code:  

The GUIDs for individual cells are displayed in the table below:

Autocorrelation Function
Time lag kACF(k)T-STATP-value
10.9187018.420
20.799337.3260
30.6983316.40030
40.638545.85230
50.6204885.68690
60.593775.4420
70.5559165.09511e-06
80.5215234.77984e-06
90.5248274.81013e-06
100.5587115.12071e-06
110.5962185.46440
120.6016895.51460
130.506294.64026e-06
140.3870023.54690.00032
150.2863172.62410.005158
160.2224422.03870.022311
170.1905981.74690.042158
180.1545891.41680.080115
190.1178071.07970.141678
200.0797130.73060.233535
210.0720310.66020.255474
220.0900920.82570.205655
230.1146671.05090.148149
240.1117981.02460.154237
250.0277030.25390.400096
26-0.07578-0.69450.244631
27-0.158893-1.45630.074522
28-0.205364-1.88220.031636
29-0.224743-2.05980.021256
30-0.247755-2.27070.012862
31-0.267663-2.45320.008114
32-0.286384-2.62480.00515
33-0.278916-2.55630.006189
34-0.251862-2.30840.011718
35-0.222553-2.03970.02226
36-0.210261-1.92710.028676
37-0.261555-2.39720.00937
38-0.328864-3.01410.001704
39-0.380638-3.48860.000388
40-0.405834-3.71950.00018
41-0.408749-3.74620.000164
42-0.411976-3.77580.000148
43-0.413595-3.79070.000141
44-0.413239-3.78740.000143
45-0.389475-3.56960.000297
46-0.34773-3.1870.00101
47-0.304654-2.79220.00324
48-0.275836-2.52810.00667
49-0.300994-2.75870.003561
50-0.33686-3.08740.001368
51-0.356039-3.26320.000797
52-0.353454-3.23950.000858
53-0.334653-3.06710.001454
54-0.3156-2.89250.002433
55-0.294082-2.69530.004246
56-0.270688-2.48090.00755
57-0.232114-2.12740.018161
58-0.190503-1.7460.042234
59-0.150796-1.38210.085308
60-0.121749-1.11580.133834


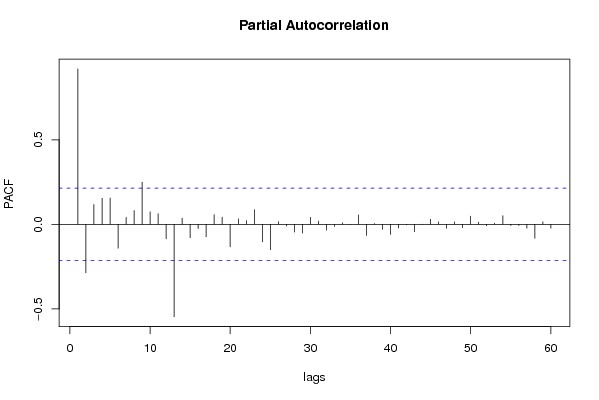
Partial Autocorrelation Function
Time lag kPACF(k)T-STATP-value
10.9187018.420
2-0.286444-2.62530.005142
30.1172731.07480.142766
40.1541271.41260.080735
50.1551851.42230.079322
6-0.141132-1.29350.099693
70.0408340.37430.35458
80.0817420.74920.227921
90.2489972.28210.012506
100.0738640.6770.250142
110.0632980.58010.281688
12-0.08525-0.78130.218402
13-0.545623-5.00072e-06
140.0368090.33740.368344
15-0.078973-0.72380.235601
16-0.025202-0.2310.408945
17-0.072786-0.66710.253269
180.057140.52370.300934
190.0426820.39120.348324
20-0.132473-1.21410.114049
210.0324140.29710.383568
220.021670.19860.421525
230.0865990.79370.214805
24-0.10305-0.94450.17382
25-0.149609-1.37120.086984
260.0149070.13660.445826
27-0.00943-0.08640.465667
28-0.045849-0.42020.337701
29-0.051259-0.46980.319859
300.041560.38090.352118
310.0191320.17530.430613
32-0.033852-0.31030.378567
33-0.012204-0.11190.455602
340.0090820.08320.466932
350.0001040.0010.499621
360.0556050.50960.305826
37-0.065848-0.60350.273899
380.0045430.04160.483443
39-0.029675-0.2720.393154
40-0.059486-0.54520.29353
41-0.021421-0.19630.422415
42-0.002766-0.02540.489917
43-0.043122-0.39520.346841
440.0009620.00880.496495
450.0295250.27060.393679
460.0140230.12850.449021
47-0.022456-0.20580.418717
480.0142230.13040.448297
49-0.019933-0.18270.42774
500.0483240.44290.329488
510.0129070.11830.453059
52-0.008786-0.08050.468007
530.0069840.0640.474556
540.050970.46710.320803
55-0.006268-0.05740.477162
56-0.006166-0.05650.477534
57-0.022322-0.20460.419195
58-0.082846-0.75930.224902
590.0149510.1370.445667
60-0.023052-0.21130.416593

\begin{tabular}{lllllllll}
\hline
Partial Autocorrelation Function \tabularnewline
Time lag k & PACF(k) & T-STAT & P-value \tabularnewline
1 & 0.918701 & 8.42 & 0 \tabularnewline
2 & -0.286444 & -2.6253 & 0.005142 \tabularnewline
3 & 0.117273 & 1.0748 & 0.142766 \tabularnewline
4 & 0.154127 & 1.4126 & 0.080735 \tabularnewline
5 & 0.155185 & 1.4223 & 0.079322 \tabularnewline
6 & -0.141132 & -1.2935 & 0.099693 \tabularnewline
7 & 0.040834 & 0.3743 & 0.35458 \tabularnewline
8 & 0.081742 & 0.7492 & 0.227921 \tabularnewline
9 & 0.248997 & 2.2821 & 0.012506 \tabularnewline
10 & 0.073864 & 0.677 & 0.250142 \tabularnewline
11 & 0.063298 & 0.5801 & 0.281688 \tabularnewline
12 & -0.08525 & -0.7813 & 0.218402 \tabularnewline
13 & -0.545623 & -5.0007 & 2e-06 \tabularnewline
14 & 0.036809 & 0.3374 & 0.368344 \tabularnewline
15 & -0.078973 & -0.7238 & 0.235601 \tabularnewline
16 & -0.025202 & -0.231 & 0.408945 \tabularnewline
17 & -0.072786 & -0.6671 & 0.253269 \tabularnewline
18 & 0.05714 & 0.5237 & 0.300934 \tabularnewline
19 & 0.042682 & 0.3912 & 0.348324 \tabularnewline
20 & -0.132473 & -1.2141 & 0.114049 \tabularnewline
21 & 0.032414 & 0.2971 & 0.383568 \tabularnewline
22 & 0.02167 & 0.1986 & 0.421525 \tabularnewline
23 & 0.086599 & 0.7937 & 0.214805 \tabularnewline
24 & -0.10305 & -0.9445 & 0.17382 \tabularnewline
25 & -0.149609 & -1.3712 & 0.086984 \tabularnewline
26 & 0.014907 & 0.1366 & 0.445826 \tabularnewline
27 & -0.00943 & -0.0864 & 0.465667 \tabularnewline
28 & -0.045849 & -0.4202 & 0.337701 \tabularnewline
29 & -0.051259 & -0.4698 & 0.319859 \tabularnewline
30 & 0.04156 & 0.3809 & 0.352118 \tabularnewline
31 & 0.019132 & 0.1753 & 0.430613 \tabularnewline
32 & -0.033852 & -0.3103 & 0.378567 \tabularnewline
33 & -0.012204 & -0.1119 & 0.455602 \tabularnewline
34 & 0.009082 & 0.0832 & 0.466932 \tabularnewline
35 & 0.000104 & 0.001 & 0.499621 \tabularnewline
36 & 0.055605 & 0.5096 & 0.305826 \tabularnewline
37 & -0.065848 & -0.6035 & 0.273899 \tabularnewline
38 & 0.004543 & 0.0416 & 0.483443 \tabularnewline
39 & -0.029675 & -0.272 & 0.393154 \tabularnewline
40 & -0.059486 & -0.5452 & 0.29353 \tabularnewline
41 & -0.021421 & -0.1963 & 0.422415 \tabularnewline
42 & -0.002766 & -0.0254 & 0.489917 \tabularnewline
43 & -0.043122 & -0.3952 & 0.346841 \tabularnewline
44 & 0.000962 & 0.0088 & 0.496495 \tabularnewline
45 & 0.029525 & 0.2706 & 0.393679 \tabularnewline
46 & 0.014023 & 0.1285 & 0.449021 \tabularnewline
47 & -0.022456 & -0.2058 & 0.418717 \tabularnewline
48 & 0.014223 & 0.1304 & 0.448297 \tabularnewline
49 & -0.019933 & -0.1827 & 0.42774 \tabularnewline
50 & 0.048324 & 0.4429 & 0.329488 \tabularnewline
51 & 0.012907 & 0.1183 & 0.453059 \tabularnewline
52 & -0.008786 & -0.0805 & 0.468007 \tabularnewline
53 & 0.006984 & 0.064 & 0.474556 \tabularnewline
54 & 0.05097 & 0.4671 & 0.320803 \tabularnewline
55 & -0.006268 & -0.0574 & 0.477162 \tabularnewline
56 & -0.006166 & -0.0565 & 0.477534 \tabularnewline
57 & -0.022322 & -0.2046 & 0.419195 \tabularnewline
58 & -0.082846 & -0.7593 & 0.224902 \tabularnewline
59 & 0.014951 & 0.137 & 0.445667 \tabularnewline
60 & -0.023052 & -0.2113 & 0.416593 \tabularnewline
\hline
\end{tabular}
%Source: https://freestatistics.org/blog/index.php?pk=70017&T=2

[TABLE]
[ROW][C]Partial Autocorrelation Function[/C][/ROW]
[ROW][C]Time lag k[/C][C]PACF(k)[/C][C]T-STAT[/C][C]P-value[/C][/ROW]
[ROW][C]1[/C][C]0.918701[/C][C]8.42[/C][C]0[/C][/ROW]
[ROW][C]2[/C][C]-0.286444[/C][C]-2.6253[/C][C]0.005142[/C][/ROW]
[ROW][C]3[/C][C]0.117273[/C][C]1.0748[/C][C]0.142766[/C][/ROW]
[ROW][C]4[/C][C]0.154127[/C][C]1.4126[/C][C]0.080735[/C][/ROW]
[ROW][C]5[/C][C]0.155185[/C][C]1.4223[/C][C]0.079322[/C][/ROW]
[ROW][C]6[/C][C]-0.141132[/C][C]-1.2935[/C][C]0.099693[/C][/ROW]
[ROW][C]7[/C][C]0.040834[/C][C]0.3743[/C][C]0.35458[/C][/ROW]
[ROW][C]8[/C][C]0.081742[/C][C]0.7492[/C][C]0.227921[/C][/ROW]
[ROW][C]9[/C][C]0.248997[/C][C]2.2821[/C][C]0.012506[/C][/ROW]
[ROW][C]10[/C][C]0.073864[/C][C]0.677[/C][C]0.250142[/C][/ROW]
[ROW][C]11[/C][C]0.063298[/C][C]0.5801[/C][C]0.281688[/C][/ROW]
[ROW][C]12[/C][C]-0.08525[/C][C]-0.7813[/C][C]0.218402[/C][/ROW]
[ROW][C]13[/C][C]-0.545623[/C][C]-5.0007[/C][C]2e-06[/C][/ROW]
[ROW][C]14[/C][C]0.036809[/C][C]0.3374[/C][C]0.368344[/C][/ROW]
[ROW][C]15[/C][C]-0.078973[/C][C]-0.7238[/C][C]0.235601[/C][/ROW]
[ROW][C]16[/C][C]-0.025202[/C][C]-0.231[/C][C]0.408945[/C][/ROW]
[ROW][C]17[/C][C]-0.072786[/C][C]-0.6671[/C][C]0.253269[/C][/ROW]
[ROW][C]18[/C][C]0.05714[/C][C]0.5237[/C][C]0.300934[/C][/ROW]
[ROW][C]19[/C][C]0.042682[/C][C]0.3912[/C][C]0.348324[/C][/ROW]
[ROW][C]20[/C][C]-0.132473[/C][C]-1.2141[/C][C]0.114049[/C][/ROW]
[ROW][C]21[/C][C]0.032414[/C][C]0.2971[/C][C]0.383568[/C][/ROW]
[ROW][C]22[/C][C]0.02167[/C][C]0.1986[/C][C]0.421525[/C][/ROW]
[ROW][C]23[/C][C]0.086599[/C][C]0.7937[/C][C]0.214805[/C][/ROW]
[ROW][C]24[/C][C]-0.10305[/C][C]-0.9445[/C][C]0.17382[/C][/ROW]
[ROW][C]25[/C][C]-0.149609[/C][C]-1.3712[/C][C]0.086984[/C][/ROW]
[ROW][C]26[/C][C]0.014907[/C][C]0.1366[/C][C]0.445826[/C][/ROW]
[ROW][C]27[/C][C]-0.00943[/C][C]-0.0864[/C][C]0.465667[/C][/ROW]
[ROW][C]28[/C][C]-0.045849[/C][C]-0.4202[/C][C]0.337701[/C][/ROW]
[ROW][C]29[/C][C]-0.051259[/C][C]-0.4698[/C][C]0.319859[/C][/ROW]
[ROW][C]30[/C][C]0.04156[/C][C]0.3809[/C][C]0.352118[/C][/ROW]
[ROW][C]31[/C][C]0.019132[/C][C]0.1753[/C][C]0.430613[/C][/ROW]
[ROW][C]32[/C][C]-0.033852[/C][C]-0.3103[/C][C]0.378567[/C][/ROW]
[ROW][C]33[/C][C]-0.012204[/C][C]-0.1119[/C][C]0.455602[/C][/ROW]
[ROW][C]34[/C][C]0.009082[/C][C]0.0832[/C][C]0.466932[/C][/ROW]
[ROW][C]35[/C][C]0.000104[/C][C]0.001[/C][C]0.499621[/C][/ROW]
[ROW][C]36[/C][C]0.055605[/C][C]0.5096[/C][C]0.305826[/C][/ROW]
[ROW][C]37[/C][C]-0.065848[/C][C]-0.6035[/C][C]0.273899[/C][/ROW]
[ROW][C]38[/C][C]0.004543[/C][C]0.0416[/C][C]0.483443[/C][/ROW]
[ROW][C]39[/C][C]-0.029675[/C][C]-0.272[/C][C]0.393154[/C][/ROW]
[ROW][C]40[/C][C]-0.059486[/C][C]-0.5452[/C][C]0.29353[/C][/ROW]
[ROW][C]41[/C][C]-0.021421[/C][C]-0.1963[/C][C]0.422415[/C][/ROW]
[ROW][C]42[/C][C]-0.002766[/C][C]-0.0254[/C][C]0.489917[/C][/ROW]
[ROW][C]43[/C][C]-0.043122[/C][C]-0.3952[/C][C]0.346841[/C][/ROW]
[ROW][C]44[/C][C]0.000962[/C][C]0.0088[/C][C]0.496495[/C][/ROW]
[ROW][C]45[/C][C]0.029525[/C][C]0.2706[/C][C]0.393679[/C][/ROW]
[ROW][C]46[/C][C]0.014023[/C][C]0.1285[/C][C]0.449021[/C][/ROW]
[ROW][C]47[/C][C]-0.022456[/C][C]-0.2058[/C][C]0.418717[/C][/ROW]
[ROW][C]48[/C][C]0.014223[/C][C]0.1304[/C][C]0.448297[/C][/ROW]
[ROW][C]49[/C][C]-0.019933[/C][C]-0.1827[/C][C]0.42774[/C][/ROW]
[ROW][C]50[/C][C]0.048324[/C][C]0.4429[/C][C]0.329488[/C][/ROW]
[ROW][C]51[/C][C]0.012907[/C][C]0.1183[/C][C]0.453059[/C][/ROW]
[ROW][C]52[/C][C]-0.008786[/C][C]-0.0805[/C][C]0.468007[/C][/ROW]
[ROW][C]53[/C][C]0.006984[/C][C]0.064[/C][C]0.474556[/C][/ROW]
[ROW][C]54[/C][C]0.05097[/C][C]0.4671[/C][C]0.320803[/C][/ROW]
[ROW][C]55[/C][C]-0.006268[/C][C]-0.0574[/C][C]0.477162[/C][/ROW]
[ROW][C]56[/C][C]-0.006166[/C][C]-0.0565[/C][C]0.477534[/C][/ROW]
[ROW][C]57[/C][C]-0.022322[/C][C]-0.2046[/C][C]0.419195[/C][/ROW]
[ROW][C]58[/C][C]-0.082846[/C][C]-0.7593[/C][C]0.224902[/C][/ROW]
[ROW][C]59[/C][C]0.014951[/C][C]0.137[/C][C]0.445667[/C][/ROW]
[ROW][C]60[/C][C]-0.023052[/C][C]-0.2113[/C][C]0.416593[/C][/ROW]
[/TABLE]
Source: https://freestatistics.org/blog/index.php?pk=70017&T=2

Globally Unique Identifier (entire table): ba.freestatistics.org/blog/index.php?pk=70017&T=2

As an alternative you can also use a QR Code:  

The GUIDs for individual cells are displayed in the table below:

Partial Autocorrelation Function
Time lag kPACF(k)T-STATP-value
10.9187018.420
2-0.286444-2.62530.005142
30.1172731.07480.142766
40.1541271.41260.080735
50.1551851.42230.079322
6-0.141132-1.29350.099693
70.0408340.37430.35458
80.0817420.74920.227921
90.2489972.28210.012506
100.0738640.6770.250142
110.0632980.58010.281688
12-0.08525-0.78130.218402
13-0.545623-5.00072e-06
140.0368090.33740.368344
15-0.078973-0.72380.235601
16-0.025202-0.2310.408945
17-0.072786-0.66710.253269
180.057140.52370.300934
190.0426820.39120.348324
20-0.132473-1.21410.114049
210.0324140.29710.383568
220.021670.19860.421525
230.0865990.79370.214805
24-0.10305-0.94450.17382
25-0.149609-1.37120.086984
260.0149070.13660.445826
27-0.00943-0.08640.465667
28-0.045849-0.42020.337701
29-0.051259-0.46980.319859
300.041560.38090.352118
310.0191320.17530.430613
32-0.033852-0.31030.378567
33-0.012204-0.11190.455602
340.0090820.08320.466932
350.0001040.0010.499621
360.0556050.50960.305826
37-0.065848-0.60350.273899
380.0045430.04160.483443
39-0.029675-0.2720.393154
40-0.059486-0.54520.29353
41-0.021421-0.19630.422415
42-0.002766-0.02540.489917
43-0.043122-0.39520.346841
440.0009620.00880.496495
450.0295250.27060.393679
460.0140230.12850.449021
47-0.022456-0.20580.418717
480.0142230.13040.448297
49-0.019933-0.18270.42774
500.0483240.44290.329488
510.0129070.11830.453059
52-0.008786-0.08050.468007
530.0069840.0640.474556
540.050970.46710.320803
55-0.006268-0.05740.477162
56-0.006166-0.05650.477534
57-0.022322-0.20460.419195
58-0.082846-0.75930.224902
590.0149510.1370.445667
60-0.023052-0.21130.416593


Parameters (Session):
par1 = 60 ; par2 = 1 ; par3 = 0 ; par4 = 0 ; par5 = 12 ; par6 = White Noise ;
Parameters (R input):
par1 = 60 ; par2 = 1 ; par3 = 0 ; par4 = 0 ; par5 = 12 ; par6 = White Noise ; par7 = ;
R code (references can be found in the software module):
if (par1 == 'Default') {
par1 = 10*log10(length(x))
} else {
par1 <- as.numeric(par1)
}
par2 <- as.numeric(par2)
par3 <- as.numeric(par3)
par4 <- as.numeric(par4)
par5 <- as.numeric(par5)
if (par2 == 0) {
x <- log(x)
} else {
x <- (x ^ par2 - 1) / par2
}
if (par3 > 0) x <- diff(x,lag=1,difference=par3)
if (par4 > 0) x <- diff(x,lag=par5,difference=par4)
bitmap(file='pic1.png')
racf <- acf(x,par1,main='Autocorrelation',xlab='lags',ylab='ACF')
dev.off()
bitmap(file='pic2.png')
rpacf <- pacf(x,par1,main='Partial Autocorrelation',xlab='lags',ylab='PACF')
dev.off()
(myacf <- c(racf$acf))
(mypacf <- c(rpacf$acf))
lengthx <- length(x)
sqrtn <- sqrt(lengthx)
load(file='createtable')
a<-table.start()
a<-table.row.start(a)
a<-table.element(a,'Autocorrelation Function',4,TRUE)
a<-table.row.end(a)
a<-table.row.start(a)
a<-table.element(a,'Time lag k',header=TRUE)
a<-table.element(a,hyperlink('basics.htm','ACF(k)','click here for more information about the Autocorrelation Function'),header=TRUE)
a<-table.element(a,'T-STAT',header=TRUE)
a<-table.element(a,'P-value',header=TRUE)
a<-table.row.end(a)
for (i in 2:(par1+1)) {
a<-table.row.start(a)
a<-table.element(a,i-1,header=TRUE)
a<-table.element(a,round(myacf[i],6))
mytstat <- myacf[i]*sqrtn
a<-table.element(a,round(mytstat,4))
a<-table.element(a,round(1-pt(abs(mytstat),lengthx),6))
a<-table.row.end(a)
}
a<-table.end(a)
table.save(a,file='mytable.tab')
a<-table.start()
a<-table.row.start(a)
a<-table.element(a,'Partial Autocorrelation Function',4,TRUE)
a<-table.row.end(a)
a<-table.row.start(a)
a<-table.element(a,'Time lag k',header=TRUE)
a<-table.element(a,hyperlink('basics.htm','PACF(k)','click here for more information about the Partial Autocorrelation Function'),header=TRUE)
a<-table.element(a,'T-STAT',header=TRUE)
a<-table.element(a,'P-value',header=TRUE)
a<-table.row.end(a)
for (i in 1:par1) {
a<-table.row.start(a)
a<-table.element(a,i,header=TRUE)
a<-table.element(a,round(mypacf[i],6))
mytstat <- mypacf[i]*sqrtn
a<-table.element(a,round(mytstat,4))
a<-table.element(a,round(1-pt(abs(mytstat),lengthx),6))
a<-table.row.end(a)
}
a<-table.end(a)
table.save(a,file='mytable1.tab')