Free Statistics

of Irreproducible Research!

Author's title

Author*The author of this computation has been verified*
R Software Modulerwasp_autocorrelation.wasp
Title produced by software(Partial) Autocorrelation Function
Date of computationSun, 20 Dec 2009 13:56:40 -0700
Cite this page as followsStatistical Computations at FreeStatistics.org, Office for Research Development and Education, URL https://freestatistics.org/blog/index.php?v=date/2009/Dec/20/t1261342662v9gr64m58ohxevh.htm/, Retrieved Sat, 27 Apr 2024 05:48:01 +0000
Statistical Computations at FreeStatistics.org, Office for Research Development and Education, URL https://freestatistics.org/blog/index.php?pk=70024, Retrieved Sat, 27 Apr 2024 05:48:01 +0000
QR Codes:

Original text written by user:
IsPrivate?No (this computation is public)
User-defined keywords
Estimated Impact129
Family? (F = Feedback message, R = changed R code, M = changed R Module, P = changed Parameters, D = changed Data)
-     [(Partial) Autocorrelation Function] [Paper TW] [2008-12-10 10:48:35] [6610d6fd8f463fb18a844c14dc2c3579]
- RMP     [(Partial) Autocorrelation Function] [svd] [2009-12-20 20:56:40] [56eb6eb137e5652a8f2309d1e9c805c5] [Current]
Feedback Forum

Post a new message
Dataseries X:
467
460
448
443
436
431
484
510
513
503
471
471
476
475
470
461
455
456
517
525
523
519
509
512
519
517
510
509
501
507
569
580
578
565
547
555
562
561
555
544
537
543
594
611
613
611
594
595
591
589
584
573
567
569
621
629
628
612
595
597
593
590
580
574
573
573
620
626
620
588
566
557
561
549
532
526
511
499
555
565
542
527
510
514


Summary of computational transaction
Raw Inputview raw input (R code)
Raw Outputview raw output of R engine
Computing time1 seconds
R Server'Gwilym Jenkins' @ 72.249.127.135

\begin{tabular}{lllllllll}
\hline
Summary of computational transaction \tabularnewline
Raw Input & view raw input (R code)  \tabularnewline
Raw Output & view raw output of R engine  \tabularnewline
Computing time & 1 seconds \tabularnewline
R Server & 'Gwilym Jenkins' @ 72.249.127.135 \tabularnewline
\hline
\end{tabular}
%Source: https://freestatistics.org/blog/index.php?pk=70024&T=0

[TABLE]
[ROW][C]Summary of computational transaction[/C][/ROW]
[ROW][C]Raw Input[/C][C]view raw input (R code) [/C][/ROW]
[ROW][C]Raw Output[/C][C]view raw output of R engine [/C][/ROW]
[ROW][C]Computing time[/C][C]1 seconds[/C][/ROW]
[ROW][C]R Server[/C][C]'Gwilym Jenkins' @ 72.249.127.135[/C][/ROW]
[/TABLE]
Source: https://freestatistics.org/blog/index.php?pk=70024&T=0

Globally Unique Identifier (entire table): ba.freestatistics.org/blog/index.php?pk=70024&T=0

As an alternative you can also use a QR Code:  

The GUIDs for individual cells are displayed in the table below:

Summary of computational transaction
Raw Inputview raw input (R code)
Raw Outputview raw output of R engine
Computing time1 seconds
R Server'Gwilym Jenkins' @ 72.249.127.135


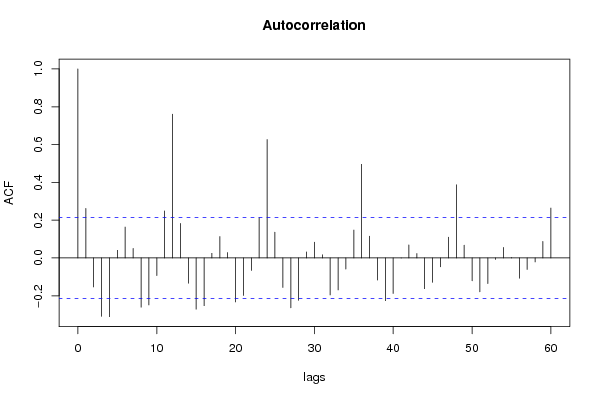
Autocorrelation Function
Time lag kACF(k)T-STATP-value
10.2621572.38840.009596
2-0.152956-1.39350.083596
3-0.308263-2.80840.003103
4-0.310348-2.82740.00294
50.0404670.36870.356654
60.1634041.48870.07018
70.0504070.45920.323634
8-0.260402-2.37240.009993
9-0.248535-2.26430.013083
10-0.092983-0.84710.199683
110.2486752.26550.013042
120.7606096.92950
130.1824711.66240.050104
14-0.133342-1.21480.113943
15-0.270841-2.46750.007831
16-0.252104-2.29680.012075
170.0247210.22520.41118
180.1135371.03440.151984
190.0287390.26180.397053
20-0.232437-2.11760.018601
21-0.198099-1.80480.037369
22-0.066161-0.60280.274157
230.2135431.94550.027552
240.6262685.70560
250.1362041.24090.109074
26-0.156059-1.42180.079421
27-0.26382-2.40350.009233
28-0.224209-2.04260.022131
290.0322330.29370.384875
300.0833450.75930.224909
310.0167470.15260.439551
32-0.195293-1.77920.039434
33-0.16932-1.54260.063369
34-0.058456-0.53260.297881
350.147971.34810.090652
360.4952344.51181e-05
370.1151741.04930.148546
38-0.116695-1.06310.1454
39-0.225954-2.05850.021338
40-0.187673-1.70980.045521
411e-049e-040.499639
420.0687210.62610.266491
430.0231960.21130.416574
44-0.162482-1.48030.071292
45-0.12847-1.17040.122592
46-0.046822-0.42660.335398
470.1100591.00270.159463
480.3868093.5240.000347
490.0677730.61740.269318
50-0.120556-1.09830.13762
51-0.178652-1.62760.053701
52-0.135107-1.23090.110922
53-0.007697-0.07010.472132
540.055630.50680.306816
550.0022710.02070.491773
56-0.106778-0.97280.166741
57-0.060525-0.55140.291417
58-0.020998-0.19130.424378
590.0873570.79590.214193
600.2640742.40580.009179

\begin{tabular}{lllllllll}
\hline
Autocorrelation Function \tabularnewline
Time lag k & ACF(k) & T-STAT & P-value \tabularnewline
1 & 0.262157 & 2.3884 & 0.009596 \tabularnewline
2 & -0.152956 & -1.3935 & 0.083596 \tabularnewline
3 & -0.308263 & -2.8084 & 0.003103 \tabularnewline
4 & -0.310348 & -2.8274 & 0.00294 \tabularnewline
5 & 0.040467 & 0.3687 & 0.356654 \tabularnewline
6 & 0.163404 & 1.4887 & 0.07018 \tabularnewline
7 & 0.050407 & 0.4592 & 0.323634 \tabularnewline
8 & -0.260402 & -2.3724 & 0.009993 \tabularnewline
9 & -0.248535 & -2.2643 & 0.013083 \tabularnewline
10 & -0.092983 & -0.8471 & 0.199683 \tabularnewline
11 & 0.248675 & 2.2655 & 0.013042 \tabularnewline
12 & 0.760609 & 6.9295 & 0 \tabularnewline
13 & 0.182471 & 1.6624 & 0.050104 \tabularnewline
14 & -0.133342 & -1.2148 & 0.113943 \tabularnewline
15 & -0.270841 & -2.4675 & 0.007831 \tabularnewline
16 & -0.252104 & -2.2968 & 0.012075 \tabularnewline
17 & 0.024721 & 0.2252 & 0.41118 \tabularnewline
18 & 0.113537 & 1.0344 & 0.151984 \tabularnewline
19 & 0.028739 & 0.2618 & 0.397053 \tabularnewline
20 & -0.232437 & -2.1176 & 0.018601 \tabularnewline
21 & -0.198099 & -1.8048 & 0.037369 \tabularnewline
22 & -0.066161 & -0.6028 & 0.274157 \tabularnewline
23 & 0.213543 & 1.9455 & 0.027552 \tabularnewline
24 & 0.626268 & 5.7056 & 0 \tabularnewline
25 & 0.136204 & 1.2409 & 0.109074 \tabularnewline
26 & -0.156059 & -1.4218 & 0.079421 \tabularnewline
27 & -0.26382 & -2.4035 & 0.009233 \tabularnewline
28 & -0.224209 & -2.0426 & 0.022131 \tabularnewline
29 & 0.032233 & 0.2937 & 0.384875 \tabularnewline
30 & 0.083345 & 0.7593 & 0.224909 \tabularnewline
31 & 0.016747 & 0.1526 & 0.439551 \tabularnewline
32 & -0.195293 & -1.7792 & 0.039434 \tabularnewline
33 & -0.16932 & -1.5426 & 0.063369 \tabularnewline
34 & -0.058456 & -0.5326 & 0.297881 \tabularnewline
35 & 0.14797 & 1.3481 & 0.090652 \tabularnewline
36 & 0.495234 & 4.5118 & 1e-05 \tabularnewline
37 & 0.115174 & 1.0493 & 0.148546 \tabularnewline
38 & -0.116695 & -1.0631 & 0.1454 \tabularnewline
39 & -0.225954 & -2.0585 & 0.021338 \tabularnewline
40 & -0.187673 & -1.7098 & 0.045521 \tabularnewline
41 & 1e-04 & 9e-04 & 0.499639 \tabularnewline
42 & 0.068721 & 0.6261 & 0.266491 \tabularnewline
43 & 0.023196 & 0.2113 & 0.416574 \tabularnewline
44 & -0.162482 & -1.4803 & 0.071292 \tabularnewline
45 & -0.12847 & -1.1704 & 0.122592 \tabularnewline
46 & -0.046822 & -0.4266 & 0.335398 \tabularnewline
47 & 0.110059 & 1.0027 & 0.159463 \tabularnewline
48 & 0.386809 & 3.524 & 0.000347 \tabularnewline
49 & 0.067773 & 0.6174 & 0.269318 \tabularnewline
50 & -0.120556 & -1.0983 & 0.13762 \tabularnewline
51 & -0.178652 & -1.6276 & 0.053701 \tabularnewline
52 & -0.135107 & -1.2309 & 0.110922 \tabularnewline
53 & -0.007697 & -0.0701 & 0.472132 \tabularnewline
54 & 0.05563 & 0.5068 & 0.306816 \tabularnewline
55 & 0.002271 & 0.0207 & 0.491773 \tabularnewline
56 & -0.106778 & -0.9728 & 0.166741 \tabularnewline
57 & -0.060525 & -0.5514 & 0.291417 \tabularnewline
58 & -0.020998 & -0.1913 & 0.424378 \tabularnewline
59 & 0.087357 & 0.7959 & 0.214193 \tabularnewline
60 & 0.264074 & 2.4058 & 0.009179 \tabularnewline
\hline
\end{tabular}
%Source: https://freestatistics.org/blog/index.php?pk=70024&T=1

[TABLE]
[ROW][C]Autocorrelation Function[/C][/ROW]
[ROW][C]Time lag k[/C][C]ACF(k)[/C][C]T-STAT[/C][C]P-value[/C][/ROW]
[ROW][C]1[/C][C]0.262157[/C][C]2.3884[/C][C]0.009596[/C][/ROW]
[ROW][C]2[/C][C]-0.152956[/C][C]-1.3935[/C][C]0.083596[/C][/ROW]
[ROW][C]3[/C][C]-0.308263[/C][C]-2.8084[/C][C]0.003103[/C][/ROW]
[ROW][C]4[/C][C]-0.310348[/C][C]-2.8274[/C][C]0.00294[/C][/ROW]
[ROW][C]5[/C][C]0.040467[/C][C]0.3687[/C][C]0.356654[/C][/ROW]
[ROW][C]6[/C][C]0.163404[/C][C]1.4887[/C][C]0.07018[/C][/ROW]
[ROW][C]7[/C][C]0.050407[/C][C]0.4592[/C][C]0.323634[/C][/ROW]
[ROW][C]8[/C][C]-0.260402[/C][C]-2.3724[/C][C]0.009993[/C][/ROW]
[ROW][C]9[/C][C]-0.248535[/C][C]-2.2643[/C][C]0.013083[/C][/ROW]
[ROW][C]10[/C][C]-0.092983[/C][C]-0.8471[/C][C]0.199683[/C][/ROW]
[ROW][C]11[/C][C]0.248675[/C][C]2.2655[/C][C]0.013042[/C][/ROW]
[ROW][C]12[/C][C]0.760609[/C][C]6.9295[/C][C]0[/C][/ROW]
[ROW][C]13[/C][C]0.182471[/C][C]1.6624[/C][C]0.050104[/C][/ROW]
[ROW][C]14[/C][C]-0.133342[/C][C]-1.2148[/C][C]0.113943[/C][/ROW]
[ROW][C]15[/C][C]-0.270841[/C][C]-2.4675[/C][C]0.007831[/C][/ROW]
[ROW][C]16[/C][C]-0.252104[/C][C]-2.2968[/C][C]0.012075[/C][/ROW]
[ROW][C]17[/C][C]0.024721[/C][C]0.2252[/C][C]0.41118[/C][/ROW]
[ROW][C]18[/C][C]0.113537[/C][C]1.0344[/C][C]0.151984[/C][/ROW]
[ROW][C]19[/C][C]0.028739[/C][C]0.2618[/C][C]0.397053[/C][/ROW]
[ROW][C]20[/C][C]-0.232437[/C][C]-2.1176[/C][C]0.018601[/C][/ROW]
[ROW][C]21[/C][C]-0.198099[/C][C]-1.8048[/C][C]0.037369[/C][/ROW]
[ROW][C]22[/C][C]-0.066161[/C][C]-0.6028[/C][C]0.274157[/C][/ROW]
[ROW][C]23[/C][C]0.213543[/C][C]1.9455[/C][C]0.027552[/C][/ROW]
[ROW][C]24[/C][C]0.626268[/C][C]5.7056[/C][C]0[/C][/ROW]
[ROW][C]25[/C][C]0.136204[/C][C]1.2409[/C][C]0.109074[/C][/ROW]
[ROW][C]26[/C][C]-0.156059[/C][C]-1.4218[/C][C]0.079421[/C][/ROW]
[ROW][C]27[/C][C]-0.26382[/C][C]-2.4035[/C][C]0.009233[/C][/ROW]
[ROW][C]28[/C][C]-0.224209[/C][C]-2.0426[/C][C]0.022131[/C][/ROW]
[ROW][C]29[/C][C]0.032233[/C][C]0.2937[/C][C]0.384875[/C][/ROW]
[ROW][C]30[/C][C]0.083345[/C][C]0.7593[/C][C]0.224909[/C][/ROW]
[ROW][C]31[/C][C]0.016747[/C][C]0.1526[/C][C]0.439551[/C][/ROW]
[ROW][C]32[/C][C]-0.195293[/C][C]-1.7792[/C][C]0.039434[/C][/ROW]
[ROW][C]33[/C][C]-0.16932[/C][C]-1.5426[/C][C]0.063369[/C][/ROW]
[ROW][C]34[/C][C]-0.058456[/C][C]-0.5326[/C][C]0.297881[/C][/ROW]
[ROW][C]35[/C][C]0.14797[/C][C]1.3481[/C][C]0.090652[/C][/ROW]
[ROW][C]36[/C][C]0.495234[/C][C]4.5118[/C][C]1e-05[/C][/ROW]
[ROW][C]37[/C][C]0.115174[/C][C]1.0493[/C][C]0.148546[/C][/ROW]
[ROW][C]38[/C][C]-0.116695[/C][C]-1.0631[/C][C]0.1454[/C][/ROW]
[ROW][C]39[/C][C]-0.225954[/C][C]-2.0585[/C][C]0.021338[/C][/ROW]
[ROW][C]40[/C][C]-0.187673[/C][C]-1.7098[/C][C]0.045521[/C][/ROW]
[ROW][C]41[/C][C]1e-04[/C][C]9e-04[/C][C]0.499639[/C][/ROW]
[ROW][C]42[/C][C]0.068721[/C][C]0.6261[/C][C]0.266491[/C][/ROW]
[ROW][C]43[/C][C]0.023196[/C][C]0.2113[/C][C]0.416574[/C][/ROW]
[ROW][C]44[/C][C]-0.162482[/C][C]-1.4803[/C][C]0.071292[/C][/ROW]
[ROW][C]45[/C][C]-0.12847[/C][C]-1.1704[/C][C]0.122592[/C][/ROW]
[ROW][C]46[/C][C]-0.046822[/C][C]-0.4266[/C][C]0.335398[/C][/ROW]
[ROW][C]47[/C][C]0.110059[/C][C]1.0027[/C][C]0.159463[/C][/ROW]
[ROW][C]48[/C][C]0.386809[/C][C]3.524[/C][C]0.000347[/C][/ROW]
[ROW][C]49[/C][C]0.067773[/C][C]0.6174[/C][C]0.269318[/C][/ROW]
[ROW][C]50[/C][C]-0.120556[/C][C]-1.0983[/C][C]0.13762[/C][/ROW]
[ROW][C]51[/C][C]-0.178652[/C][C]-1.6276[/C][C]0.053701[/C][/ROW]
[ROW][C]52[/C][C]-0.135107[/C][C]-1.2309[/C][C]0.110922[/C][/ROW]
[ROW][C]53[/C][C]-0.007697[/C][C]-0.0701[/C][C]0.472132[/C][/ROW]
[ROW][C]54[/C][C]0.05563[/C][C]0.5068[/C][C]0.306816[/C][/ROW]
[ROW][C]55[/C][C]0.002271[/C][C]0.0207[/C][C]0.491773[/C][/ROW]
[ROW][C]56[/C][C]-0.106778[/C][C]-0.9728[/C][C]0.166741[/C][/ROW]
[ROW][C]57[/C][C]-0.060525[/C][C]-0.5514[/C][C]0.291417[/C][/ROW]
[ROW][C]58[/C][C]-0.020998[/C][C]-0.1913[/C][C]0.424378[/C][/ROW]
[ROW][C]59[/C][C]0.087357[/C][C]0.7959[/C][C]0.214193[/C][/ROW]
[ROW][C]60[/C][C]0.264074[/C][C]2.4058[/C][C]0.009179[/C][/ROW]
[/TABLE]
Source: https://freestatistics.org/blog/index.php?pk=70024&T=1

Globally Unique Identifier (entire table): ba.freestatistics.org/blog/index.php?pk=70024&T=1

As an alternative you can also use a QR Code:  

The GUIDs for individual cells are displayed in the table below:

Autocorrelation Function
Time lag kACF(k)T-STATP-value
10.2621572.38840.009596
2-0.152956-1.39350.083596
3-0.308263-2.80840.003103
4-0.310348-2.82740.00294
50.0404670.36870.356654
60.1634041.48870.07018
70.0504070.45920.323634
8-0.260402-2.37240.009993
9-0.248535-2.26430.013083
10-0.092983-0.84710.199683
110.2486752.26550.013042
120.7606096.92950
130.1824711.66240.050104
14-0.133342-1.21480.113943
15-0.270841-2.46750.007831
16-0.252104-2.29680.012075
170.0247210.22520.41118
180.1135371.03440.151984
190.0287390.26180.397053
20-0.232437-2.11760.018601
21-0.198099-1.80480.037369
22-0.066161-0.60280.274157
230.2135431.94550.027552
240.6262685.70560
250.1362041.24090.109074
26-0.156059-1.42180.079421
27-0.26382-2.40350.009233
28-0.224209-2.04260.022131
290.0322330.29370.384875
300.0833450.75930.224909
310.0167470.15260.439551
32-0.195293-1.77920.039434
33-0.16932-1.54260.063369
34-0.058456-0.53260.297881
350.147971.34810.090652
360.4952344.51181e-05
370.1151741.04930.148546
38-0.116695-1.06310.1454
39-0.225954-2.05850.021338
40-0.187673-1.70980.045521
411e-049e-040.499639
420.0687210.62610.266491
430.0231960.21130.416574
44-0.162482-1.48030.071292
45-0.12847-1.17040.122592
46-0.046822-0.42660.335398
470.1100591.00270.159463
480.3868093.5240.000347
490.0677730.61740.269318
50-0.120556-1.09830.13762
51-0.178652-1.62760.053701
52-0.135107-1.23090.110922
53-0.007697-0.07010.472132
540.055630.50680.306816
550.0022710.02070.491773
56-0.106778-0.97280.166741
57-0.060525-0.55140.291417
58-0.020998-0.19130.424378
590.0873570.79590.214193
600.2640742.40580.009179


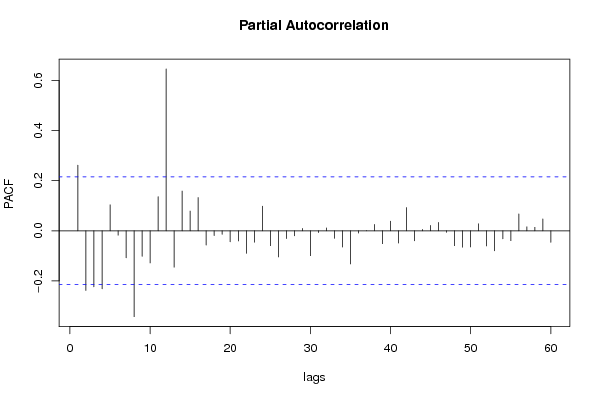
Partial Autocorrelation Function
Time lag kPACF(k)T-STATP-value
10.2621572.38840.009596
2-0.238042-2.16870.016485
3-0.223351-2.03480.02253
4-0.231773-2.11160.018866
50.1038010.94570.173529
6-0.017484-0.15930.436915
7-0.107931-0.98330.164159
8-0.3427-3.12210.001236
9-0.101585-0.92550.1787
10-0.128052-1.16660.123354
110.1364371.2430.108684
120.6463195.88820
13-0.145373-1.32440.094501
140.1585751.44470.076155
150.0787450.71740.237569
160.1328341.21020.114823
17-0.056765-0.51720.303212
18-0.019106-0.17410.431119
19-0.013951-0.12710.449583
20-0.043877-0.39970.345189
21-0.040171-0.3660.357658
22-0.089924-0.81920.207496
23-0.045158-0.41140.340917
240.0985930.89820.185832
25-0.059199-0.53930.295553
26-0.104052-0.9480.17295
27-0.030704-0.27970.390191
28-0.019905-0.18130.42827
290.0097470.08880.464727
30-0.099345-0.90510.184022
31-0.00679-0.06190.475413
320.0114950.10470.458422
33-0.03007-0.2740.392401
34-0.064974-0.59190.277751
35-0.132315-1.20540.115729
36-0.008918-0.08120.467722
370.0004060.00370.49853
380.0254050.23140.408768
39-0.051462-0.46880.320207
400.0383360.34930.363889
41-0.049035-0.44670.328117
420.0927120.84460.200369
43-0.039951-0.3640.358401
440.0054620.04980.480216
450.0213240.19430.423219
460.0335360.30550.380366
47-0.006031-0.05490.478158
48-0.059309-0.54030.295209
49-0.06524-0.59440.276942
50-0.064561-0.58820.279004
510.0280690.25570.399399
52-0.060159-0.54810.292555
53-0.079764-0.72670.234732
54-0.031905-0.29070.386016
55-0.039255-0.35760.360764
560.0676580.61640.269662
570.0162480.1480.441339
580.0141160.12860.448992
590.0473150.43110.33377
60-0.046101-0.420.337786

\begin{tabular}{lllllllll}
\hline
Partial Autocorrelation Function \tabularnewline
Time lag k & PACF(k) & T-STAT & P-value \tabularnewline
1 & 0.262157 & 2.3884 & 0.009596 \tabularnewline
2 & -0.238042 & -2.1687 & 0.016485 \tabularnewline
3 & -0.223351 & -2.0348 & 0.02253 \tabularnewline
4 & -0.231773 & -2.1116 & 0.018866 \tabularnewline
5 & 0.103801 & 0.9457 & 0.173529 \tabularnewline
6 & -0.017484 & -0.1593 & 0.436915 \tabularnewline
7 & -0.107931 & -0.9833 & 0.164159 \tabularnewline
8 & -0.3427 & -3.1221 & 0.001236 \tabularnewline
9 & -0.101585 & -0.9255 & 0.1787 \tabularnewline
10 & -0.128052 & -1.1666 & 0.123354 \tabularnewline
11 & 0.136437 & 1.243 & 0.108684 \tabularnewline
12 & 0.646319 & 5.8882 & 0 \tabularnewline
13 & -0.145373 & -1.3244 & 0.094501 \tabularnewline
14 & 0.158575 & 1.4447 & 0.076155 \tabularnewline
15 & 0.078745 & 0.7174 & 0.237569 \tabularnewline
16 & 0.132834 & 1.2102 & 0.114823 \tabularnewline
17 & -0.056765 & -0.5172 & 0.303212 \tabularnewline
18 & -0.019106 & -0.1741 & 0.431119 \tabularnewline
19 & -0.013951 & -0.1271 & 0.449583 \tabularnewline
20 & -0.043877 & -0.3997 & 0.345189 \tabularnewline
21 & -0.040171 & -0.366 & 0.357658 \tabularnewline
22 & -0.089924 & -0.8192 & 0.207496 \tabularnewline
23 & -0.045158 & -0.4114 & 0.340917 \tabularnewline
24 & 0.098593 & 0.8982 & 0.185832 \tabularnewline
25 & -0.059199 & -0.5393 & 0.295553 \tabularnewline
26 & -0.104052 & -0.948 & 0.17295 \tabularnewline
27 & -0.030704 & -0.2797 & 0.390191 \tabularnewline
28 & -0.019905 & -0.1813 & 0.42827 \tabularnewline
29 & 0.009747 & 0.0888 & 0.464727 \tabularnewline
30 & -0.099345 & -0.9051 & 0.184022 \tabularnewline
31 & -0.00679 & -0.0619 & 0.475413 \tabularnewline
32 & 0.011495 & 0.1047 & 0.458422 \tabularnewline
33 & -0.03007 & -0.274 & 0.392401 \tabularnewline
34 & -0.064974 & -0.5919 & 0.277751 \tabularnewline
35 & -0.132315 & -1.2054 & 0.115729 \tabularnewline
36 & -0.008918 & -0.0812 & 0.467722 \tabularnewline
37 & 0.000406 & 0.0037 & 0.49853 \tabularnewline
38 & 0.025405 & 0.2314 & 0.408768 \tabularnewline
39 & -0.051462 & -0.4688 & 0.320207 \tabularnewline
40 & 0.038336 & 0.3493 & 0.363889 \tabularnewline
41 & -0.049035 & -0.4467 & 0.328117 \tabularnewline
42 & 0.092712 & 0.8446 & 0.200369 \tabularnewline
43 & -0.039951 & -0.364 & 0.358401 \tabularnewline
44 & 0.005462 & 0.0498 & 0.480216 \tabularnewline
45 & 0.021324 & 0.1943 & 0.423219 \tabularnewline
46 & 0.033536 & 0.3055 & 0.380366 \tabularnewline
47 & -0.006031 & -0.0549 & 0.478158 \tabularnewline
48 & -0.059309 & -0.5403 & 0.295209 \tabularnewline
49 & -0.06524 & -0.5944 & 0.276942 \tabularnewline
50 & -0.064561 & -0.5882 & 0.279004 \tabularnewline
51 & 0.028069 & 0.2557 & 0.399399 \tabularnewline
52 & -0.060159 & -0.5481 & 0.292555 \tabularnewline
53 & -0.079764 & -0.7267 & 0.234732 \tabularnewline
54 & -0.031905 & -0.2907 & 0.386016 \tabularnewline
55 & -0.039255 & -0.3576 & 0.360764 \tabularnewline
56 & 0.067658 & 0.6164 & 0.269662 \tabularnewline
57 & 0.016248 & 0.148 & 0.441339 \tabularnewline
58 & 0.014116 & 0.1286 & 0.448992 \tabularnewline
59 & 0.047315 & 0.4311 & 0.33377 \tabularnewline
60 & -0.046101 & -0.42 & 0.337786 \tabularnewline
\hline
\end{tabular}
%Source: https://freestatistics.org/blog/index.php?pk=70024&T=2

[TABLE]
[ROW][C]Partial Autocorrelation Function[/C][/ROW]
[ROW][C]Time lag k[/C][C]PACF(k)[/C][C]T-STAT[/C][C]P-value[/C][/ROW]
[ROW][C]1[/C][C]0.262157[/C][C]2.3884[/C][C]0.009596[/C][/ROW]
[ROW][C]2[/C][C]-0.238042[/C][C]-2.1687[/C][C]0.016485[/C][/ROW]
[ROW][C]3[/C][C]-0.223351[/C][C]-2.0348[/C][C]0.02253[/C][/ROW]
[ROW][C]4[/C][C]-0.231773[/C][C]-2.1116[/C][C]0.018866[/C][/ROW]
[ROW][C]5[/C][C]0.103801[/C][C]0.9457[/C][C]0.173529[/C][/ROW]
[ROW][C]6[/C][C]-0.017484[/C][C]-0.1593[/C][C]0.436915[/C][/ROW]
[ROW][C]7[/C][C]-0.107931[/C][C]-0.9833[/C][C]0.164159[/C][/ROW]
[ROW][C]8[/C][C]-0.3427[/C][C]-3.1221[/C][C]0.001236[/C][/ROW]
[ROW][C]9[/C][C]-0.101585[/C][C]-0.9255[/C][C]0.1787[/C][/ROW]
[ROW][C]10[/C][C]-0.128052[/C][C]-1.1666[/C][C]0.123354[/C][/ROW]
[ROW][C]11[/C][C]0.136437[/C][C]1.243[/C][C]0.108684[/C][/ROW]
[ROW][C]12[/C][C]0.646319[/C][C]5.8882[/C][C]0[/C][/ROW]
[ROW][C]13[/C][C]-0.145373[/C][C]-1.3244[/C][C]0.094501[/C][/ROW]
[ROW][C]14[/C][C]0.158575[/C][C]1.4447[/C][C]0.076155[/C][/ROW]
[ROW][C]15[/C][C]0.078745[/C][C]0.7174[/C][C]0.237569[/C][/ROW]
[ROW][C]16[/C][C]0.132834[/C][C]1.2102[/C][C]0.114823[/C][/ROW]
[ROW][C]17[/C][C]-0.056765[/C][C]-0.5172[/C][C]0.303212[/C][/ROW]
[ROW][C]18[/C][C]-0.019106[/C][C]-0.1741[/C][C]0.431119[/C][/ROW]
[ROW][C]19[/C][C]-0.013951[/C][C]-0.1271[/C][C]0.449583[/C][/ROW]
[ROW][C]20[/C][C]-0.043877[/C][C]-0.3997[/C][C]0.345189[/C][/ROW]
[ROW][C]21[/C][C]-0.040171[/C][C]-0.366[/C][C]0.357658[/C][/ROW]
[ROW][C]22[/C][C]-0.089924[/C][C]-0.8192[/C][C]0.207496[/C][/ROW]
[ROW][C]23[/C][C]-0.045158[/C][C]-0.4114[/C][C]0.340917[/C][/ROW]
[ROW][C]24[/C][C]0.098593[/C][C]0.8982[/C][C]0.185832[/C][/ROW]
[ROW][C]25[/C][C]-0.059199[/C][C]-0.5393[/C][C]0.295553[/C][/ROW]
[ROW][C]26[/C][C]-0.104052[/C][C]-0.948[/C][C]0.17295[/C][/ROW]
[ROW][C]27[/C][C]-0.030704[/C][C]-0.2797[/C][C]0.390191[/C][/ROW]
[ROW][C]28[/C][C]-0.019905[/C][C]-0.1813[/C][C]0.42827[/C][/ROW]
[ROW][C]29[/C][C]0.009747[/C][C]0.0888[/C][C]0.464727[/C][/ROW]
[ROW][C]30[/C][C]-0.099345[/C][C]-0.9051[/C][C]0.184022[/C][/ROW]
[ROW][C]31[/C][C]-0.00679[/C][C]-0.0619[/C][C]0.475413[/C][/ROW]
[ROW][C]32[/C][C]0.011495[/C][C]0.1047[/C][C]0.458422[/C][/ROW]
[ROW][C]33[/C][C]-0.03007[/C][C]-0.274[/C][C]0.392401[/C][/ROW]
[ROW][C]34[/C][C]-0.064974[/C][C]-0.5919[/C][C]0.277751[/C][/ROW]
[ROW][C]35[/C][C]-0.132315[/C][C]-1.2054[/C][C]0.115729[/C][/ROW]
[ROW][C]36[/C][C]-0.008918[/C][C]-0.0812[/C][C]0.467722[/C][/ROW]
[ROW][C]37[/C][C]0.000406[/C][C]0.0037[/C][C]0.49853[/C][/ROW]
[ROW][C]38[/C][C]0.025405[/C][C]0.2314[/C][C]0.408768[/C][/ROW]
[ROW][C]39[/C][C]-0.051462[/C][C]-0.4688[/C][C]0.320207[/C][/ROW]
[ROW][C]40[/C][C]0.038336[/C][C]0.3493[/C][C]0.363889[/C][/ROW]
[ROW][C]41[/C][C]-0.049035[/C][C]-0.4467[/C][C]0.328117[/C][/ROW]
[ROW][C]42[/C][C]0.092712[/C][C]0.8446[/C][C]0.200369[/C][/ROW]
[ROW][C]43[/C][C]-0.039951[/C][C]-0.364[/C][C]0.358401[/C][/ROW]
[ROW][C]44[/C][C]0.005462[/C][C]0.0498[/C][C]0.480216[/C][/ROW]
[ROW][C]45[/C][C]0.021324[/C][C]0.1943[/C][C]0.423219[/C][/ROW]
[ROW][C]46[/C][C]0.033536[/C][C]0.3055[/C][C]0.380366[/C][/ROW]
[ROW][C]47[/C][C]-0.006031[/C][C]-0.0549[/C][C]0.478158[/C][/ROW]
[ROW][C]48[/C][C]-0.059309[/C][C]-0.5403[/C][C]0.295209[/C][/ROW]
[ROW][C]49[/C][C]-0.06524[/C][C]-0.5944[/C][C]0.276942[/C][/ROW]
[ROW][C]50[/C][C]-0.064561[/C][C]-0.5882[/C][C]0.279004[/C][/ROW]
[ROW][C]51[/C][C]0.028069[/C][C]0.2557[/C][C]0.399399[/C][/ROW]
[ROW][C]52[/C][C]-0.060159[/C][C]-0.5481[/C][C]0.292555[/C][/ROW]
[ROW][C]53[/C][C]-0.079764[/C][C]-0.7267[/C][C]0.234732[/C][/ROW]
[ROW][C]54[/C][C]-0.031905[/C][C]-0.2907[/C][C]0.386016[/C][/ROW]
[ROW][C]55[/C][C]-0.039255[/C][C]-0.3576[/C][C]0.360764[/C][/ROW]
[ROW][C]56[/C][C]0.067658[/C][C]0.6164[/C][C]0.269662[/C][/ROW]
[ROW][C]57[/C][C]0.016248[/C][C]0.148[/C][C]0.441339[/C][/ROW]
[ROW][C]58[/C][C]0.014116[/C][C]0.1286[/C][C]0.448992[/C][/ROW]
[ROW][C]59[/C][C]0.047315[/C][C]0.4311[/C][C]0.33377[/C][/ROW]
[ROW][C]60[/C][C]-0.046101[/C][C]-0.42[/C][C]0.337786[/C][/ROW]
[/TABLE]
Source: https://freestatistics.org/blog/index.php?pk=70024&T=2

Globally Unique Identifier (entire table): ba.freestatistics.org/blog/index.php?pk=70024&T=2

As an alternative you can also use a QR Code:  

The GUIDs for individual cells are displayed in the table below:

Partial Autocorrelation Function
Time lag kPACF(k)T-STATP-value
10.2621572.38840.009596
2-0.238042-2.16870.016485
3-0.223351-2.03480.02253
4-0.231773-2.11160.018866
50.1038010.94570.173529
6-0.017484-0.15930.436915
7-0.107931-0.98330.164159
8-0.3427-3.12210.001236
9-0.101585-0.92550.1787
10-0.128052-1.16660.123354
110.1364371.2430.108684
120.6463195.88820
13-0.145373-1.32440.094501
140.1585751.44470.076155
150.0787450.71740.237569
160.1328341.21020.114823
17-0.056765-0.51720.303212
18-0.019106-0.17410.431119
19-0.013951-0.12710.449583
20-0.043877-0.39970.345189
21-0.040171-0.3660.357658
22-0.089924-0.81920.207496
23-0.045158-0.41140.340917
240.0985930.89820.185832
25-0.059199-0.53930.295553
26-0.104052-0.9480.17295
27-0.030704-0.27970.390191
28-0.019905-0.18130.42827
290.0097470.08880.464727
30-0.099345-0.90510.184022
31-0.00679-0.06190.475413
320.0114950.10470.458422
33-0.03007-0.2740.392401
34-0.064974-0.59190.277751
35-0.132315-1.20540.115729
36-0.008918-0.08120.467722
370.0004060.00370.49853
380.0254050.23140.408768
39-0.051462-0.46880.320207
400.0383360.34930.363889
41-0.049035-0.44670.328117
420.0927120.84460.200369
43-0.039951-0.3640.358401
440.0054620.04980.480216
450.0213240.19430.423219
460.0335360.30550.380366
47-0.006031-0.05490.478158
48-0.059309-0.54030.295209
49-0.06524-0.59440.276942
50-0.064561-0.58820.279004
510.0280690.25570.399399
52-0.060159-0.54810.292555
53-0.079764-0.72670.234732
54-0.031905-0.29070.386016
55-0.039255-0.35760.360764
560.0676580.61640.269662
570.0162480.1480.441339
580.0141160.12860.448992
590.0473150.43110.33377
60-0.046101-0.420.337786


Parameters (Session):
par1 = 60 ; par2 = 1 ; par3 = 1 ; par4 = 0 ; par5 = 12 ; par6 = White Noise ;
Parameters (R input):
par1 = 60 ; par2 = 1 ; par3 = 1 ; par4 = 0 ; par5 = 12 ; par6 = White Noise ; par7 = ;
R code (references can be found in the software module):
if (par1 == 'Default') {
par1 = 10*log10(length(x))
} else {
par1 <- as.numeric(par1)
}
par2 <- as.numeric(par2)
par3 <- as.numeric(par3)
par4 <- as.numeric(par4)
par5 <- as.numeric(par5)
if (par2 == 0) {
x <- log(x)
} else {
x <- (x ^ par2 - 1) / par2
}
if (par3 > 0) x <- diff(x,lag=1,difference=par3)
if (par4 > 0) x <- diff(x,lag=par5,difference=par4)
bitmap(file='pic1.png')
racf <- acf(x,par1,main='Autocorrelation',xlab='lags',ylab='ACF')
dev.off()
bitmap(file='pic2.png')
rpacf <- pacf(x,par1,main='Partial Autocorrelation',xlab='lags',ylab='PACF')
dev.off()
(myacf <- c(racf$acf))
(mypacf <- c(rpacf$acf))
lengthx <- length(x)
sqrtn <- sqrt(lengthx)
load(file='createtable')
a<-table.start()
a<-table.row.start(a)
a<-table.element(a,'Autocorrelation Function',4,TRUE)
a<-table.row.end(a)
a<-table.row.start(a)
a<-table.element(a,'Time lag k',header=TRUE)
a<-table.element(a,hyperlink('basics.htm','ACF(k)','click here for more information about the Autocorrelation Function'),header=TRUE)
a<-table.element(a,'T-STAT',header=TRUE)
a<-table.element(a,'P-value',header=TRUE)
a<-table.row.end(a)
for (i in 2:(par1+1)) {
a<-table.row.start(a)
a<-table.element(a,i-1,header=TRUE)
a<-table.element(a,round(myacf[i],6))
mytstat <- myacf[i]*sqrtn
a<-table.element(a,round(mytstat,4))
a<-table.element(a,round(1-pt(abs(mytstat),lengthx),6))
a<-table.row.end(a)
}
a<-table.end(a)
table.save(a,file='mytable.tab')
a<-table.start()
a<-table.row.start(a)
a<-table.element(a,'Partial Autocorrelation Function',4,TRUE)
a<-table.row.end(a)
a<-table.row.start(a)
a<-table.element(a,'Time lag k',header=TRUE)
a<-table.element(a,hyperlink('basics.htm','PACF(k)','click here for more information about the Partial Autocorrelation Function'),header=TRUE)
a<-table.element(a,'T-STAT',header=TRUE)
a<-table.element(a,'P-value',header=TRUE)
a<-table.row.end(a)
for (i in 1:par1) {
a<-table.row.start(a)
a<-table.element(a,i,header=TRUE)
a<-table.element(a,round(mypacf[i],6))
mytstat <- mypacf[i]*sqrtn
a<-table.element(a,round(mytstat,4))
a<-table.element(a,round(1-pt(abs(mytstat),lengthx),6))
a<-table.row.end(a)
}
a<-table.end(a)
table.save(a,file='mytable1.tab')