Free Statistics

of Irreproducible Research!

Author's title

Author*The author of this computation has been verified*
R Software Modulerwasp_autocorrelation.wasp
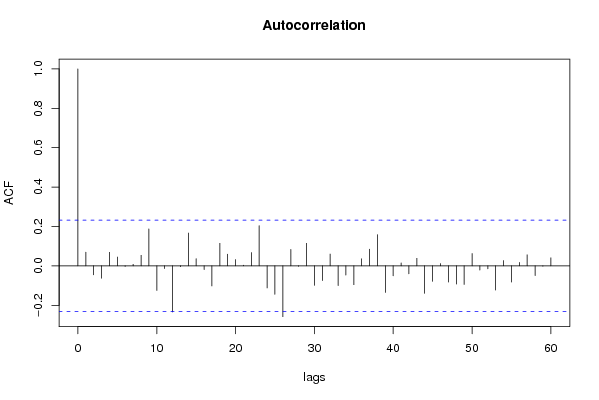
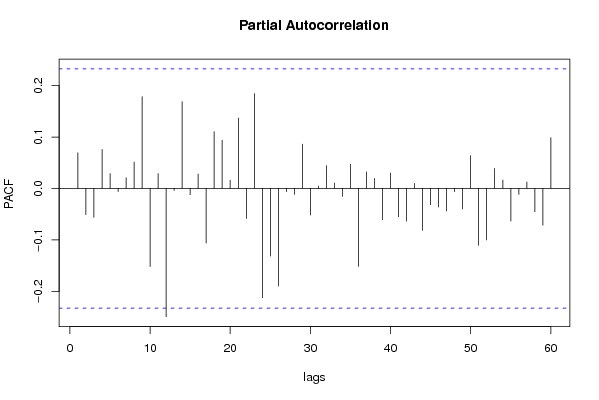
Title produced by software(Partial) Autocorrelation Function
Date of computationSun, 20 Dec 2009 14:06:07 -0700
Cite this page as followsStatistical Computations at FreeStatistics.org, Office for Research Development and Education, URL https://freestatistics.org/blog/index.php?v=date/2009/Dec/20/t1261343214o8eed5xjz5jpiuz.htm/, Retrieved Sat, 27 Apr 2024 11:47:03 +0000
Statistical Computations at FreeStatistics.org, Office for Research Development and Education, URL https://freestatistics.org/blog/index.php?pk=70026, Retrieved Sat, 27 Apr 2024 11:47:03 +0000
QR Codes:

Original text written by user:
IsPrivate?No (this computation is public)
User-defined keywords
Estimated Impact101
Family? (F = Feedback message, R = changed R code, M = changed R Module, P = changed Parameters, D = changed Data)
-     [(Partial) Autocorrelation Function] [Paper TW] [2008-12-10 10:50:18] [6610d6fd8f463fb18a844c14dc2c3579]
- RMP     [(Partial) Autocorrelation Function] [autocorrelatie] [2009-12-20 21:06:07] [56eb6eb137e5652a8f2309d1e9c805c5] [Current]
Feedback Forum

Post a new message
Dataseries X:
467
460
448
443
436
431
484
510
513
503
471
471
476
475
470
461
455
456
517
525
523
519
509
512
519
517
510
509
501
507
569
580
578
565
547
555
562
561
555
544
537
543
594
611
613
611
594
595
591
589
584
573
567
569
621
629
628
612
595
597
593
590
580
574
573
573
620
626
620
588
566
557
561
549
532
526
511
499
555
565
542
527
510
514


Summary of computational transaction
Raw Inputview raw input (R code)
Raw Outputview raw output of R engine
Computing time2 seconds
R Server'Gwilym Jenkins' @ 72.249.127.135

\begin{tabular}{lllllllll}
\hline
Summary of computational transaction \tabularnewline
Raw Input & view raw input (R code)  \tabularnewline
Raw Output & view raw output of R engine  \tabularnewline
Computing time & 2 seconds \tabularnewline
R Server & 'Gwilym Jenkins' @ 72.249.127.135 \tabularnewline
\hline
\end{tabular}
%Source: https://freestatistics.org/blog/index.php?pk=70026&T=0

[TABLE]
[ROW][C]Summary of computational transaction[/C][/ROW]
[ROW][C]Raw Input[/C][C]view raw input (R code) [/C][/ROW]
[ROW][C]Raw Output[/C][C]view raw output of R engine [/C][/ROW]
[ROW][C]Computing time[/C][C]2 seconds[/C][/ROW]
[ROW][C]R Server[/C][C]'Gwilym Jenkins' @ 72.249.127.135[/C][/ROW]
[/TABLE]
Source: https://freestatistics.org/blog/index.php?pk=70026&T=0

Globally Unique Identifier (entire table): ba.freestatistics.org/blog/index.php?pk=70026&T=0

As an alternative you can also use a QR Code:  

The GUIDs for individual cells are displayed in the table below:

Summary of computational transaction
Raw Inputview raw input (R code)
Raw Outputview raw output of R engine
Computing time2 seconds
R Server'Gwilym Jenkins' @ 72.249.127.135


Autocorrelation Function
Time lag kACF(k)T-STATP-value
10.0694710.58540.280077
2-0.045642-0.38460.350848
3-0.062572-0.52720.299834
40.0689390.58090.281578
50.0445640.37550.354203
6-0.003041-0.02560.489814
70.0079390.06690.473427
80.0534640.45050.326863
90.1873651.57880.059418
10-0.124996-1.05320.147902
11-0.013622-0.11480.454473
12-0.23423-1.97370.026156
13-0.004102-0.03460.486263
140.1666581.40430.082297
150.0367190.30940.378962
16-0.01848-0.15570.438349
17-0.102033-0.85970.196412
180.1143550.96360.169266
190.0594310.50080.309039
200.0320750.27030.39387
210.0034110.02870.488575
220.067450.56830.285799
230.2038791.71790.045085
24-0.111868-0.94260.174536
25-0.144735-1.21960.113333
26-0.257901-2.17310.016555
270.0835850.70430.241774
28-0.001982-0.01670.49336
290.1142730.96290.169437
30-0.098687-0.83160.204224
31-0.074521-0.62790.266034
320.0597980.50390.307956
33-0.100087-0.84330.200933
34-0.046437-0.39130.348379
35-0.095659-0.8060.211456
360.0357050.30090.382201
370.0848420.71490.23851
380.158551.3360.092913
39-0.134977-1.13730.12961
40-0.050683-0.42710.335312
410.0148080.12480.450527
42-0.040585-0.3420.36669
430.0382120.3220.374207
44-0.139673-1.17690.121582
45-0.078521-0.66160.255175
460.0115560.09740.461352
47-0.082453-0.69480.244737
48-0.092249-0.77730.219781
49-0.094295-0.79450.214763
500.0625430.5270.299918
51-0.021462-0.18080.428504
52-0.014743-0.12420.450743
53-0.122592-1.0330.15256
540.0268540.22630.410819
55-0.082316-0.69360.245097
560.0176360.14860.441144
570.0561390.4730.318819
58-0.049085-0.41360.340206
59-0.001658-0.0140.494448
600.0406680.34270.366428

\begin{tabular}{lllllllll}
\hline
Autocorrelation Function \tabularnewline
Time lag k & ACF(k) & T-STAT & P-value \tabularnewline
1 & 0.069471 & 0.5854 & 0.280077 \tabularnewline
2 & -0.045642 & -0.3846 & 0.350848 \tabularnewline
3 & -0.062572 & -0.5272 & 0.299834 \tabularnewline
4 & 0.068939 & 0.5809 & 0.281578 \tabularnewline
5 & 0.044564 & 0.3755 & 0.354203 \tabularnewline
6 & -0.003041 & -0.0256 & 0.489814 \tabularnewline
7 & 0.007939 & 0.0669 & 0.473427 \tabularnewline
8 & 0.053464 & 0.4505 & 0.326863 \tabularnewline
9 & 0.187365 & 1.5788 & 0.059418 \tabularnewline
10 & -0.124996 & -1.0532 & 0.147902 \tabularnewline
11 & -0.013622 & -0.1148 & 0.454473 \tabularnewline
12 & -0.23423 & -1.9737 & 0.026156 \tabularnewline
13 & -0.004102 & -0.0346 & 0.486263 \tabularnewline
14 & 0.166658 & 1.4043 & 0.082297 \tabularnewline
15 & 0.036719 & 0.3094 & 0.378962 \tabularnewline
16 & -0.01848 & -0.1557 & 0.438349 \tabularnewline
17 & -0.102033 & -0.8597 & 0.196412 \tabularnewline
18 & 0.114355 & 0.9636 & 0.169266 \tabularnewline
19 & 0.059431 & 0.5008 & 0.309039 \tabularnewline
20 & 0.032075 & 0.2703 & 0.39387 \tabularnewline
21 & 0.003411 & 0.0287 & 0.488575 \tabularnewline
22 & 0.06745 & 0.5683 & 0.285799 \tabularnewline
23 & 0.203879 & 1.7179 & 0.045085 \tabularnewline
24 & -0.111868 & -0.9426 & 0.174536 \tabularnewline
25 & -0.144735 & -1.2196 & 0.113333 \tabularnewline
26 & -0.257901 & -2.1731 & 0.016555 \tabularnewline
27 & 0.083585 & 0.7043 & 0.241774 \tabularnewline
28 & -0.001982 & -0.0167 & 0.49336 \tabularnewline
29 & 0.114273 & 0.9629 & 0.169437 \tabularnewline
30 & -0.098687 & -0.8316 & 0.204224 \tabularnewline
31 & -0.074521 & -0.6279 & 0.266034 \tabularnewline
32 & 0.059798 & 0.5039 & 0.307956 \tabularnewline
33 & -0.100087 & -0.8433 & 0.200933 \tabularnewline
34 & -0.046437 & -0.3913 & 0.348379 \tabularnewline
35 & -0.095659 & -0.806 & 0.211456 \tabularnewline
36 & 0.035705 & 0.3009 & 0.382201 \tabularnewline
37 & 0.084842 & 0.7149 & 0.23851 \tabularnewline
38 & 0.15855 & 1.336 & 0.092913 \tabularnewline
39 & -0.134977 & -1.1373 & 0.12961 \tabularnewline
40 & -0.050683 & -0.4271 & 0.335312 \tabularnewline
41 & 0.014808 & 0.1248 & 0.450527 \tabularnewline
42 & -0.040585 & -0.342 & 0.36669 \tabularnewline
43 & 0.038212 & 0.322 & 0.374207 \tabularnewline
44 & -0.139673 & -1.1769 & 0.121582 \tabularnewline
45 & -0.078521 & -0.6616 & 0.255175 \tabularnewline
46 & 0.011556 & 0.0974 & 0.461352 \tabularnewline
47 & -0.082453 & -0.6948 & 0.244737 \tabularnewline
48 & -0.092249 & -0.7773 & 0.219781 \tabularnewline
49 & -0.094295 & -0.7945 & 0.214763 \tabularnewline
50 & 0.062543 & 0.527 & 0.299918 \tabularnewline
51 & -0.021462 & -0.1808 & 0.428504 \tabularnewline
52 & -0.014743 & -0.1242 & 0.450743 \tabularnewline
53 & -0.122592 & -1.033 & 0.15256 \tabularnewline
54 & 0.026854 & 0.2263 & 0.410819 \tabularnewline
55 & -0.082316 & -0.6936 & 0.245097 \tabularnewline
56 & 0.017636 & 0.1486 & 0.441144 \tabularnewline
57 & 0.056139 & 0.473 & 0.318819 \tabularnewline
58 & -0.049085 & -0.4136 & 0.340206 \tabularnewline
59 & -0.001658 & -0.014 & 0.494448 \tabularnewline
60 & 0.040668 & 0.3427 & 0.366428 \tabularnewline
\hline
\end{tabular}
%Source: https://freestatistics.org/blog/index.php?pk=70026&T=1

[TABLE]
[ROW][C]Autocorrelation Function[/C][/ROW]
[ROW][C]Time lag k[/C][C]ACF(k)[/C][C]T-STAT[/C][C]P-value[/C][/ROW]
[ROW][C]1[/C][C]0.069471[/C][C]0.5854[/C][C]0.280077[/C][/ROW]
[ROW][C]2[/C][C]-0.045642[/C][C]-0.3846[/C][C]0.350848[/C][/ROW]
[ROW][C]3[/C][C]-0.062572[/C][C]-0.5272[/C][C]0.299834[/C][/ROW]
[ROW][C]4[/C][C]0.068939[/C][C]0.5809[/C][C]0.281578[/C][/ROW]
[ROW][C]5[/C][C]0.044564[/C][C]0.3755[/C][C]0.354203[/C][/ROW]
[ROW][C]6[/C][C]-0.003041[/C][C]-0.0256[/C][C]0.489814[/C][/ROW]
[ROW][C]7[/C][C]0.007939[/C][C]0.0669[/C][C]0.473427[/C][/ROW]
[ROW][C]8[/C][C]0.053464[/C][C]0.4505[/C][C]0.326863[/C][/ROW]
[ROW][C]9[/C][C]0.187365[/C][C]1.5788[/C][C]0.059418[/C][/ROW]
[ROW][C]10[/C][C]-0.124996[/C][C]-1.0532[/C][C]0.147902[/C][/ROW]
[ROW][C]11[/C][C]-0.013622[/C][C]-0.1148[/C][C]0.454473[/C][/ROW]
[ROW][C]12[/C][C]-0.23423[/C][C]-1.9737[/C][C]0.026156[/C][/ROW]
[ROW][C]13[/C][C]-0.004102[/C][C]-0.0346[/C][C]0.486263[/C][/ROW]
[ROW][C]14[/C][C]0.166658[/C][C]1.4043[/C][C]0.082297[/C][/ROW]
[ROW][C]15[/C][C]0.036719[/C][C]0.3094[/C][C]0.378962[/C][/ROW]
[ROW][C]16[/C][C]-0.01848[/C][C]-0.1557[/C][C]0.438349[/C][/ROW]
[ROW][C]17[/C][C]-0.102033[/C][C]-0.8597[/C][C]0.196412[/C][/ROW]
[ROW][C]18[/C][C]0.114355[/C][C]0.9636[/C][C]0.169266[/C][/ROW]
[ROW][C]19[/C][C]0.059431[/C][C]0.5008[/C][C]0.309039[/C][/ROW]
[ROW][C]20[/C][C]0.032075[/C][C]0.2703[/C][C]0.39387[/C][/ROW]
[ROW][C]21[/C][C]0.003411[/C][C]0.0287[/C][C]0.488575[/C][/ROW]
[ROW][C]22[/C][C]0.06745[/C][C]0.5683[/C][C]0.285799[/C][/ROW]
[ROW][C]23[/C][C]0.203879[/C][C]1.7179[/C][C]0.045085[/C][/ROW]
[ROW][C]24[/C][C]-0.111868[/C][C]-0.9426[/C][C]0.174536[/C][/ROW]
[ROW][C]25[/C][C]-0.144735[/C][C]-1.2196[/C][C]0.113333[/C][/ROW]
[ROW][C]26[/C][C]-0.257901[/C][C]-2.1731[/C][C]0.016555[/C][/ROW]
[ROW][C]27[/C][C]0.083585[/C][C]0.7043[/C][C]0.241774[/C][/ROW]
[ROW][C]28[/C][C]-0.001982[/C][C]-0.0167[/C][C]0.49336[/C][/ROW]
[ROW][C]29[/C][C]0.114273[/C][C]0.9629[/C][C]0.169437[/C][/ROW]
[ROW][C]30[/C][C]-0.098687[/C][C]-0.8316[/C][C]0.204224[/C][/ROW]
[ROW][C]31[/C][C]-0.074521[/C][C]-0.6279[/C][C]0.266034[/C][/ROW]
[ROW][C]32[/C][C]0.059798[/C][C]0.5039[/C][C]0.307956[/C][/ROW]
[ROW][C]33[/C][C]-0.100087[/C][C]-0.8433[/C][C]0.200933[/C][/ROW]
[ROW][C]34[/C][C]-0.046437[/C][C]-0.3913[/C][C]0.348379[/C][/ROW]
[ROW][C]35[/C][C]-0.095659[/C][C]-0.806[/C][C]0.211456[/C][/ROW]
[ROW][C]36[/C][C]0.035705[/C][C]0.3009[/C][C]0.382201[/C][/ROW]
[ROW][C]37[/C][C]0.084842[/C][C]0.7149[/C][C]0.23851[/C][/ROW]
[ROW][C]38[/C][C]0.15855[/C][C]1.336[/C][C]0.092913[/C][/ROW]
[ROW][C]39[/C][C]-0.134977[/C][C]-1.1373[/C][C]0.12961[/C][/ROW]
[ROW][C]40[/C][C]-0.050683[/C][C]-0.4271[/C][C]0.335312[/C][/ROW]
[ROW][C]41[/C][C]0.014808[/C][C]0.1248[/C][C]0.450527[/C][/ROW]
[ROW][C]42[/C][C]-0.040585[/C][C]-0.342[/C][C]0.36669[/C][/ROW]
[ROW][C]43[/C][C]0.038212[/C][C]0.322[/C][C]0.374207[/C][/ROW]
[ROW][C]44[/C][C]-0.139673[/C][C]-1.1769[/C][C]0.121582[/C][/ROW]
[ROW][C]45[/C][C]-0.078521[/C][C]-0.6616[/C][C]0.255175[/C][/ROW]
[ROW][C]46[/C][C]0.011556[/C][C]0.0974[/C][C]0.461352[/C][/ROW]
[ROW][C]47[/C][C]-0.082453[/C][C]-0.6948[/C][C]0.244737[/C][/ROW]
[ROW][C]48[/C][C]-0.092249[/C][C]-0.7773[/C][C]0.219781[/C][/ROW]
[ROW][C]49[/C][C]-0.094295[/C][C]-0.7945[/C][C]0.214763[/C][/ROW]
[ROW][C]50[/C][C]0.062543[/C][C]0.527[/C][C]0.299918[/C][/ROW]
[ROW][C]51[/C][C]-0.021462[/C][C]-0.1808[/C][C]0.428504[/C][/ROW]
[ROW][C]52[/C][C]-0.014743[/C][C]-0.1242[/C][C]0.450743[/C][/ROW]
[ROW][C]53[/C][C]-0.122592[/C][C]-1.033[/C][C]0.15256[/C][/ROW]
[ROW][C]54[/C][C]0.026854[/C][C]0.2263[/C][C]0.410819[/C][/ROW]
[ROW][C]55[/C][C]-0.082316[/C][C]-0.6936[/C][C]0.245097[/C][/ROW]
[ROW][C]56[/C][C]0.017636[/C][C]0.1486[/C][C]0.441144[/C][/ROW]
[ROW][C]57[/C][C]0.056139[/C][C]0.473[/C][C]0.318819[/C][/ROW]
[ROW][C]58[/C][C]-0.049085[/C][C]-0.4136[/C][C]0.340206[/C][/ROW]
[ROW][C]59[/C][C]-0.001658[/C][C]-0.014[/C][C]0.494448[/C][/ROW]
[ROW][C]60[/C][C]0.040668[/C][C]0.3427[/C][C]0.366428[/C][/ROW]
[/TABLE]
Source: https://freestatistics.org/blog/index.php?pk=70026&T=1

Globally Unique Identifier (entire table): ba.freestatistics.org/blog/index.php?pk=70026&T=1

As an alternative you can also use a QR Code:  

The GUIDs for individual cells are displayed in the table below:

Autocorrelation Function
Time lag kACF(k)T-STATP-value
10.0694710.58540.280077
2-0.045642-0.38460.350848
3-0.062572-0.52720.299834
40.0689390.58090.281578
50.0445640.37550.354203
6-0.003041-0.02560.489814
70.0079390.06690.473427
80.0534640.45050.326863
90.1873651.57880.059418
10-0.124996-1.05320.147902
11-0.013622-0.11480.454473
12-0.23423-1.97370.026156
13-0.004102-0.03460.486263
140.1666581.40430.082297
150.0367190.30940.378962
16-0.01848-0.15570.438349
17-0.102033-0.85970.196412
180.1143550.96360.169266
190.0594310.50080.309039
200.0320750.27030.39387
210.0034110.02870.488575
220.067450.56830.285799
230.2038791.71790.045085
24-0.111868-0.94260.174536
25-0.144735-1.21960.113333
26-0.257901-2.17310.016555
270.0835850.70430.241774
28-0.001982-0.01670.49336
290.1142730.96290.169437
30-0.098687-0.83160.204224
31-0.074521-0.62790.266034
320.0597980.50390.307956
33-0.100087-0.84330.200933
34-0.046437-0.39130.348379
35-0.095659-0.8060.211456
360.0357050.30090.382201
370.0848420.71490.23851
380.158551.3360.092913
39-0.134977-1.13730.12961
40-0.050683-0.42710.335312
410.0148080.12480.450527
42-0.040585-0.3420.36669
430.0382120.3220.374207
44-0.139673-1.17690.121582
45-0.078521-0.66160.255175
460.0115560.09740.461352
47-0.082453-0.69480.244737
48-0.092249-0.77730.219781
49-0.094295-0.79450.214763
500.0625430.5270.299918
51-0.021462-0.18080.428504
52-0.014743-0.12420.450743
53-0.122592-1.0330.15256
540.0268540.22630.410819
55-0.082316-0.69360.245097
560.0176360.14860.441144
570.0561390.4730.318819
58-0.049085-0.41360.340206
59-0.001658-0.0140.494448
600.0406680.34270.366428


Partial Autocorrelation Function
Time lag kPACF(k)T-STATP-value
10.0694710.58540.280077
2-0.050713-0.42730.335223
3-0.056132-0.4730.318839
40.0758980.63950.262269
50.0291340.24550.403394
6-0.005939-0.050.480113
70.0208710.17590.430452
80.051390.4330.333158
90.1786741.50550.068311
10-0.151874-1.27970.102406
110.0289410.24390.40402
12-0.249419-2.10160.019567
13-0.003898-0.03280.486946
140.1688981.42320.079535
15-0.012103-0.1020.459528
160.0279440.23550.407264
17-0.106328-0.89590.186657
180.1106230.93210.177215
190.0939760.79190.215541
200.0161080.13570.446212
210.1371021.15520.125932
22-0.058652-0.49420.31134
230.1846351.55580.062106
24-0.212504-1.79060.038811
25-0.131577-1.10870.135653
26-0.18994-1.60050.056968
27-0.006352-0.05350.478734
28-0.011277-0.0950.462284
290.0860990.72550.23527
30-0.051772-0.43620.331994
310.0046710.03940.484357
320.0444040.37420.354702
330.0105230.08870.464799
34-0.015508-0.13070.448201
350.0472010.39770.346015
36-0.151567-1.27710.102859
370.0321820.27120.393523
380.0196320.16540.434542
39-0.060869-0.51290.304808
400.0300460.25320.400434
41-0.05515-0.46470.321785
42-0.063694-0.53670.296579
430.0097170.08190.467486
44-0.081387-0.68580.247542
45-0.03148-0.26530.39579
46-0.03616-0.30470.380746
47-0.043613-0.36750.357173
48-0.006135-0.05170.47946
49-0.039918-0.33640.368797
500.0637470.53710.296426
51-0.110619-0.93210.177223
52-0.100024-0.84280.20108
530.0391030.32950.37138
540.0164490.13860.445079
55-0.063321-0.53360.297659
56-0.011499-0.09690.461543
570.0123860.10440.458586
58-0.045086-0.37990.352576
59-0.071546-0.60290.274263
600.0988280.83270.203892

\begin{tabular}{lllllllll}
\hline
Partial Autocorrelation Function \tabularnewline
Time lag k & PACF(k) & T-STAT & P-value \tabularnewline
1 & 0.069471 & 0.5854 & 0.280077 \tabularnewline
2 & -0.050713 & -0.4273 & 0.335223 \tabularnewline
3 & -0.056132 & -0.473 & 0.318839 \tabularnewline
4 & 0.075898 & 0.6395 & 0.262269 \tabularnewline
5 & 0.029134 & 0.2455 & 0.403394 \tabularnewline
6 & -0.005939 & -0.05 & 0.480113 \tabularnewline
7 & 0.020871 & 0.1759 & 0.430452 \tabularnewline
8 & 0.05139 & 0.433 & 0.333158 \tabularnewline
9 & 0.178674 & 1.5055 & 0.068311 \tabularnewline
10 & -0.151874 & -1.2797 & 0.102406 \tabularnewline
11 & 0.028941 & 0.2439 & 0.40402 \tabularnewline
12 & -0.249419 & -2.1016 & 0.019567 \tabularnewline
13 & -0.003898 & -0.0328 & 0.486946 \tabularnewline
14 & 0.168898 & 1.4232 & 0.079535 \tabularnewline
15 & -0.012103 & -0.102 & 0.459528 \tabularnewline
16 & 0.027944 & 0.2355 & 0.407264 \tabularnewline
17 & -0.106328 & -0.8959 & 0.186657 \tabularnewline
18 & 0.110623 & 0.9321 & 0.177215 \tabularnewline
19 & 0.093976 & 0.7919 & 0.215541 \tabularnewline
20 & 0.016108 & 0.1357 & 0.446212 \tabularnewline
21 & 0.137102 & 1.1552 & 0.125932 \tabularnewline
22 & -0.058652 & -0.4942 & 0.31134 \tabularnewline
23 & 0.184635 & 1.5558 & 0.062106 \tabularnewline
24 & -0.212504 & -1.7906 & 0.038811 \tabularnewline
25 & -0.131577 & -1.1087 & 0.135653 \tabularnewline
26 & -0.18994 & -1.6005 & 0.056968 \tabularnewline
27 & -0.006352 & -0.0535 & 0.478734 \tabularnewline
28 & -0.011277 & -0.095 & 0.462284 \tabularnewline
29 & 0.086099 & 0.7255 & 0.23527 \tabularnewline
30 & -0.051772 & -0.4362 & 0.331994 \tabularnewline
31 & 0.004671 & 0.0394 & 0.484357 \tabularnewline
32 & 0.044404 & 0.3742 & 0.354702 \tabularnewline
33 & 0.010523 & 0.0887 & 0.464799 \tabularnewline
34 & -0.015508 & -0.1307 & 0.448201 \tabularnewline
35 & 0.047201 & 0.3977 & 0.346015 \tabularnewline
36 & -0.151567 & -1.2771 & 0.102859 \tabularnewline
37 & 0.032182 & 0.2712 & 0.393523 \tabularnewline
38 & 0.019632 & 0.1654 & 0.434542 \tabularnewline
39 & -0.060869 & -0.5129 & 0.304808 \tabularnewline
40 & 0.030046 & 0.2532 & 0.400434 \tabularnewline
41 & -0.05515 & -0.4647 & 0.321785 \tabularnewline
42 & -0.063694 & -0.5367 & 0.296579 \tabularnewline
43 & 0.009717 & 0.0819 & 0.467486 \tabularnewline
44 & -0.081387 & -0.6858 & 0.247542 \tabularnewline
45 & -0.03148 & -0.2653 & 0.39579 \tabularnewline
46 & -0.03616 & -0.3047 & 0.380746 \tabularnewline
47 & -0.043613 & -0.3675 & 0.357173 \tabularnewline
48 & -0.006135 & -0.0517 & 0.47946 \tabularnewline
49 & -0.039918 & -0.3364 & 0.368797 \tabularnewline
50 & 0.063747 & 0.5371 & 0.296426 \tabularnewline
51 & -0.110619 & -0.9321 & 0.177223 \tabularnewline
52 & -0.100024 & -0.8428 & 0.20108 \tabularnewline
53 & 0.039103 & 0.3295 & 0.37138 \tabularnewline
54 & 0.016449 & 0.1386 & 0.445079 \tabularnewline
55 & -0.063321 & -0.5336 & 0.297659 \tabularnewline
56 & -0.011499 & -0.0969 & 0.461543 \tabularnewline
57 & 0.012386 & 0.1044 & 0.458586 \tabularnewline
58 & -0.045086 & -0.3799 & 0.352576 \tabularnewline
59 & -0.071546 & -0.6029 & 0.274263 \tabularnewline
60 & 0.098828 & 0.8327 & 0.203892 \tabularnewline
\hline
\end{tabular}
%Source: https://freestatistics.org/blog/index.php?pk=70026&T=2

[TABLE]
[ROW][C]Partial Autocorrelation Function[/C][/ROW]
[ROW][C]Time lag k[/C][C]PACF(k)[/C][C]T-STAT[/C][C]P-value[/C][/ROW]
[ROW][C]1[/C][C]0.069471[/C][C]0.5854[/C][C]0.280077[/C][/ROW]
[ROW][C]2[/C][C]-0.050713[/C][C]-0.4273[/C][C]0.335223[/C][/ROW]
[ROW][C]3[/C][C]-0.056132[/C][C]-0.473[/C][C]0.318839[/C][/ROW]
[ROW][C]4[/C][C]0.075898[/C][C]0.6395[/C][C]0.262269[/C][/ROW]
[ROW][C]5[/C][C]0.029134[/C][C]0.2455[/C][C]0.403394[/C][/ROW]
[ROW][C]6[/C][C]-0.005939[/C][C]-0.05[/C][C]0.480113[/C][/ROW]
[ROW][C]7[/C][C]0.020871[/C][C]0.1759[/C][C]0.430452[/C][/ROW]
[ROW][C]8[/C][C]0.05139[/C][C]0.433[/C][C]0.333158[/C][/ROW]
[ROW][C]9[/C][C]0.178674[/C][C]1.5055[/C][C]0.068311[/C][/ROW]
[ROW][C]10[/C][C]-0.151874[/C][C]-1.2797[/C][C]0.102406[/C][/ROW]
[ROW][C]11[/C][C]0.028941[/C][C]0.2439[/C][C]0.40402[/C][/ROW]
[ROW][C]12[/C][C]-0.249419[/C][C]-2.1016[/C][C]0.019567[/C][/ROW]
[ROW][C]13[/C][C]-0.003898[/C][C]-0.0328[/C][C]0.486946[/C][/ROW]
[ROW][C]14[/C][C]0.168898[/C][C]1.4232[/C][C]0.079535[/C][/ROW]
[ROW][C]15[/C][C]-0.012103[/C][C]-0.102[/C][C]0.459528[/C][/ROW]
[ROW][C]16[/C][C]0.027944[/C][C]0.2355[/C][C]0.407264[/C][/ROW]
[ROW][C]17[/C][C]-0.106328[/C][C]-0.8959[/C][C]0.186657[/C][/ROW]
[ROW][C]18[/C][C]0.110623[/C][C]0.9321[/C][C]0.177215[/C][/ROW]
[ROW][C]19[/C][C]0.093976[/C][C]0.7919[/C][C]0.215541[/C][/ROW]
[ROW][C]20[/C][C]0.016108[/C][C]0.1357[/C][C]0.446212[/C][/ROW]
[ROW][C]21[/C][C]0.137102[/C][C]1.1552[/C][C]0.125932[/C][/ROW]
[ROW][C]22[/C][C]-0.058652[/C][C]-0.4942[/C][C]0.31134[/C][/ROW]
[ROW][C]23[/C][C]0.184635[/C][C]1.5558[/C][C]0.062106[/C][/ROW]
[ROW][C]24[/C][C]-0.212504[/C][C]-1.7906[/C][C]0.038811[/C][/ROW]
[ROW][C]25[/C][C]-0.131577[/C][C]-1.1087[/C][C]0.135653[/C][/ROW]
[ROW][C]26[/C][C]-0.18994[/C][C]-1.6005[/C][C]0.056968[/C][/ROW]
[ROW][C]27[/C][C]-0.006352[/C][C]-0.0535[/C][C]0.478734[/C][/ROW]
[ROW][C]28[/C][C]-0.011277[/C][C]-0.095[/C][C]0.462284[/C][/ROW]
[ROW][C]29[/C][C]0.086099[/C][C]0.7255[/C][C]0.23527[/C][/ROW]
[ROW][C]30[/C][C]-0.051772[/C][C]-0.4362[/C][C]0.331994[/C][/ROW]
[ROW][C]31[/C][C]0.004671[/C][C]0.0394[/C][C]0.484357[/C][/ROW]
[ROW][C]32[/C][C]0.044404[/C][C]0.3742[/C][C]0.354702[/C][/ROW]
[ROW][C]33[/C][C]0.010523[/C][C]0.0887[/C][C]0.464799[/C][/ROW]
[ROW][C]34[/C][C]-0.015508[/C][C]-0.1307[/C][C]0.448201[/C][/ROW]
[ROW][C]35[/C][C]0.047201[/C][C]0.3977[/C][C]0.346015[/C][/ROW]
[ROW][C]36[/C][C]-0.151567[/C][C]-1.2771[/C][C]0.102859[/C][/ROW]
[ROW][C]37[/C][C]0.032182[/C][C]0.2712[/C][C]0.393523[/C][/ROW]
[ROW][C]38[/C][C]0.019632[/C][C]0.1654[/C][C]0.434542[/C][/ROW]
[ROW][C]39[/C][C]-0.060869[/C][C]-0.5129[/C][C]0.304808[/C][/ROW]
[ROW][C]40[/C][C]0.030046[/C][C]0.2532[/C][C]0.400434[/C][/ROW]
[ROW][C]41[/C][C]-0.05515[/C][C]-0.4647[/C][C]0.321785[/C][/ROW]
[ROW][C]42[/C][C]-0.063694[/C][C]-0.5367[/C][C]0.296579[/C][/ROW]
[ROW][C]43[/C][C]0.009717[/C][C]0.0819[/C][C]0.467486[/C][/ROW]
[ROW][C]44[/C][C]-0.081387[/C][C]-0.6858[/C][C]0.247542[/C][/ROW]
[ROW][C]45[/C][C]-0.03148[/C][C]-0.2653[/C][C]0.39579[/C][/ROW]
[ROW][C]46[/C][C]-0.03616[/C][C]-0.3047[/C][C]0.380746[/C][/ROW]
[ROW][C]47[/C][C]-0.043613[/C][C]-0.3675[/C][C]0.357173[/C][/ROW]
[ROW][C]48[/C][C]-0.006135[/C][C]-0.0517[/C][C]0.47946[/C][/ROW]
[ROW][C]49[/C][C]-0.039918[/C][C]-0.3364[/C][C]0.368797[/C][/ROW]
[ROW][C]50[/C][C]0.063747[/C][C]0.5371[/C][C]0.296426[/C][/ROW]
[ROW][C]51[/C][C]-0.110619[/C][C]-0.9321[/C][C]0.177223[/C][/ROW]
[ROW][C]52[/C][C]-0.100024[/C][C]-0.8428[/C][C]0.20108[/C][/ROW]
[ROW][C]53[/C][C]0.039103[/C][C]0.3295[/C][C]0.37138[/C][/ROW]
[ROW][C]54[/C][C]0.016449[/C][C]0.1386[/C][C]0.445079[/C][/ROW]
[ROW][C]55[/C][C]-0.063321[/C][C]-0.5336[/C][C]0.297659[/C][/ROW]
[ROW][C]56[/C][C]-0.011499[/C][C]-0.0969[/C][C]0.461543[/C][/ROW]
[ROW][C]57[/C][C]0.012386[/C][C]0.1044[/C][C]0.458586[/C][/ROW]
[ROW][C]58[/C][C]-0.045086[/C][C]-0.3799[/C][C]0.352576[/C][/ROW]
[ROW][C]59[/C][C]-0.071546[/C][C]-0.6029[/C][C]0.274263[/C][/ROW]
[ROW][C]60[/C][C]0.098828[/C][C]0.8327[/C][C]0.203892[/C][/ROW]
[/TABLE]
Source: https://freestatistics.org/blog/index.php?pk=70026&T=2

Globally Unique Identifier (entire table): ba.freestatistics.org/blog/index.php?pk=70026&T=2

As an alternative you can also use a QR Code:  

The GUIDs for individual cells are displayed in the table below:

Partial Autocorrelation Function
Time lag kPACF(k)T-STATP-value
10.0694710.58540.280077
2-0.050713-0.42730.335223
3-0.056132-0.4730.318839
40.0758980.63950.262269
50.0291340.24550.403394
6-0.005939-0.050.480113
70.0208710.17590.430452
80.051390.4330.333158
90.1786741.50550.068311
10-0.151874-1.27970.102406
110.0289410.24390.40402
12-0.249419-2.10160.019567
13-0.003898-0.03280.486946
140.1688981.42320.079535
15-0.012103-0.1020.459528
160.0279440.23550.407264
17-0.106328-0.89590.186657
180.1106230.93210.177215
190.0939760.79190.215541
200.0161080.13570.446212
210.1371021.15520.125932
22-0.058652-0.49420.31134
230.1846351.55580.062106
24-0.212504-1.79060.038811
25-0.131577-1.10870.135653
26-0.18994-1.60050.056968
27-0.006352-0.05350.478734
28-0.011277-0.0950.462284
290.0860990.72550.23527
30-0.051772-0.43620.331994
310.0046710.03940.484357
320.0444040.37420.354702
330.0105230.08870.464799
34-0.015508-0.13070.448201
350.0472010.39770.346015
36-0.151567-1.27710.102859
370.0321820.27120.393523
380.0196320.16540.434542
39-0.060869-0.51290.304808
400.0300460.25320.400434
41-0.05515-0.46470.321785
42-0.063694-0.53670.296579
430.0097170.08190.467486
44-0.081387-0.68580.247542
45-0.03148-0.26530.39579
46-0.03616-0.30470.380746
47-0.043613-0.36750.357173
48-0.006135-0.05170.47946
49-0.039918-0.33640.368797
500.0637470.53710.296426
51-0.110619-0.93210.177223
52-0.100024-0.84280.20108
530.0391030.32950.37138
540.0164490.13860.445079
55-0.063321-0.53360.297659
56-0.011499-0.09690.461543
570.0123860.10440.458586
58-0.045086-0.37990.352576
59-0.071546-0.60290.274263
600.0988280.83270.203892


Parameters (Session):
par1 = 60 ; par2 = 1 ; par3 = 1 ; par4 = 0 ; par5 = 12 ; par6 = White Noise ;
Parameters (R input):
par1 = 60 ; par2 = 1 ; par3 = 1 ; par4 = 1 ; par5 = 12 ; par6 = White Noise ; par7 = ;
R code (references can be found in the software module):
if (par1 == 'Default') {
par1 = 10*log10(length(x))
} else {
par1 <- as.numeric(par1)
}
par2 <- as.numeric(par2)
par3 <- as.numeric(par3)
par4 <- as.numeric(par4)
par5 <- as.numeric(par5)
if (par2 == 0) {
x <- log(x)
} else {
x <- (x ^ par2 - 1) / par2
}
if (par3 > 0) x <- diff(x,lag=1,difference=par3)
if (par4 > 0) x <- diff(x,lag=par5,difference=par4)
bitmap(file='pic1.png')
racf <- acf(x,par1,main='Autocorrelation',xlab='lags',ylab='ACF')
dev.off()
bitmap(file='pic2.png')
rpacf <- pacf(x,par1,main='Partial Autocorrelation',xlab='lags',ylab='PACF')
dev.off()
(myacf <- c(racf$acf))
(mypacf <- c(rpacf$acf))
lengthx <- length(x)
sqrtn <- sqrt(lengthx)
load(file='createtable')
a<-table.start()
a<-table.row.start(a)
a<-table.element(a,'Autocorrelation Function',4,TRUE)
a<-table.row.end(a)
a<-table.row.start(a)
a<-table.element(a,'Time lag k',header=TRUE)
a<-table.element(a,hyperlink('basics.htm','ACF(k)','click here for more information about the Autocorrelation Function'),header=TRUE)
a<-table.element(a,'T-STAT',header=TRUE)
a<-table.element(a,'P-value',header=TRUE)
a<-table.row.end(a)
for (i in 2:(par1+1)) {
a<-table.row.start(a)
a<-table.element(a,i-1,header=TRUE)
a<-table.element(a,round(myacf[i],6))
mytstat <- myacf[i]*sqrtn
a<-table.element(a,round(mytstat,4))
a<-table.element(a,round(1-pt(abs(mytstat),lengthx),6))
a<-table.row.end(a)
}
a<-table.end(a)
table.save(a,file='mytable.tab')
a<-table.start()
a<-table.row.start(a)
a<-table.element(a,'Partial Autocorrelation Function',4,TRUE)
a<-table.row.end(a)
a<-table.row.start(a)
a<-table.element(a,'Time lag k',header=TRUE)
a<-table.element(a,hyperlink('basics.htm','PACF(k)','click here for more information about the Partial Autocorrelation Function'),header=TRUE)
a<-table.element(a,'T-STAT',header=TRUE)
a<-table.element(a,'P-value',header=TRUE)
a<-table.row.end(a)
for (i in 1:par1) {
a<-table.row.start(a)
a<-table.element(a,i,header=TRUE)
a<-table.element(a,round(mypacf[i],6))
mytstat <- mypacf[i]*sqrtn
a<-table.element(a,round(mytstat,4))
a<-table.element(a,round(1-pt(abs(mytstat),lengthx),6))
a<-table.row.end(a)
}
a<-table.end(a)
table.save(a,file='mytable1.tab')