Free Statistics

of Irreproducible Research!

Author's title

Author*The author of this computation has been verified*
R Software Modulerwasp_multipleregression.wasp
Title produced by softwareMultiple Regression
Date of computationThu, 24 Dec 2009 08:38:18 -0700
Cite this page as followsStatistical Computations at FreeStatistics.org, Office for Research Development and Education, URL https://freestatistics.org/blog/index.php?v=date/2009/Dec/24/t12616691553l0fhxdn5ujjpjg.htm/, Retrieved Mon, 06 May 2024 08:17:40 +0000
Statistical Computations at FreeStatistics.org, Office for Research Development and Education, URL https://freestatistics.org/blog/index.php?pk=70666, Retrieved Mon, 06 May 2024 08:17:40 +0000
QR Codes:

Original text written by user:
IsPrivate?No (this computation is public)
User-defined keywords
Estimated Impact117
Family? (F = Feedback message, R = changed R code, M = changed R Module, P = changed Parameters, D = changed Data)
-     [Multiple Regression] [Q1 The Seatbeltlaw] [2007-11-14 19:27:43] [8cd6641b921d30ebe00b648d1481bba0]
- RMPD  [Multiple Regression] [Seatbelt] [2009-11-12 13:54:52] [b98453cac15ba1066b407e146608df68]
-    D      [Multiple Regression] [dummy variabele m...] [2009-12-24 15:38:18] [454b2df2fae01897bad5ff38ed3cc924] [Current]
Feedback Forum

Post a new message
Dataseries X:
8,7	0
8,2	0
8,3	0
8,5	0
8,6	0
8,5	0
8,2	0
8,1	0
7,9	0
8,6	0
8,7	0
8,7	0
8,5	0
8,4	0
8,5	0
8,7	0
8,7	0
8,6	0
8,5	0
8,3	0
8	0
8,2	0
8,1	0
8,1	0
8	0
7,9	0
7,9	0
8	0
8	0
7,9	0
8	0
7,7	0
7,2	0
7,5	0
7,3	0
7	0
7	0
7	0
7,2	0
7,3	0
7,1	0
6,8	0
6,4	0
6,1	0
6,5	0
7,7	0
7,9	0
7,5	1
6,9	1
6,6	1
6,9	1
7,7	1
8	1
8	1
7,7	1
7,3	1
7,4	1
8,1	1
8,3	1
8,2	1


Summary of computational transaction
Raw Inputview raw input (R code)
Raw Outputview raw output of R engine
Computing time5 seconds
R Server'Gwilym Jenkins' @ 72.249.127.135

\begin{tabular}{lllllllll}
\hline
Summary of computational transaction \tabularnewline
Raw Input & view raw input (R code)  \tabularnewline
Raw Output & view raw output of R engine  \tabularnewline
Computing time & 5 seconds \tabularnewline
R Server & 'Gwilym Jenkins' @ 72.249.127.135 \tabularnewline
\hline
\end{tabular}
%Source: https://freestatistics.org/blog/index.php?pk=70666&T=0

[TABLE]
[ROW][C]Summary of computational transaction[/C][/ROW]
[ROW][C]Raw Input[/C][C]view raw input (R code) [/C][/ROW]
[ROW][C]Raw Output[/C][C]view raw output of R engine [/C][/ROW]
[ROW][C]Computing time[/C][C]5 seconds[/C][/ROW]
[ROW][C]R Server[/C][C]'Gwilym Jenkins' @ 72.249.127.135[/C][/ROW]
[/TABLE]
Source: https://freestatistics.org/blog/index.php?pk=70666&T=0

Globally Unique Identifier (entire table): ba.freestatistics.org/blog/index.php?pk=70666&T=0

As an alternative you can also use a QR Code:  

The GUIDs for individual cells are displayed in the table below:

Summary of computational transaction
Raw Inputview raw input (R code)
Raw Outputview raw output of R engine
Computing time5 seconds
R Server'Gwilym Jenkins' @ 72.249.127.135


Multiple Linear Regression - Estimated Regression Equation
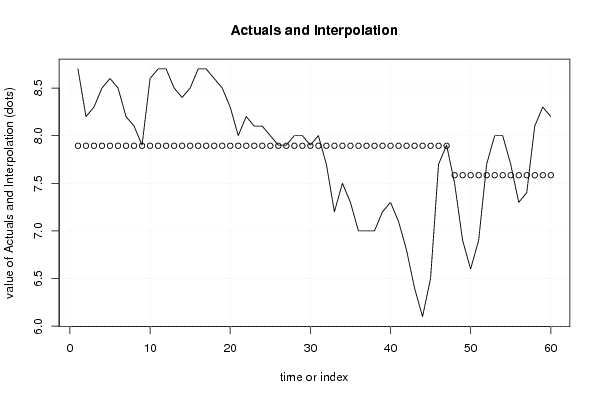
Y[t] = + 7.89361702127659 -0.30900163666121X[t] + e[t]

\begin{tabular}{lllllllll}
\hline
Multiple Linear Regression - Estimated Regression Equation \tabularnewline
Y[t] =  +  7.89361702127659 -0.30900163666121X[t]  + e[t] \tabularnewline
\hline
\end{tabular}
%Source: https://freestatistics.org/blog/index.php?pk=70666&T=1

[TABLE]
[ROW][C]Multiple Linear Regression - Estimated Regression Equation[/C][/ROW]
[ROW][C]Y[t] =  +  7.89361702127659 -0.30900163666121X[t]  + e[t][/C][/ROW]
[/TABLE]
Source: https://freestatistics.org/blog/index.php?pk=70666&T=1

Globally Unique Identifier (entire table): ba.freestatistics.org/blog/index.php?pk=70666&T=1

As an alternative you can also use a QR Code:  

The GUIDs for individual cells are displayed in the table below:

Multiple Linear Regression - Estimated Regression Equation
Y[t] = + 7.89361702127659 -0.30900163666121X[t] + e[t]


Multiple Linear Regression - Ordinary Least Squares
VariableParameterS.D.T-STATH0: parameter = 02-tail p-value1-tail p-value
(Intercept)7.893617021276590.09519882.917600
X-0.309001636661210.204519-1.51090.1362510.068125

\begin{tabular}{lllllllll}
\hline
Multiple Linear Regression - Ordinary Least Squares \tabularnewline
Variable & Parameter & S.D. & T-STATH0: parameter = 0 & 2-tail p-value & 1-tail p-value \tabularnewline
(Intercept) & 7.89361702127659 & 0.095198 & 82.9176 & 0 & 0 \tabularnewline
X & -0.30900163666121 & 0.204519 & -1.5109 & 0.136251 & 0.068125 \tabularnewline
\hline
\end{tabular}
%Source: https://freestatistics.org/blog/index.php?pk=70666&T=2

[TABLE]
[ROW][C]Multiple Linear Regression - Ordinary Least Squares[/C][/ROW]
[ROW][C]Variable[/C][C]Parameter[/C][C]S.D.[/C][C]T-STATH0: parameter = 0[/C][C]2-tail p-value[/C][C]1-tail p-value[/C][/ROW]
[ROW][C](Intercept)[/C][C]7.89361702127659[/C][C]0.095198[/C][C]82.9176[/C][C]0[/C][C]0[/C][/ROW]
[ROW][C]X[/C][C]-0.30900163666121[/C][C]0.204519[/C][C]-1.5109[/C][C]0.136251[/C][C]0.068125[/C][/ROW]
[/TABLE]
Source: https://freestatistics.org/blog/index.php?pk=70666&T=2

Globally Unique Identifier (entire table): ba.freestatistics.org/blog/index.php?pk=70666&T=2

As an alternative you can also use a QR Code:  

The GUIDs for individual cells are displayed in the table below:

Multiple Linear Regression - Ordinary Least Squares
VariableParameterS.D.T-STATH0: parameter = 02-tail p-value1-tail p-value
(Intercept)7.893617021276590.09519882.917600
X-0.309001636661210.204519-1.51090.1362510.068125


Multiple Linear Regression - Regression Statistics
Multiple R0.194594607049005
R-squared0.0378670610925569
Adjusted R-squared0.0212785621458769
F-TEST (value)2.28272981264139
F-TEST (DF numerator)1
F-TEST (DF denominator)58
p-value0.136250865363998
Multiple Linear Regression - Residual Statistics
Residual Standard Deviation0.65264723775831
Sum Squared Residuals24.705008183306

\begin{tabular}{lllllllll}
\hline
Multiple Linear Regression - Regression Statistics \tabularnewline
Multiple R & 0.194594607049005 \tabularnewline
R-squared & 0.0378670610925569 \tabularnewline
Adjusted R-squared & 0.0212785621458769 \tabularnewline
F-TEST (value) & 2.28272981264139 \tabularnewline
F-TEST (DF numerator) & 1 \tabularnewline
F-TEST (DF denominator) & 58 \tabularnewline
p-value & 0.136250865363998 \tabularnewline
Multiple Linear Regression - Residual Statistics \tabularnewline
Residual Standard Deviation & 0.65264723775831 \tabularnewline
Sum Squared Residuals & 24.705008183306 \tabularnewline
\hline
\end{tabular}
%Source: https://freestatistics.org/blog/index.php?pk=70666&T=3

[TABLE]
[ROW][C]Multiple Linear Regression - Regression Statistics[/C][/ROW]
[ROW][C]Multiple R[/C][C]0.194594607049005[/C][/ROW]
[ROW][C]R-squared[/C][C]0.0378670610925569[/C][/ROW]
[ROW][C]Adjusted R-squared[/C][C]0.0212785621458769[/C][/ROW]
[ROW][C]F-TEST (value)[/C][C]2.28272981264139[/C][/ROW]
[ROW][C]F-TEST (DF numerator)[/C][C]1[/C][/ROW]
[ROW][C]F-TEST (DF denominator)[/C][C]58[/C][/ROW]
[ROW][C]p-value[/C][C]0.136250865363998[/C][/ROW]
[ROW][C]Multiple Linear Regression - Residual Statistics[/C][/ROW]
[ROW][C]Residual Standard Deviation[/C][C]0.65264723775831[/C][/ROW]
[ROW][C]Sum Squared Residuals[/C][C]24.705008183306[/C][/ROW]
[/TABLE]
Source: https://freestatistics.org/blog/index.php?pk=70666&T=3

Globally Unique Identifier (entire table): ba.freestatistics.org/blog/index.php?pk=70666&T=3

As an alternative you can also use a QR Code:  

The GUIDs for individual cells are displayed in the table below:

Multiple Linear Regression - Regression Statistics
Multiple R0.194594607049005
R-squared0.0378670610925569
Adjusted R-squared0.0212785621458769
F-TEST (value)2.28272981264139
F-TEST (DF numerator)1
F-TEST (DF denominator)58
p-value0.136250865363998
Multiple Linear Regression - Residual Statistics
Residual Standard Deviation0.65264723775831
Sum Squared Residuals24.705008183306


Multiple Linear Regression - Actuals, Interpolation, and Residuals
Time or IndexActualsInterpolationForecastResidualsPrediction Error
18.77.893617021276630.806382978723372
28.27.89361702127660.306382978723404
38.37.89361702127660.406382978723406
48.57.89361702127660.606382978723405
58.67.89361702127660.706382978723405
68.57.89361702127660.606382978723405
78.27.89361702127660.306382978723404
88.17.89361702127660.206382978723405
97.97.89361702127660.00638297872340536
108.67.89361702127660.706382978723405
118.77.89361702127660.806382978723404
128.77.89361702127660.806382978723404
138.57.89361702127660.606382978723405
148.47.89361702127660.506382978723405
158.57.89361702127660.606382978723405
168.77.89361702127660.806382978723404
178.77.89361702127660.806382978723404
188.67.89361702127660.706382978723405
198.57.89361702127660.606382978723405
208.37.89361702127660.406382978723406
2187.89361702127660.106382978723405
228.27.89361702127660.306382978723404
238.17.89361702127660.206382978723405
248.17.89361702127660.206382978723405
2587.89361702127660.106382978723405
267.97.89361702127660.00638297872340536
277.97.89361702127660.00638297872340536
2887.89361702127660.106382978723405
2987.89361702127660.106382978723405
307.97.89361702127660.00638297872340536
3187.89361702127660.106382978723405
327.77.8936170212766-0.193617021276595
337.27.8936170212766-0.693617021276595
347.57.8936170212766-0.393617021276595
357.37.8936170212766-0.593617021276595
3677.8936170212766-0.893617021276595
3777.8936170212766-0.893617021276595
3877.8936170212766-0.893617021276595
397.27.8936170212766-0.693617021276595
407.37.8936170212766-0.593617021276595
417.17.8936170212766-0.793617021276595
426.87.8936170212766-1.09361702127660
436.47.8936170212766-1.49361702127659
446.17.8936170212766-1.79361702127660
456.57.8936170212766-1.39361702127660
467.77.8936170212766-0.193617021276595
477.97.89361702127660.00638297872340536
487.57.58461538461538-0.0846153846153846
496.97.58461538461538-0.684615384615384
506.67.58461538461538-0.984615384615385
516.97.58461538461538-0.684615384615384
527.77.584615384615380.115384615384616
5387.584615384615380.415384615384615
5487.584615384615380.415384615384615
557.77.584615384615380.115384615384616
567.37.58461538461538-0.284615384615385
577.47.58461538461538-0.184615384615384
588.17.584615384615380.515384615384615
598.37.584615384615380.715384615384616
608.27.584615384615380.615384615384615

\begin{tabular}{lllllllll}
\hline
Multiple Linear Regression - Actuals, Interpolation, and Residuals \tabularnewline
Time or Index & Actuals & InterpolationForecast & ResidualsPrediction Error \tabularnewline
1 & 8.7 & 7.89361702127663 & 0.806382978723372 \tabularnewline
2 & 8.2 & 7.8936170212766 & 0.306382978723404 \tabularnewline
3 & 8.3 & 7.8936170212766 & 0.406382978723406 \tabularnewline
4 & 8.5 & 7.8936170212766 & 0.606382978723405 \tabularnewline
5 & 8.6 & 7.8936170212766 & 0.706382978723405 \tabularnewline
6 & 8.5 & 7.8936170212766 & 0.606382978723405 \tabularnewline
7 & 8.2 & 7.8936170212766 & 0.306382978723404 \tabularnewline
8 & 8.1 & 7.8936170212766 & 0.206382978723405 \tabularnewline
9 & 7.9 & 7.8936170212766 & 0.00638297872340536 \tabularnewline
10 & 8.6 & 7.8936170212766 & 0.706382978723405 \tabularnewline
11 & 8.7 & 7.8936170212766 & 0.806382978723404 \tabularnewline
12 & 8.7 & 7.8936170212766 & 0.806382978723404 \tabularnewline
13 & 8.5 & 7.8936170212766 & 0.606382978723405 \tabularnewline
14 & 8.4 & 7.8936170212766 & 0.506382978723405 \tabularnewline
15 & 8.5 & 7.8936170212766 & 0.606382978723405 \tabularnewline
16 & 8.7 & 7.8936170212766 & 0.806382978723404 \tabularnewline
17 & 8.7 & 7.8936170212766 & 0.806382978723404 \tabularnewline
18 & 8.6 & 7.8936170212766 & 0.706382978723405 \tabularnewline
19 & 8.5 & 7.8936170212766 & 0.606382978723405 \tabularnewline
20 & 8.3 & 7.8936170212766 & 0.406382978723406 \tabularnewline
21 & 8 & 7.8936170212766 & 0.106382978723405 \tabularnewline
22 & 8.2 & 7.8936170212766 & 0.306382978723404 \tabularnewline
23 & 8.1 & 7.8936170212766 & 0.206382978723405 \tabularnewline
24 & 8.1 & 7.8936170212766 & 0.206382978723405 \tabularnewline
25 & 8 & 7.8936170212766 & 0.106382978723405 \tabularnewline
26 & 7.9 & 7.8936170212766 & 0.00638297872340536 \tabularnewline
27 & 7.9 & 7.8936170212766 & 0.00638297872340536 \tabularnewline
28 & 8 & 7.8936170212766 & 0.106382978723405 \tabularnewline
29 & 8 & 7.8936170212766 & 0.106382978723405 \tabularnewline
30 & 7.9 & 7.8936170212766 & 0.00638297872340536 \tabularnewline
31 & 8 & 7.8936170212766 & 0.106382978723405 \tabularnewline
32 & 7.7 & 7.8936170212766 & -0.193617021276595 \tabularnewline
33 & 7.2 & 7.8936170212766 & -0.693617021276595 \tabularnewline
34 & 7.5 & 7.8936170212766 & -0.393617021276595 \tabularnewline
35 & 7.3 & 7.8936170212766 & -0.593617021276595 \tabularnewline
36 & 7 & 7.8936170212766 & -0.893617021276595 \tabularnewline
37 & 7 & 7.8936170212766 & -0.893617021276595 \tabularnewline
38 & 7 & 7.8936170212766 & -0.893617021276595 \tabularnewline
39 & 7.2 & 7.8936170212766 & -0.693617021276595 \tabularnewline
40 & 7.3 & 7.8936170212766 & -0.593617021276595 \tabularnewline
41 & 7.1 & 7.8936170212766 & -0.793617021276595 \tabularnewline
42 & 6.8 & 7.8936170212766 & -1.09361702127660 \tabularnewline
43 & 6.4 & 7.8936170212766 & -1.49361702127659 \tabularnewline
44 & 6.1 & 7.8936170212766 & -1.79361702127660 \tabularnewline
45 & 6.5 & 7.8936170212766 & -1.39361702127660 \tabularnewline
46 & 7.7 & 7.8936170212766 & -0.193617021276595 \tabularnewline
47 & 7.9 & 7.8936170212766 & 0.00638297872340536 \tabularnewline
48 & 7.5 & 7.58461538461538 & -0.0846153846153846 \tabularnewline
49 & 6.9 & 7.58461538461538 & -0.684615384615384 \tabularnewline
50 & 6.6 & 7.58461538461538 & -0.984615384615385 \tabularnewline
51 & 6.9 & 7.58461538461538 & -0.684615384615384 \tabularnewline
52 & 7.7 & 7.58461538461538 & 0.115384615384616 \tabularnewline
53 & 8 & 7.58461538461538 & 0.415384615384615 \tabularnewline
54 & 8 & 7.58461538461538 & 0.415384615384615 \tabularnewline
55 & 7.7 & 7.58461538461538 & 0.115384615384616 \tabularnewline
56 & 7.3 & 7.58461538461538 & -0.284615384615385 \tabularnewline
57 & 7.4 & 7.58461538461538 & -0.184615384615384 \tabularnewline
58 & 8.1 & 7.58461538461538 & 0.515384615384615 \tabularnewline
59 & 8.3 & 7.58461538461538 & 0.715384615384616 \tabularnewline
60 & 8.2 & 7.58461538461538 & 0.615384615384615 \tabularnewline
\hline
\end{tabular}
%Source: https://freestatistics.org/blog/index.php?pk=70666&T=4

[TABLE]
[ROW][C]Multiple Linear Regression - Actuals, Interpolation, and Residuals[/C][/ROW]
[ROW][C]Time or Index[/C][C]Actuals[/C][C]InterpolationForecast[/C][C]ResidualsPrediction Error[/C][/ROW]
[ROW][C]1[/C][C]8.7[/C][C]7.89361702127663[/C][C]0.806382978723372[/C][/ROW]
[ROW][C]2[/C][C]8.2[/C][C]7.8936170212766[/C][C]0.306382978723404[/C][/ROW]
[ROW][C]3[/C][C]8.3[/C][C]7.8936170212766[/C][C]0.406382978723406[/C][/ROW]
[ROW][C]4[/C][C]8.5[/C][C]7.8936170212766[/C][C]0.606382978723405[/C][/ROW]
[ROW][C]5[/C][C]8.6[/C][C]7.8936170212766[/C][C]0.706382978723405[/C][/ROW]
[ROW][C]6[/C][C]8.5[/C][C]7.8936170212766[/C][C]0.606382978723405[/C][/ROW]
[ROW][C]7[/C][C]8.2[/C][C]7.8936170212766[/C][C]0.306382978723404[/C][/ROW]
[ROW][C]8[/C][C]8.1[/C][C]7.8936170212766[/C][C]0.206382978723405[/C][/ROW]
[ROW][C]9[/C][C]7.9[/C][C]7.8936170212766[/C][C]0.00638297872340536[/C][/ROW]
[ROW][C]10[/C][C]8.6[/C][C]7.8936170212766[/C][C]0.706382978723405[/C][/ROW]
[ROW][C]11[/C][C]8.7[/C][C]7.8936170212766[/C][C]0.806382978723404[/C][/ROW]
[ROW][C]12[/C][C]8.7[/C][C]7.8936170212766[/C][C]0.806382978723404[/C][/ROW]
[ROW][C]13[/C][C]8.5[/C][C]7.8936170212766[/C][C]0.606382978723405[/C][/ROW]
[ROW][C]14[/C][C]8.4[/C][C]7.8936170212766[/C][C]0.506382978723405[/C][/ROW]
[ROW][C]15[/C][C]8.5[/C][C]7.8936170212766[/C][C]0.606382978723405[/C][/ROW]
[ROW][C]16[/C][C]8.7[/C][C]7.8936170212766[/C][C]0.806382978723404[/C][/ROW]
[ROW][C]17[/C][C]8.7[/C][C]7.8936170212766[/C][C]0.806382978723404[/C][/ROW]
[ROW][C]18[/C][C]8.6[/C][C]7.8936170212766[/C][C]0.706382978723405[/C][/ROW]
[ROW][C]19[/C][C]8.5[/C][C]7.8936170212766[/C][C]0.606382978723405[/C][/ROW]
[ROW][C]20[/C][C]8.3[/C][C]7.8936170212766[/C][C]0.406382978723406[/C][/ROW]
[ROW][C]21[/C][C]8[/C][C]7.8936170212766[/C][C]0.106382978723405[/C][/ROW]
[ROW][C]22[/C][C]8.2[/C][C]7.8936170212766[/C][C]0.306382978723404[/C][/ROW]
[ROW][C]23[/C][C]8.1[/C][C]7.8936170212766[/C][C]0.206382978723405[/C][/ROW]
[ROW][C]24[/C][C]8.1[/C][C]7.8936170212766[/C][C]0.206382978723405[/C][/ROW]
[ROW][C]25[/C][C]8[/C][C]7.8936170212766[/C][C]0.106382978723405[/C][/ROW]
[ROW][C]26[/C][C]7.9[/C][C]7.8936170212766[/C][C]0.00638297872340536[/C][/ROW]
[ROW][C]27[/C][C]7.9[/C][C]7.8936170212766[/C][C]0.00638297872340536[/C][/ROW]
[ROW][C]28[/C][C]8[/C][C]7.8936170212766[/C][C]0.106382978723405[/C][/ROW]
[ROW][C]29[/C][C]8[/C][C]7.8936170212766[/C][C]0.106382978723405[/C][/ROW]
[ROW][C]30[/C][C]7.9[/C][C]7.8936170212766[/C][C]0.00638297872340536[/C][/ROW]
[ROW][C]31[/C][C]8[/C][C]7.8936170212766[/C][C]0.106382978723405[/C][/ROW]
[ROW][C]32[/C][C]7.7[/C][C]7.8936170212766[/C][C]-0.193617021276595[/C][/ROW]
[ROW][C]33[/C][C]7.2[/C][C]7.8936170212766[/C][C]-0.693617021276595[/C][/ROW]
[ROW][C]34[/C][C]7.5[/C][C]7.8936170212766[/C][C]-0.393617021276595[/C][/ROW]
[ROW][C]35[/C][C]7.3[/C][C]7.8936170212766[/C][C]-0.593617021276595[/C][/ROW]
[ROW][C]36[/C][C]7[/C][C]7.8936170212766[/C][C]-0.893617021276595[/C][/ROW]
[ROW][C]37[/C][C]7[/C][C]7.8936170212766[/C][C]-0.893617021276595[/C][/ROW]
[ROW][C]38[/C][C]7[/C][C]7.8936170212766[/C][C]-0.893617021276595[/C][/ROW]
[ROW][C]39[/C][C]7.2[/C][C]7.8936170212766[/C][C]-0.693617021276595[/C][/ROW]
[ROW][C]40[/C][C]7.3[/C][C]7.8936170212766[/C][C]-0.593617021276595[/C][/ROW]
[ROW][C]41[/C][C]7.1[/C][C]7.8936170212766[/C][C]-0.793617021276595[/C][/ROW]
[ROW][C]42[/C][C]6.8[/C][C]7.8936170212766[/C][C]-1.09361702127660[/C][/ROW]
[ROW][C]43[/C][C]6.4[/C][C]7.8936170212766[/C][C]-1.49361702127659[/C][/ROW]
[ROW][C]44[/C][C]6.1[/C][C]7.8936170212766[/C][C]-1.79361702127660[/C][/ROW]
[ROW][C]45[/C][C]6.5[/C][C]7.8936170212766[/C][C]-1.39361702127660[/C][/ROW]
[ROW][C]46[/C][C]7.7[/C][C]7.8936170212766[/C][C]-0.193617021276595[/C][/ROW]
[ROW][C]47[/C][C]7.9[/C][C]7.8936170212766[/C][C]0.00638297872340536[/C][/ROW]
[ROW][C]48[/C][C]7.5[/C][C]7.58461538461538[/C][C]-0.0846153846153846[/C][/ROW]
[ROW][C]49[/C][C]6.9[/C][C]7.58461538461538[/C][C]-0.684615384615384[/C][/ROW]
[ROW][C]50[/C][C]6.6[/C][C]7.58461538461538[/C][C]-0.984615384615385[/C][/ROW]
[ROW][C]51[/C][C]6.9[/C][C]7.58461538461538[/C][C]-0.684615384615384[/C][/ROW]
[ROW][C]52[/C][C]7.7[/C][C]7.58461538461538[/C][C]0.115384615384616[/C][/ROW]
[ROW][C]53[/C][C]8[/C][C]7.58461538461538[/C][C]0.415384615384615[/C][/ROW]
[ROW][C]54[/C][C]8[/C][C]7.58461538461538[/C][C]0.415384615384615[/C][/ROW]
[ROW][C]55[/C][C]7.7[/C][C]7.58461538461538[/C][C]0.115384615384616[/C][/ROW]
[ROW][C]56[/C][C]7.3[/C][C]7.58461538461538[/C][C]-0.284615384615385[/C][/ROW]
[ROW][C]57[/C][C]7.4[/C][C]7.58461538461538[/C][C]-0.184615384615384[/C][/ROW]
[ROW][C]58[/C][C]8.1[/C][C]7.58461538461538[/C][C]0.515384615384615[/C][/ROW]
[ROW][C]59[/C][C]8.3[/C][C]7.58461538461538[/C][C]0.715384615384616[/C][/ROW]
[ROW][C]60[/C][C]8.2[/C][C]7.58461538461538[/C][C]0.615384615384615[/C][/ROW]
[/TABLE]
Source: https://freestatistics.org/blog/index.php?pk=70666&T=4

Globally Unique Identifier (entire table): ba.freestatistics.org/blog/index.php?pk=70666&T=4

As an alternative you can also use a QR Code:  

The GUIDs for individual cells are displayed in the table below:

Multiple Linear Regression - Actuals, Interpolation, and Residuals
Time or IndexActualsInterpolationForecastResidualsPrediction Error
18.77.893617021276630.806382978723372
28.27.89361702127660.306382978723404
38.37.89361702127660.406382978723406
48.57.89361702127660.606382978723405
58.67.89361702127660.706382978723405
68.57.89361702127660.606382978723405
78.27.89361702127660.306382978723404
88.17.89361702127660.206382978723405
97.97.89361702127660.00638297872340536
108.67.89361702127660.706382978723405
118.77.89361702127660.806382978723404
128.77.89361702127660.806382978723404
138.57.89361702127660.606382978723405
148.47.89361702127660.506382978723405
158.57.89361702127660.606382978723405
168.77.89361702127660.806382978723404
178.77.89361702127660.806382978723404
188.67.89361702127660.706382978723405
198.57.89361702127660.606382978723405
208.37.89361702127660.406382978723406
2187.89361702127660.106382978723405
228.27.89361702127660.306382978723404
238.17.89361702127660.206382978723405
248.17.89361702127660.206382978723405
2587.89361702127660.106382978723405
267.97.89361702127660.00638297872340536
277.97.89361702127660.00638297872340536
2887.89361702127660.106382978723405
2987.89361702127660.106382978723405
307.97.89361702127660.00638297872340536
3187.89361702127660.106382978723405
327.77.8936170212766-0.193617021276595
337.27.8936170212766-0.693617021276595
347.57.8936170212766-0.393617021276595
357.37.8936170212766-0.593617021276595
3677.8936170212766-0.893617021276595
3777.8936170212766-0.893617021276595
3877.8936170212766-0.893617021276595
397.27.8936170212766-0.693617021276595
407.37.8936170212766-0.593617021276595
417.17.8936170212766-0.793617021276595
426.87.8936170212766-1.09361702127660
436.47.8936170212766-1.49361702127659
446.17.8936170212766-1.79361702127660
456.57.8936170212766-1.39361702127660
467.77.8936170212766-0.193617021276595
477.97.89361702127660.00638297872340536
487.57.58461538461538-0.0846153846153846
496.97.58461538461538-0.684615384615384
506.67.58461538461538-0.984615384615385
516.97.58461538461538-0.684615384615384
527.77.584615384615380.115384615384616
5387.584615384615380.415384615384615
5487.584615384615380.415384615384615
557.77.584615384615380.115384615384616
567.37.58461538461538-0.284615384615385
577.47.58461538461538-0.184615384615384
588.17.584615384615380.515384615384615
598.37.584615384615380.715384615384616
608.27.584615384615380.615384615384615


Goldfeld-Quandt test for Heteroskedasticity
p-valuesAlternative Hypothesis
breakpoint indexgreater2-sidedless
50.06040697718152580.1208139543630520.939593022818474
60.01841536218217900.03683072436435790.98158463781782
70.009946943850801250.01989388770160250.990053056149199
80.007146589887062410.01429317977412480.992853410112938
90.01019851659215870.02039703318431740.989801483407841
100.006071437794214170.01214287558842830.993928562205786
110.00483079931684620.00966159863369240.995169200683154
120.003647508097119090.007295016194238170.99635249190288
130.001721965714821420.003443931429642830.998278034285179
140.0007535404523841360.001507080904768270.999246459547616
150.000356625505843950.00071325101168790.999643374494156
160.0003086425010829500.00061728500216590.999691357498917
170.0002794824974715480.0005589649949430960.999720517502528
180.0001955440177887890.0003910880355775770.999804455982211
190.00012168615447080.00024337230894160.99987831384553
208.1737000640426e-050.0001634740012808520.99991826299936
210.0001481284906601920.0002962569813203830.99985187150934
220.0001223122837801170.0002446245675602330.99987768771622
230.0001301177360897220.0002602354721794440.99986988226391
240.0001381372199105720.0002762744398211440.99986186278009
250.0001901136982135130.0003802273964270270.999809886301786
260.0003308912861059630.0006617825722119250.999669108713894
270.0005120680265398320.001024136053079660.99948793197346
280.0006340083713781920.001268016742756380.999365991628622
290.0008329080071755890.001665816014351180.999167091992824
300.001299506091072480.002599012182144960.998700493908927
310.002045174933272140.004090349866544280.997954825066728
320.004564298833379360.009128597666758720.99543570116662
330.02611444957194630.05222889914389250.973885550428054
340.04270949648072660.08541899296145320.957290503519273
350.07502839670859570.1500567934171910.924971603291404
360.1519059458246290.3038118916492570.848094054175371
370.2236489118014390.4472978236028780.776351088198561
380.2785877845329890.5571755690659780.721412215467011
390.2875194215242540.5750388430485070.712480578475746
400.2838831369159320.5677662738318650.716116863084068
410.2870429971066820.5740859942133650.712957002893318
420.3191518844576820.6383037689153640.680848115542318
430.4468967551025980.8937935102051970.553103244897402
440.7247661474996980.5504677050006030.275233852500302
450.8711497350778750.2577005298442510.128850264922125
460.8163858509693960.3672282980612080.183614149030604
470.7424634625301220.5150730749397560.257536537469878
480.654540590430160.6909188191396790.345459409569839
490.669448329857880.661103340284240.33055167014212
500.8488066684093620.3023866631812750.151193331590637
510.9420174937732730.1159650124534540.057982506226727
520.8995440898027750.2009118203944500.100455910197225
530.8311141256241160.3377717487517670.168885874375884
540.7257422665851110.5485154668297770.274257733414889
550.568578272247710.862843455504580.43142172775229

\begin{tabular}{lllllllll}
\hline
Goldfeld-Quandt test for Heteroskedasticity \tabularnewline
p-values & Alternative Hypothesis \tabularnewline
breakpoint index & greater & 2-sided & less \tabularnewline
5 & 0.0604069771815258 & 0.120813954363052 & 0.939593022818474 \tabularnewline
6 & 0.0184153621821790 & 0.0368307243643579 & 0.98158463781782 \tabularnewline
7 & 0.00994694385080125 & 0.0198938877016025 & 0.990053056149199 \tabularnewline
8 & 0.00714658988706241 & 0.0142931797741248 & 0.992853410112938 \tabularnewline
9 & 0.0101985165921587 & 0.0203970331843174 & 0.989801483407841 \tabularnewline
10 & 0.00607143779421417 & 0.0121428755884283 & 0.993928562205786 \tabularnewline
11 & 0.0048307993168462 & 0.0096615986336924 & 0.995169200683154 \tabularnewline
12 & 0.00364750809711909 & 0.00729501619423817 & 0.99635249190288 \tabularnewline
13 & 0.00172196571482142 & 0.00344393142964283 & 0.998278034285179 \tabularnewline
14 & 0.000753540452384136 & 0.00150708090476827 & 0.999246459547616 \tabularnewline
15 & 0.00035662550584395 & 0.0007132510116879 & 0.999643374494156 \tabularnewline
16 & 0.000308642501082950 & 0.0006172850021659 & 0.999691357498917 \tabularnewline
17 & 0.000279482497471548 & 0.000558964994943096 & 0.999720517502528 \tabularnewline
18 & 0.000195544017788789 & 0.000391088035577577 & 0.999804455982211 \tabularnewline
19 & 0.0001216861544708 & 0.0002433723089416 & 0.99987831384553 \tabularnewline
20 & 8.1737000640426e-05 & 0.000163474001280852 & 0.99991826299936 \tabularnewline
21 & 0.000148128490660192 & 0.000296256981320383 & 0.99985187150934 \tabularnewline
22 & 0.000122312283780117 & 0.000244624567560233 & 0.99987768771622 \tabularnewline
23 & 0.000130117736089722 & 0.000260235472179444 & 0.99986988226391 \tabularnewline
24 & 0.000138137219910572 & 0.000276274439821144 & 0.99986186278009 \tabularnewline
25 & 0.000190113698213513 & 0.000380227396427027 & 0.999809886301786 \tabularnewline
26 & 0.000330891286105963 & 0.000661782572211925 & 0.999669108713894 \tabularnewline
27 & 0.000512068026539832 & 0.00102413605307966 & 0.99948793197346 \tabularnewline
28 & 0.000634008371378192 & 0.00126801674275638 & 0.999365991628622 \tabularnewline
29 & 0.000832908007175589 & 0.00166581601435118 & 0.999167091992824 \tabularnewline
30 & 0.00129950609107248 & 0.00259901218214496 & 0.998700493908927 \tabularnewline
31 & 0.00204517493327214 & 0.00409034986654428 & 0.997954825066728 \tabularnewline
32 & 0.00456429883337936 & 0.00912859766675872 & 0.99543570116662 \tabularnewline
33 & 0.0261144495719463 & 0.0522288991438925 & 0.973885550428054 \tabularnewline
34 & 0.0427094964807266 & 0.0854189929614532 & 0.957290503519273 \tabularnewline
35 & 0.0750283967085957 & 0.150056793417191 & 0.924971603291404 \tabularnewline
36 & 0.151905945824629 & 0.303811891649257 & 0.848094054175371 \tabularnewline
37 & 0.223648911801439 & 0.447297823602878 & 0.776351088198561 \tabularnewline
38 & 0.278587784532989 & 0.557175569065978 & 0.721412215467011 \tabularnewline
39 & 0.287519421524254 & 0.575038843048507 & 0.712480578475746 \tabularnewline
40 & 0.283883136915932 & 0.567766273831865 & 0.716116863084068 \tabularnewline
41 & 0.287042997106682 & 0.574085994213365 & 0.712957002893318 \tabularnewline
42 & 0.319151884457682 & 0.638303768915364 & 0.680848115542318 \tabularnewline
43 & 0.446896755102598 & 0.893793510205197 & 0.553103244897402 \tabularnewline
44 & 0.724766147499698 & 0.550467705000603 & 0.275233852500302 \tabularnewline
45 & 0.871149735077875 & 0.257700529844251 & 0.128850264922125 \tabularnewline
46 & 0.816385850969396 & 0.367228298061208 & 0.183614149030604 \tabularnewline
47 & 0.742463462530122 & 0.515073074939756 & 0.257536537469878 \tabularnewline
48 & 0.65454059043016 & 0.690918819139679 & 0.345459409569839 \tabularnewline
49 & 0.66944832985788 & 0.66110334028424 & 0.33055167014212 \tabularnewline
50 & 0.848806668409362 & 0.302386663181275 & 0.151193331590637 \tabularnewline
51 & 0.942017493773273 & 0.115965012453454 & 0.057982506226727 \tabularnewline
52 & 0.899544089802775 & 0.200911820394450 & 0.100455910197225 \tabularnewline
53 & 0.831114125624116 & 0.337771748751767 & 0.168885874375884 \tabularnewline
54 & 0.725742266585111 & 0.548515466829777 & 0.274257733414889 \tabularnewline
55 & 0.56857827224771 & 0.86284345550458 & 0.43142172775229 \tabularnewline
\hline
\end{tabular}
%Source: https://freestatistics.org/blog/index.php?pk=70666&T=5

[TABLE]
[ROW][C]Goldfeld-Quandt test for Heteroskedasticity[/C][/ROW]
[ROW][C]p-values[/C][C]Alternative Hypothesis[/C][/ROW]
[ROW][C]breakpoint index[/C][C]greater[/C][C]2-sided[/C][C]less[/C][/ROW]
[ROW][C]5[/C][C]0.0604069771815258[/C][C]0.120813954363052[/C][C]0.939593022818474[/C][/ROW]
[ROW][C]6[/C][C]0.0184153621821790[/C][C]0.0368307243643579[/C][C]0.98158463781782[/C][/ROW]
[ROW][C]7[/C][C]0.00994694385080125[/C][C]0.0198938877016025[/C][C]0.990053056149199[/C][/ROW]
[ROW][C]8[/C][C]0.00714658988706241[/C][C]0.0142931797741248[/C][C]0.992853410112938[/C][/ROW]
[ROW][C]9[/C][C]0.0101985165921587[/C][C]0.0203970331843174[/C][C]0.989801483407841[/C][/ROW]
[ROW][C]10[/C][C]0.00607143779421417[/C][C]0.0121428755884283[/C][C]0.993928562205786[/C][/ROW]
[ROW][C]11[/C][C]0.0048307993168462[/C][C]0.0096615986336924[/C][C]0.995169200683154[/C][/ROW]
[ROW][C]12[/C][C]0.00364750809711909[/C][C]0.00729501619423817[/C][C]0.99635249190288[/C][/ROW]
[ROW][C]13[/C][C]0.00172196571482142[/C][C]0.00344393142964283[/C][C]0.998278034285179[/C][/ROW]
[ROW][C]14[/C][C]0.000753540452384136[/C][C]0.00150708090476827[/C][C]0.999246459547616[/C][/ROW]
[ROW][C]15[/C][C]0.00035662550584395[/C][C]0.0007132510116879[/C][C]0.999643374494156[/C][/ROW]
[ROW][C]16[/C][C]0.000308642501082950[/C][C]0.0006172850021659[/C][C]0.999691357498917[/C][/ROW]
[ROW][C]17[/C][C]0.000279482497471548[/C][C]0.000558964994943096[/C][C]0.999720517502528[/C][/ROW]
[ROW][C]18[/C][C]0.000195544017788789[/C][C]0.000391088035577577[/C][C]0.999804455982211[/C][/ROW]
[ROW][C]19[/C][C]0.0001216861544708[/C][C]0.0002433723089416[/C][C]0.99987831384553[/C][/ROW]
[ROW][C]20[/C][C]8.1737000640426e-05[/C][C]0.000163474001280852[/C][C]0.99991826299936[/C][/ROW]
[ROW][C]21[/C][C]0.000148128490660192[/C][C]0.000296256981320383[/C][C]0.99985187150934[/C][/ROW]
[ROW][C]22[/C][C]0.000122312283780117[/C][C]0.000244624567560233[/C][C]0.99987768771622[/C][/ROW]
[ROW][C]23[/C][C]0.000130117736089722[/C][C]0.000260235472179444[/C][C]0.99986988226391[/C][/ROW]
[ROW][C]24[/C][C]0.000138137219910572[/C][C]0.000276274439821144[/C][C]0.99986186278009[/C][/ROW]
[ROW][C]25[/C][C]0.000190113698213513[/C][C]0.000380227396427027[/C][C]0.999809886301786[/C][/ROW]
[ROW][C]26[/C][C]0.000330891286105963[/C][C]0.000661782572211925[/C][C]0.999669108713894[/C][/ROW]
[ROW][C]27[/C][C]0.000512068026539832[/C][C]0.00102413605307966[/C][C]0.99948793197346[/C][/ROW]
[ROW][C]28[/C][C]0.000634008371378192[/C][C]0.00126801674275638[/C][C]0.999365991628622[/C][/ROW]
[ROW][C]29[/C][C]0.000832908007175589[/C][C]0.00166581601435118[/C][C]0.999167091992824[/C][/ROW]
[ROW][C]30[/C][C]0.00129950609107248[/C][C]0.00259901218214496[/C][C]0.998700493908927[/C][/ROW]
[ROW][C]31[/C][C]0.00204517493327214[/C][C]0.00409034986654428[/C][C]0.997954825066728[/C][/ROW]
[ROW][C]32[/C][C]0.00456429883337936[/C][C]0.00912859766675872[/C][C]0.99543570116662[/C][/ROW]
[ROW][C]33[/C][C]0.0261144495719463[/C][C]0.0522288991438925[/C][C]0.973885550428054[/C][/ROW]
[ROW][C]34[/C][C]0.0427094964807266[/C][C]0.0854189929614532[/C][C]0.957290503519273[/C][/ROW]
[ROW][C]35[/C][C]0.0750283967085957[/C][C]0.150056793417191[/C][C]0.924971603291404[/C][/ROW]
[ROW][C]36[/C][C]0.151905945824629[/C][C]0.303811891649257[/C][C]0.848094054175371[/C][/ROW]
[ROW][C]37[/C][C]0.223648911801439[/C][C]0.447297823602878[/C][C]0.776351088198561[/C][/ROW]
[ROW][C]38[/C][C]0.278587784532989[/C][C]0.557175569065978[/C][C]0.721412215467011[/C][/ROW]
[ROW][C]39[/C][C]0.287519421524254[/C][C]0.575038843048507[/C][C]0.712480578475746[/C][/ROW]
[ROW][C]40[/C][C]0.283883136915932[/C][C]0.567766273831865[/C][C]0.716116863084068[/C][/ROW]
[ROW][C]41[/C][C]0.287042997106682[/C][C]0.574085994213365[/C][C]0.712957002893318[/C][/ROW]
[ROW][C]42[/C][C]0.319151884457682[/C][C]0.638303768915364[/C][C]0.680848115542318[/C][/ROW]
[ROW][C]43[/C][C]0.446896755102598[/C][C]0.893793510205197[/C][C]0.553103244897402[/C][/ROW]
[ROW][C]44[/C][C]0.724766147499698[/C][C]0.550467705000603[/C][C]0.275233852500302[/C][/ROW]
[ROW][C]45[/C][C]0.871149735077875[/C][C]0.257700529844251[/C][C]0.128850264922125[/C][/ROW]
[ROW][C]46[/C][C]0.816385850969396[/C][C]0.367228298061208[/C][C]0.183614149030604[/C][/ROW]
[ROW][C]47[/C][C]0.742463462530122[/C][C]0.515073074939756[/C][C]0.257536537469878[/C][/ROW]
[ROW][C]48[/C][C]0.65454059043016[/C][C]0.690918819139679[/C][C]0.345459409569839[/C][/ROW]
[ROW][C]49[/C][C]0.66944832985788[/C][C]0.66110334028424[/C][C]0.33055167014212[/C][/ROW]
[ROW][C]50[/C][C]0.848806668409362[/C][C]0.302386663181275[/C][C]0.151193331590637[/C][/ROW]
[ROW][C]51[/C][C]0.942017493773273[/C][C]0.115965012453454[/C][C]0.057982506226727[/C][/ROW]
[ROW][C]52[/C][C]0.899544089802775[/C][C]0.200911820394450[/C][C]0.100455910197225[/C][/ROW]
[ROW][C]53[/C][C]0.831114125624116[/C][C]0.337771748751767[/C][C]0.168885874375884[/C][/ROW]
[ROW][C]54[/C][C]0.725742266585111[/C][C]0.548515466829777[/C][C]0.274257733414889[/C][/ROW]
[ROW][C]55[/C][C]0.56857827224771[/C][C]0.86284345550458[/C][C]0.43142172775229[/C][/ROW]
[/TABLE]
Source: https://freestatistics.org/blog/index.php?pk=70666&T=5

Globally Unique Identifier (entire table): ba.freestatistics.org/blog/index.php?pk=70666&T=5

As an alternative you can also use a QR Code:  

The GUIDs for individual cells are displayed in the table below:

Goldfeld-Quandt test for Heteroskedasticity
p-valuesAlternative Hypothesis
breakpoint indexgreater2-sidedless
50.06040697718152580.1208139543630520.939593022818474
60.01841536218217900.03683072436435790.98158463781782
70.009946943850801250.01989388770160250.990053056149199
80.007146589887062410.01429317977412480.992853410112938
90.01019851659215870.02039703318431740.989801483407841
100.006071437794214170.01214287558842830.993928562205786
110.00483079931684620.00966159863369240.995169200683154
120.003647508097119090.007295016194238170.99635249190288
130.001721965714821420.003443931429642830.998278034285179
140.0007535404523841360.001507080904768270.999246459547616
150.000356625505843950.00071325101168790.999643374494156
160.0003086425010829500.00061728500216590.999691357498917
170.0002794824974715480.0005589649949430960.999720517502528
180.0001955440177887890.0003910880355775770.999804455982211
190.00012168615447080.00024337230894160.99987831384553
208.1737000640426e-050.0001634740012808520.99991826299936
210.0001481284906601920.0002962569813203830.99985187150934
220.0001223122837801170.0002446245675602330.99987768771622
230.0001301177360897220.0002602354721794440.99986988226391
240.0001381372199105720.0002762744398211440.99986186278009
250.0001901136982135130.0003802273964270270.999809886301786
260.0003308912861059630.0006617825722119250.999669108713894
270.0005120680265398320.001024136053079660.99948793197346
280.0006340083713781920.001268016742756380.999365991628622
290.0008329080071755890.001665816014351180.999167091992824
300.001299506091072480.002599012182144960.998700493908927
310.002045174933272140.004090349866544280.997954825066728
320.004564298833379360.009128597666758720.99543570116662
330.02611444957194630.05222889914389250.973885550428054
340.04270949648072660.08541899296145320.957290503519273
350.07502839670859570.1500567934171910.924971603291404
360.1519059458246290.3038118916492570.848094054175371
370.2236489118014390.4472978236028780.776351088198561
380.2785877845329890.5571755690659780.721412215467011
390.2875194215242540.5750388430485070.712480578475746
400.2838831369159320.5677662738318650.716116863084068
410.2870429971066820.5740859942133650.712957002893318
420.3191518844576820.6383037689153640.680848115542318
430.4468967551025980.8937935102051970.553103244897402
440.7247661474996980.5504677050006030.275233852500302
450.8711497350778750.2577005298442510.128850264922125
460.8163858509693960.3672282980612080.183614149030604
470.7424634625301220.5150730749397560.257536537469878
480.654540590430160.6909188191396790.345459409569839
490.669448329857880.661103340284240.33055167014212
500.8488066684093620.3023866631812750.151193331590637
510.9420174937732730.1159650124534540.057982506226727
520.8995440898027750.2009118203944500.100455910197225
530.8311141256241160.3377717487517670.168885874375884
540.7257422665851110.5485154668297770.274257733414889
550.568578272247710.862843455504580.43142172775229


Meta Analysis of Goldfeld-Quandt test for Heteroskedasticity
Description# significant tests% significant testsOK/NOK
1% type I error level220.431372549019608NOK
5% type I error level270.529411764705882NOK
10% type I error level290.568627450980392NOK

\begin{tabular}{lllllllll}
\hline
Meta Analysis of Goldfeld-Quandt test for Heteroskedasticity \tabularnewline
Description & # significant tests & % significant tests & OK/NOK \tabularnewline
1% type I error level & 22 & 0.431372549019608 & NOK \tabularnewline
5% type I error level & 27 & 0.529411764705882 & NOK \tabularnewline
10% type I error level & 29 & 0.568627450980392 & NOK \tabularnewline
\hline
\end{tabular}
%Source: https://freestatistics.org/blog/index.php?pk=70666&T=6

[TABLE]
[ROW][C]Meta Analysis of Goldfeld-Quandt test for Heteroskedasticity[/C][/ROW]
[ROW][C]Description[/C][C]# significant tests[/C][C]% significant tests[/C][C]OK/NOK[/C][/ROW]
[ROW][C]1% type I error level[/C][C]22[/C][C]0.431372549019608[/C][C]NOK[/C][/ROW]
[ROW][C]5% type I error level[/C][C]27[/C][C]0.529411764705882[/C][C]NOK[/C][/ROW]
[ROW][C]10% type I error level[/C][C]29[/C][C]0.568627450980392[/C][C]NOK[/C][/ROW]
[/TABLE]
Source: https://freestatistics.org/blog/index.php?pk=70666&T=6

Globally Unique Identifier (entire table): ba.freestatistics.org/blog/index.php?pk=70666&T=6

As an alternative you can also use a QR Code:  

The GUIDs for individual cells are displayed in the table below:

Meta Analysis of Goldfeld-Quandt test for Heteroskedasticity
Description# significant tests% significant testsOK/NOK
1% type I error level220.431372549019608NOK
5% type I error level270.529411764705882NOK
10% type I error level290.568627450980392NOK


Parameters (Session):
par1 = 1 ; par2 = Do not include Seasonal Dummies ; par3 = No Linear Trend ;
Parameters (R input):
par1 = 1 ; par2 = Do not include Seasonal Dummies ; par3 = No Linear Trend ;
R code (references can be found in the software module):
library(lattice)
library(lmtest)
n25 <- 25 #minimum number of obs. for Goldfeld-Quandt test
par1 <- as.numeric(par1)
x <- t(y)
k <- length(x[1,])
n <- length(x[,1])
x1 <- cbind(x[,par1], x[,1:k!=par1])
mycolnames <- c(colnames(x)[par1], colnames(x)[1:k!=par1])
colnames(x1) <- mycolnames #colnames(x)[par1]
x <- x1
if (par3 == 'First Differences'){
x2 <- array(0, dim=c(n-1,k), dimnames=list(1:(n-1), paste('(1-B)',colnames(x),sep='')))
for (i in 1:n-1) {
for (j in 1:k) {
x2[i,j] <- x[i+1,j] - x[i,j]
}
}
x <- x2
}
if (par2 == 'Include Monthly Dummies'){
x2 <- array(0, dim=c(n,11), dimnames=list(1:n, paste('M', seq(1:11), sep ='')))
for (i in 1:11){
x2[seq(i,n,12),i] <- 1
}
x <- cbind(x, x2)
}
if (par2 == 'Include Quarterly Dummies'){
x2 <- array(0, dim=c(n,3), dimnames=list(1:n, paste('Q', seq(1:3), sep ='')))
for (i in 1:3){
x2[seq(i,n,4),i] <- 1
}
x <- cbind(x, x2)
}
k <- length(x[1,])
if (par3 == 'Linear Trend'){
x <- cbind(x, c(1:n))
colnames(x)[k+1] <- 't'
}
x
k <- length(x[1,])
df <- as.data.frame(x)
(mylm <- lm(df))
(mysum <- summary(mylm))
if (n > n25) {
kp3 <- k + 3
nmkm3 <- n - k - 3
gqarr <- array(NA, dim=c(nmkm3-kp3+1,3))
numgqtests <- 0
numsignificant1 <- 0
numsignificant5 <- 0
numsignificant10 <- 0
for (mypoint in kp3:nmkm3) {
j <- 0
numgqtests <- numgqtests + 1
for (myalt in c('greater', 'two.sided', 'less')) {
j <- j + 1
gqarr[mypoint-kp3+1,j] <- gqtest(mylm, point=mypoint, alternative=myalt)$p.value
}
if (gqarr[mypoint-kp3+1,2] < 0.01) numsignificant1 <- numsignificant1 + 1
if (gqarr[mypoint-kp3+1,2] < 0.05) numsignificant5 <- numsignificant5 + 1
if (gqarr[mypoint-kp3+1,2] < 0.10) numsignificant10 <- numsignificant10 + 1
}
gqarr
}
bitmap(file='test0.png')
plot(x[,1], type='l', main='Actuals and Interpolation', ylab='value of Actuals and Interpolation (dots)', xlab='time or index')
points(x[,1]-mysum$resid)
grid()
dev.off()
bitmap(file='test1.png')
plot(mysum$resid, type='b', pch=19, main='Residuals', ylab='value of Residuals', xlab='time or index')
grid()
dev.off()
bitmap(file='test2.png')
hist(mysum$resid, main='Residual Histogram', xlab='values of Residuals')
grid()
dev.off()
bitmap(file='test3.png')
densityplot(~mysum$resid,col='black',main='Residual Density Plot', xlab='values of Residuals')
dev.off()
bitmap(file='test4.png')
qqnorm(mysum$resid, main='Residual Normal Q-Q Plot')
qqline(mysum$resid)
grid()
dev.off()
(myerror <- as.ts(mysum$resid))
bitmap(file='test5.png')
dum <- cbind(lag(myerror,k=1),myerror)
dum
dum1 <- dum[2:length(myerror),]
dum1
z <- as.data.frame(dum1)
z
plot(z,main=paste('Residual Lag plot, lowess, and regression line'), ylab='values of Residuals', xlab='lagged values of Residuals')
lines(lowess(z))
abline(lm(z))
grid()
dev.off()
bitmap(file='test6.png')
acf(mysum$resid, lag.max=length(mysum$resid)/2, main='Residual Autocorrelation Function')
grid()
dev.off()
bitmap(file='test7.png')
pacf(mysum$resid, lag.max=length(mysum$resid)/2, main='Residual Partial Autocorrelation Function')
grid()
dev.off()
bitmap(file='test8.png')
opar <- par(mfrow = c(2,2), oma = c(0, 0, 1.1, 0))
plot(mylm, las = 1, sub='Residual Diagnostics')
par(opar)
dev.off()
if (n > n25) {
bitmap(file='test9.png')
plot(kp3:nmkm3,gqarr[,2], main='Goldfeld-Quandt test',ylab='2-sided p-value',xlab='breakpoint')
grid()
dev.off()
}
load(file='createtable')
a<-table.start()
a<-table.row.start(a)
a<-table.element(a, 'Multiple Linear Regression - Estimated Regression Equation', 1, TRUE)
a<-table.row.end(a)
myeq <- colnames(x)[1]
myeq <- paste(myeq, '[t] = ', sep='')
for (i in 1:k){
if (mysum$coefficients[i,1] > 0) myeq <- paste(myeq, '+', '')
myeq <- paste(myeq, mysum$coefficients[i,1], sep=' ')
if (rownames(mysum$coefficients)[i] != '(Intercept)') {
myeq <- paste(myeq, rownames(mysum$coefficients)[i], sep='')
if (rownames(mysum$coefficients)[i] != 't') myeq <- paste(myeq, '[t]', sep='')
}
}
myeq <- paste(myeq, ' + e[t]')
a<-table.row.start(a)
a<-table.element(a, myeq)
a<-table.row.end(a)
a<-table.end(a)
table.save(a,file='mytable1.tab')
a<-table.start()
a<-table.row.start(a)
a<-table.element(a,hyperlink('ols1.htm','Multiple Linear Regression - Ordinary Least Squares',''), 6, TRUE)
a<-table.row.end(a)
a<-table.row.start(a)
a<-table.element(a,'Variable',header=TRUE)
a<-table.element(a,'Parameter',header=TRUE)
a<-table.element(a,'S.D.',header=TRUE)
a<-table.element(a,'T-STAT
H0: parameter = 0',header=TRUE)
a<-table.element(a,'2-tail p-value',header=TRUE)
a<-table.element(a,'1-tail p-value',header=TRUE)
a<-table.row.end(a)
for (i in 1:k){
a<-table.row.start(a)
a<-table.element(a,rownames(mysum$coefficients)[i],header=TRUE)
a<-table.element(a,mysum$coefficients[i,1])
a<-table.element(a, round(mysum$coefficients[i,2],6))
a<-table.element(a, round(mysum$coefficients[i,3],4))
a<-table.element(a, round(mysum$coefficients[i,4],6))
a<-table.element(a, round(mysum$coefficients[i,4]/2,6))
a<-table.row.end(a)
}
a<-table.end(a)
table.save(a,file='mytable2.tab')
a<-table.start()
a<-table.row.start(a)
a<-table.element(a, 'Multiple Linear Regression - Regression Statistics', 2, TRUE)
a<-table.row.end(a)
a<-table.row.start(a)
a<-table.element(a, 'Multiple R',1,TRUE)
a<-table.element(a, sqrt(mysum$r.squared))
a<-table.row.end(a)
a<-table.row.start(a)
a<-table.element(a, 'R-squared',1,TRUE)
a<-table.element(a, mysum$r.squared)
a<-table.row.end(a)
a<-table.row.start(a)
a<-table.element(a, 'Adjusted R-squared',1,TRUE)
a<-table.element(a, mysum$adj.r.squared)
a<-table.row.end(a)
a<-table.row.start(a)
a<-table.element(a, 'F-TEST (value)',1,TRUE)
a<-table.element(a, mysum$fstatistic[1])
a<-table.row.end(a)
a<-table.row.start(a)
a<-table.element(a, 'F-TEST (DF numerator)',1,TRUE)
a<-table.element(a, mysum$fstatistic[2])
a<-table.row.end(a)
a<-table.row.start(a)
a<-table.element(a, 'F-TEST (DF denominator)',1,TRUE)
a<-table.element(a, mysum$fstatistic[3])
a<-table.row.end(a)
a<-table.row.start(a)
a<-table.element(a, 'p-value',1,TRUE)
a<-table.element(a, 1-pf(mysum$fstatistic[1],mysum$fstatistic[2],mysum$fstatistic[3]))
a<-table.row.end(a)
a<-table.row.start(a)
a<-table.element(a, 'Multiple Linear Regression - Residual Statistics', 2, TRUE)
a<-table.row.end(a)
a<-table.row.start(a)
a<-table.element(a, 'Residual Standard Deviation',1,TRUE)
a<-table.element(a, mysum$sigma)
a<-table.row.end(a)
a<-table.row.start(a)
a<-table.element(a, 'Sum Squared Residuals',1,TRUE)
a<-table.element(a, sum(myerror*myerror))
a<-table.row.end(a)
a<-table.end(a)
table.save(a,file='mytable3.tab')
a<-table.start()
a<-table.row.start(a)
a<-table.element(a, 'Multiple Linear Regression - Actuals, Interpolation, and Residuals', 4, TRUE)
a<-table.row.end(a)
a<-table.row.start(a)
a<-table.element(a, 'Time or Index', 1, TRUE)
a<-table.element(a, 'Actuals', 1, TRUE)
a<-table.element(a, 'Interpolation
Forecast', 1, TRUE)
a<-table.element(a, 'Residuals
Prediction Error', 1, TRUE)
a<-table.row.end(a)
for (i in 1:n) {
a<-table.row.start(a)
a<-table.element(a,i, 1, TRUE)
a<-table.element(a,x[i])
a<-table.element(a,x[i]-mysum$resid[i])
a<-table.element(a,mysum$resid[i])
a<-table.row.end(a)
}
a<-table.end(a)
table.save(a,file='mytable4.tab')
if (n > n25) {
a<-table.start()
a<-table.row.start(a)
a<-table.element(a,'Goldfeld-Quandt test for Heteroskedasticity',4,TRUE)
a<-table.row.end(a)
a<-table.row.start(a)
a<-table.element(a,'p-values',header=TRUE)
a<-table.element(a,'Alternative Hypothesis',3,header=TRUE)
a<-table.row.end(a)
a<-table.row.start(a)
a<-table.element(a,'breakpoint index',header=TRUE)
a<-table.element(a,'greater',header=TRUE)
a<-table.element(a,'2-sided',header=TRUE)
a<-table.element(a,'less',header=TRUE)
a<-table.row.end(a)
for (mypoint in kp3:nmkm3) {
a<-table.row.start(a)
a<-table.element(a,mypoint,header=TRUE)
a<-table.element(a,gqarr[mypoint-kp3+1,1])
a<-table.element(a,gqarr[mypoint-kp3+1,2])
a<-table.element(a,gqarr[mypoint-kp3+1,3])
a<-table.row.end(a)
}
a<-table.end(a)
table.save(a,file='mytable5.tab')
a<-table.start()
a<-table.row.start(a)
a<-table.element(a,'Meta Analysis of Goldfeld-Quandt test for Heteroskedasticity',4,TRUE)
a<-table.row.end(a)
a<-table.row.start(a)
a<-table.element(a,'Description',header=TRUE)
a<-table.element(a,'# significant tests',header=TRUE)
a<-table.element(a,'% significant tests',header=TRUE)
a<-table.element(a,'OK/NOK',header=TRUE)
a<-table.row.end(a)
a<-table.row.start(a)
a<-table.element(a,'1% type I error level',header=TRUE)
a<-table.element(a,numsignificant1)
a<-table.element(a,numsignificant1/numgqtests)
if (numsignificant1/numgqtests < 0.01) dum <- 'OK' else dum <- 'NOK'
a<-table.element(a,dum)
a<-table.row.end(a)
a<-table.row.start(a)
a<-table.element(a,'5% type I error level',header=TRUE)
a<-table.element(a,numsignificant5)
a<-table.element(a,numsignificant5/numgqtests)
if (numsignificant5/numgqtests < 0.05) dum <- 'OK' else dum <- 'NOK'
a<-table.element(a,dum)
a<-table.row.end(a)
a<-table.row.start(a)
a<-table.element(a,'10% type I error level',header=TRUE)
a<-table.element(a,numsignificant10)
a<-table.element(a,numsignificant10/numgqtests)
if (numsignificant10/numgqtests < 0.1) dum <- 'OK' else dum <- 'NOK'
a<-table.element(a,dum)
a<-table.row.end(a)
a<-table.end(a)
table.save(a,file='mytable6.tab')
}