Free Statistics

of Irreproducible Research!

Author's title

Author*The author of this computation has been verified*
R Software Modulerwasp_autocorrelation.wasp
Title produced by software(Partial) Autocorrelation Function
Date of computationSat, 26 Dec 2009 08:51:11 -0700
Cite this page as followsStatistical Computations at FreeStatistics.org, Office for Research Development and Education, URL https://freestatistics.org/blog/index.php?v=date/2009/Dec/26/t1261843078vpiccgssnoozenu.htm/, Retrieved Sun, 28 Apr 2024 22:54:46 +0000
Statistical Computations at FreeStatistics.org, Office for Research Development and Education, URL https://freestatistics.org/blog/index.php?pk=70758, Retrieved Sun, 28 Apr 2024 22:54:46 +0000
QR Codes:

Original text written by user:
IsPrivate?No (this computation is public)
User-defined keywords
Estimated Impact186
Family? (F = Feedback message, R = changed R code, M = changed R Module, P = changed Parameters, D = changed Data)
-     [Univariate Data Series] [Paper] [2009-12-21 20:42:12] [0df1a6455bedfaf424729b1e006090d0]
- RMPD    [(Partial) Autocorrelation Function] [Paper] [2009-12-26 15:51:11] [e2f800c9186517d2e5c4a809848912a7] [Current]
Feedback Forum

Post a new message
Dataseries X:
1.2613
1.2646
1.2262
1.1985
1.2007
1.2138
1.2266
1.2176
1.2218
1.249
1.2991
1.3408
1.3119
1.3014
1.3201
1.2938
1.2694
1.2165
1.2037
1.2292
1.2256
1.2015
1.1786
1.1856
1.2103
1.1938
1.202
1.2271
1.277
1.265
1.2684
1.2811
1.2727
1.2611
1.2881
1.3213
1.2999
1.3074
1.3242
1.3516
1.3511
1.3419
1.3716
1.3622
1.3896
1.4227
1.4684
1.457
1.4718
1.4748
1.5527
1.5751
1.5557
1.5553
1.577
1.4975
1.437
1.3322
1.2732
1.3449


Summary of computational transaction
Raw Inputview raw input (R code)
Raw Outputview raw output of R engine
Computing time1 seconds
R Server'Gwilym Jenkins' @ 72.249.127.135

\begin{tabular}{lllllllll}
\hline
Summary of computational transaction \tabularnewline
Raw Input & view raw input (R code)  \tabularnewline
Raw Output & view raw output of R engine  \tabularnewline
Computing time & 1 seconds \tabularnewline
R Server & 'Gwilym Jenkins' @ 72.249.127.135 \tabularnewline
\hline
\end{tabular}
%Source: https://freestatistics.org/blog/index.php?pk=70758&T=0

[TABLE]
[ROW][C]Summary of computational transaction[/C][/ROW]
[ROW][C]Raw Input[/C][C]view raw input (R code) [/C][/ROW]
[ROW][C]Raw Output[/C][C]view raw output of R engine [/C][/ROW]
[ROW][C]Computing time[/C][C]1 seconds[/C][/ROW]
[ROW][C]R Server[/C][C]'Gwilym Jenkins' @ 72.249.127.135[/C][/ROW]
[/TABLE]
Source: https://freestatistics.org/blog/index.php?pk=70758&T=0

Globally Unique Identifier (entire table): ba.freestatistics.org/blog/index.php?pk=70758&T=0

As an alternative you can also use a QR Code:  

The GUIDs for individual cells are displayed in the table below:

Summary of computational transaction
Raw Inputview raw input (R code)
Raw Outputview raw output of R engine
Computing time1 seconds
R Server'Gwilym Jenkins' @ 72.249.127.135


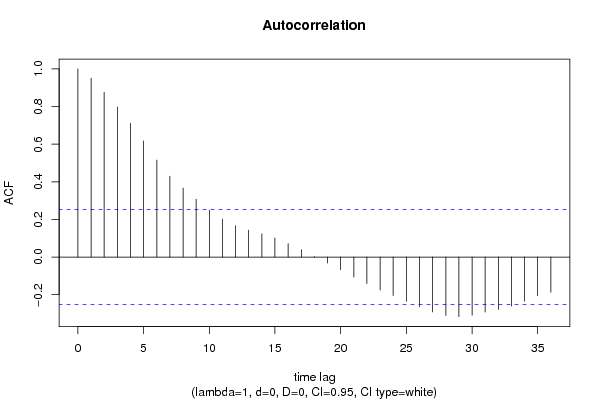
Autocorrelation Function
Time lag kACF(k)T-STATP-value
10.9511167.36730
20.8767646.79140
30.7973556.17630
40.7117485.51320
50.6171424.78046e-06
60.5159253.99638.9e-05
70.4298073.32930.000746
80.36692.8420.003059
90.3077072.38350.010166
100.2483911.9240.029549
110.2016421.56190.061784
120.1666021.29050.100915
130.1429211.10710.136343
140.123520.95680.171258
150.1020260.79030.216235
160.0713150.55240.291361
170.0391130.3030.381482
180.0027250.02110.491616
19-0.0317-0.24560.403434
20-0.067241-0.52080.302195
21-0.105989-0.8210.207453
22-0.14097-1.09190.13961
23-0.174943-1.35510.090233
24-0.204737-1.58590.059011
25-0.2353-1.82260.036672
26-0.264171-2.04630.02256
27-0.291326-2.25660.013844
28-0.310045-2.40160.009719
29-0.316668-2.45290.008548
30-0.308972-2.39330.009922
31-0.292461-2.26540.013556
32-0.278178-2.15480.017602
33-0.260493-2.01780.024047
34-0.234646-1.81760.037063
35-0.206094-1.59640.057827
36-0.186645-1.44570.076726

\begin{tabular}{lllllllll}
\hline
Autocorrelation Function \tabularnewline
Time lag k & ACF(k) & T-STAT & P-value \tabularnewline
1 & 0.951116 & 7.3673 & 0 \tabularnewline
2 & 0.876764 & 6.7914 & 0 \tabularnewline
3 & 0.797355 & 6.1763 & 0 \tabularnewline
4 & 0.711748 & 5.5132 & 0 \tabularnewline
5 & 0.617142 & 4.7804 & 6e-06 \tabularnewline
6 & 0.515925 & 3.9963 & 8.9e-05 \tabularnewline
7 & 0.429807 & 3.3293 & 0.000746 \tabularnewline
8 & 0.3669 & 2.842 & 0.003059 \tabularnewline
9 & 0.307707 & 2.3835 & 0.010166 \tabularnewline
10 & 0.248391 & 1.924 & 0.029549 \tabularnewline
11 & 0.201642 & 1.5619 & 0.061784 \tabularnewline
12 & 0.166602 & 1.2905 & 0.100915 \tabularnewline
13 & 0.142921 & 1.1071 & 0.136343 \tabularnewline
14 & 0.12352 & 0.9568 & 0.171258 \tabularnewline
15 & 0.102026 & 0.7903 & 0.216235 \tabularnewline
16 & 0.071315 & 0.5524 & 0.291361 \tabularnewline
17 & 0.039113 & 0.303 & 0.381482 \tabularnewline
18 & 0.002725 & 0.0211 & 0.491616 \tabularnewline
19 & -0.0317 & -0.2456 & 0.403434 \tabularnewline
20 & -0.067241 & -0.5208 & 0.302195 \tabularnewline
21 & -0.105989 & -0.821 & 0.207453 \tabularnewline
22 & -0.14097 & -1.0919 & 0.13961 \tabularnewline
23 & -0.174943 & -1.3551 & 0.090233 \tabularnewline
24 & -0.204737 & -1.5859 & 0.059011 \tabularnewline
25 & -0.2353 & -1.8226 & 0.036672 \tabularnewline
26 & -0.264171 & -2.0463 & 0.02256 \tabularnewline
27 & -0.291326 & -2.2566 & 0.013844 \tabularnewline
28 & -0.310045 & -2.4016 & 0.009719 \tabularnewline
29 & -0.316668 & -2.4529 & 0.008548 \tabularnewline
30 & -0.308972 & -2.3933 & 0.009922 \tabularnewline
31 & -0.292461 & -2.2654 & 0.013556 \tabularnewline
32 & -0.278178 & -2.1548 & 0.017602 \tabularnewline
33 & -0.260493 & -2.0178 & 0.024047 \tabularnewline
34 & -0.234646 & -1.8176 & 0.037063 \tabularnewline
35 & -0.206094 & -1.5964 & 0.057827 \tabularnewline
36 & -0.186645 & -1.4457 & 0.076726 \tabularnewline
\hline
\end{tabular}
%Source: https://freestatistics.org/blog/index.php?pk=70758&T=1

[TABLE]
[ROW][C]Autocorrelation Function[/C][/ROW]
[ROW][C]Time lag k[/C][C]ACF(k)[/C][C]T-STAT[/C][C]P-value[/C][/ROW]
[ROW][C]1[/C][C]0.951116[/C][C]7.3673[/C][C]0[/C][/ROW]
[ROW][C]2[/C][C]0.876764[/C][C]6.7914[/C][C]0[/C][/ROW]
[ROW][C]3[/C][C]0.797355[/C][C]6.1763[/C][C]0[/C][/ROW]
[ROW][C]4[/C][C]0.711748[/C][C]5.5132[/C][C]0[/C][/ROW]
[ROW][C]5[/C][C]0.617142[/C][C]4.7804[/C][C]6e-06[/C][/ROW]
[ROW][C]6[/C][C]0.515925[/C][C]3.9963[/C][C]8.9e-05[/C][/ROW]
[ROW][C]7[/C][C]0.429807[/C][C]3.3293[/C][C]0.000746[/C][/ROW]
[ROW][C]8[/C][C]0.3669[/C][C]2.842[/C][C]0.003059[/C][/ROW]
[ROW][C]9[/C][C]0.307707[/C][C]2.3835[/C][C]0.010166[/C][/ROW]
[ROW][C]10[/C][C]0.248391[/C][C]1.924[/C][C]0.029549[/C][/ROW]
[ROW][C]11[/C][C]0.201642[/C][C]1.5619[/C][C]0.061784[/C][/ROW]
[ROW][C]12[/C][C]0.166602[/C][C]1.2905[/C][C]0.100915[/C][/ROW]
[ROW][C]13[/C][C]0.142921[/C][C]1.1071[/C][C]0.136343[/C][/ROW]
[ROW][C]14[/C][C]0.12352[/C][C]0.9568[/C][C]0.171258[/C][/ROW]
[ROW][C]15[/C][C]0.102026[/C][C]0.7903[/C][C]0.216235[/C][/ROW]
[ROW][C]16[/C][C]0.071315[/C][C]0.5524[/C][C]0.291361[/C][/ROW]
[ROW][C]17[/C][C]0.039113[/C][C]0.303[/C][C]0.381482[/C][/ROW]
[ROW][C]18[/C][C]0.002725[/C][C]0.0211[/C][C]0.491616[/C][/ROW]
[ROW][C]19[/C][C]-0.0317[/C][C]-0.2456[/C][C]0.403434[/C][/ROW]
[ROW][C]20[/C][C]-0.067241[/C][C]-0.5208[/C][C]0.302195[/C][/ROW]
[ROW][C]21[/C][C]-0.105989[/C][C]-0.821[/C][C]0.207453[/C][/ROW]
[ROW][C]22[/C][C]-0.14097[/C][C]-1.0919[/C][C]0.13961[/C][/ROW]
[ROW][C]23[/C][C]-0.174943[/C][C]-1.3551[/C][C]0.090233[/C][/ROW]
[ROW][C]24[/C][C]-0.204737[/C][C]-1.5859[/C][C]0.059011[/C][/ROW]
[ROW][C]25[/C][C]-0.2353[/C][C]-1.8226[/C][C]0.036672[/C][/ROW]
[ROW][C]26[/C][C]-0.264171[/C][C]-2.0463[/C][C]0.02256[/C][/ROW]
[ROW][C]27[/C][C]-0.291326[/C][C]-2.2566[/C][C]0.013844[/C][/ROW]
[ROW][C]28[/C][C]-0.310045[/C][C]-2.4016[/C][C]0.009719[/C][/ROW]
[ROW][C]29[/C][C]-0.316668[/C][C]-2.4529[/C][C]0.008548[/C][/ROW]
[ROW][C]30[/C][C]-0.308972[/C][C]-2.3933[/C][C]0.009922[/C][/ROW]
[ROW][C]31[/C][C]-0.292461[/C][C]-2.2654[/C][C]0.013556[/C][/ROW]
[ROW][C]32[/C][C]-0.278178[/C][C]-2.1548[/C][C]0.017602[/C][/ROW]
[ROW][C]33[/C][C]-0.260493[/C][C]-2.0178[/C][C]0.024047[/C][/ROW]
[ROW][C]34[/C][C]-0.234646[/C][C]-1.8176[/C][C]0.037063[/C][/ROW]
[ROW][C]35[/C][C]-0.206094[/C][C]-1.5964[/C][C]0.057827[/C][/ROW]
[ROW][C]36[/C][C]-0.186645[/C][C]-1.4457[/C][C]0.076726[/C][/ROW]
[/TABLE]
Source: https://freestatistics.org/blog/index.php?pk=70758&T=1

Globally Unique Identifier (entire table): ba.freestatistics.org/blog/index.php?pk=70758&T=1

As an alternative you can also use a QR Code:  

The GUIDs for individual cells are displayed in the table below:

Autocorrelation Function
Time lag kACF(k)T-STATP-value
10.9511167.36730
20.8767646.79140
30.7973556.17630
40.7117485.51320
50.6171424.78046e-06
60.5159253.99638.9e-05
70.4298073.32930.000746
80.36692.8420.003059
90.3077072.38350.010166
100.2483911.9240.029549
110.2016421.56190.061784
120.1666021.29050.100915
130.1429211.10710.136343
140.123520.95680.171258
150.1020260.79030.216235
160.0713150.55240.291361
170.0391130.3030.381482
180.0027250.02110.491616
19-0.0317-0.24560.403434
20-0.067241-0.52080.302195
21-0.105989-0.8210.207453
22-0.14097-1.09190.13961
23-0.174943-1.35510.090233
24-0.204737-1.58590.059011
25-0.2353-1.82260.036672
26-0.264171-2.04630.02256
27-0.291326-2.25660.013844
28-0.310045-2.40160.009719
29-0.316668-2.45290.008548
30-0.308972-2.39330.009922
31-0.292461-2.26540.013556
32-0.278178-2.15480.017602
33-0.260493-2.01780.024047
34-0.234646-1.81760.037063
35-0.206094-1.59640.057827
36-0.186645-1.44570.076726


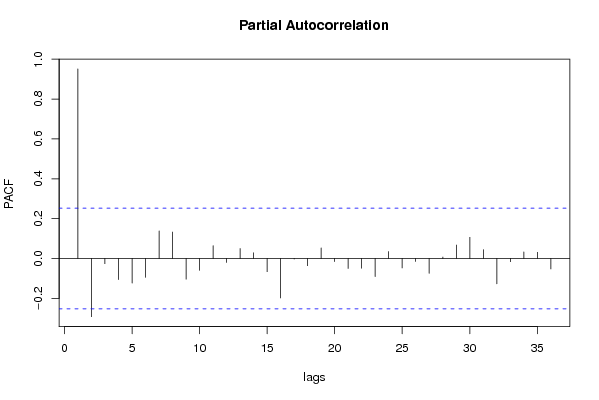
Partial Autocorrelation Function
Time lag kPACF(k)T-STATP-value
10.9511167.36730
2-0.292091-2.26250.013649
3-0.026516-0.20540.418981
4-0.105808-0.81960.207849
5-0.123315-0.95520.171657
6-0.094765-0.7340.23289
70.1380031.0690.144683
80.1324681.02610.154484
9-0.104129-0.80660.211546
10-0.059284-0.45920.323872
110.0643540.49850.309984
12-0.020234-0.15670.437992
130.0499480.38690.3501
140.02830.21920.413616
15-0.066377-0.51420.304517
16-0.198335-1.53630.064862
17-0.00329-0.02550.489878
18-0.036602-0.28350.388877
190.0525930.40740.342587
20-0.015665-0.12130.451915
21-0.049985-0.38720.349995
22-0.048589-0.37640.353986
23-0.091124-0.70580.241509
240.0345430.26760.394974
25-0.047318-0.36650.357633
26-0.01489-0.11530.454281
27-0.074356-0.5760.283398
280.0069460.05380.478634
290.067020.51910.302788
300.1063710.82390.206618
310.0437520.33890.367934
32-0.127558-0.98810.163545
33-0.01619-0.12540.45031
340.0327480.25370.400312
350.0310630.24060.405339
36-0.052609-0.40750.342543

\begin{tabular}{lllllllll}
\hline
Partial Autocorrelation Function \tabularnewline
Time lag k & PACF(k) & T-STAT & P-value \tabularnewline
1 & 0.951116 & 7.3673 & 0 \tabularnewline
2 & -0.292091 & -2.2625 & 0.013649 \tabularnewline
3 & -0.026516 & -0.2054 & 0.418981 \tabularnewline
4 & -0.105808 & -0.8196 & 0.207849 \tabularnewline
5 & -0.123315 & -0.9552 & 0.171657 \tabularnewline
6 & -0.094765 & -0.734 & 0.23289 \tabularnewline
7 & 0.138003 & 1.069 & 0.144683 \tabularnewline
8 & 0.132468 & 1.0261 & 0.154484 \tabularnewline
9 & -0.104129 & -0.8066 & 0.211546 \tabularnewline
10 & -0.059284 & -0.4592 & 0.323872 \tabularnewline
11 & 0.064354 & 0.4985 & 0.309984 \tabularnewline
12 & -0.020234 & -0.1567 & 0.437992 \tabularnewline
13 & 0.049948 & 0.3869 & 0.3501 \tabularnewline
14 & 0.0283 & 0.2192 & 0.413616 \tabularnewline
15 & -0.066377 & -0.5142 & 0.304517 \tabularnewline
16 & -0.198335 & -1.5363 & 0.064862 \tabularnewline
17 & -0.00329 & -0.0255 & 0.489878 \tabularnewline
18 & -0.036602 & -0.2835 & 0.388877 \tabularnewline
19 & 0.052593 & 0.4074 & 0.342587 \tabularnewline
20 & -0.015665 & -0.1213 & 0.451915 \tabularnewline
21 & -0.049985 & -0.3872 & 0.349995 \tabularnewline
22 & -0.048589 & -0.3764 & 0.353986 \tabularnewline
23 & -0.091124 & -0.7058 & 0.241509 \tabularnewline
24 & 0.034543 & 0.2676 & 0.394974 \tabularnewline
25 & -0.047318 & -0.3665 & 0.357633 \tabularnewline
26 & -0.01489 & -0.1153 & 0.454281 \tabularnewline
27 & -0.074356 & -0.576 & 0.283398 \tabularnewline
28 & 0.006946 & 0.0538 & 0.478634 \tabularnewline
29 & 0.06702 & 0.5191 & 0.302788 \tabularnewline
30 & 0.106371 & 0.8239 & 0.206618 \tabularnewline
31 & 0.043752 & 0.3389 & 0.367934 \tabularnewline
32 & -0.127558 & -0.9881 & 0.163545 \tabularnewline
33 & -0.01619 & -0.1254 & 0.45031 \tabularnewline
34 & 0.032748 & 0.2537 & 0.400312 \tabularnewline
35 & 0.031063 & 0.2406 & 0.405339 \tabularnewline
36 & -0.052609 & -0.4075 & 0.342543 \tabularnewline
\hline
\end{tabular}
%Source: https://freestatistics.org/blog/index.php?pk=70758&T=2

[TABLE]
[ROW][C]Partial Autocorrelation Function[/C][/ROW]
[ROW][C]Time lag k[/C][C]PACF(k)[/C][C]T-STAT[/C][C]P-value[/C][/ROW]
[ROW][C]1[/C][C]0.951116[/C][C]7.3673[/C][C]0[/C][/ROW]
[ROW][C]2[/C][C]-0.292091[/C][C]-2.2625[/C][C]0.013649[/C][/ROW]
[ROW][C]3[/C][C]-0.026516[/C][C]-0.2054[/C][C]0.418981[/C][/ROW]
[ROW][C]4[/C][C]-0.105808[/C][C]-0.8196[/C][C]0.207849[/C][/ROW]
[ROW][C]5[/C][C]-0.123315[/C][C]-0.9552[/C][C]0.171657[/C][/ROW]
[ROW][C]6[/C][C]-0.094765[/C][C]-0.734[/C][C]0.23289[/C][/ROW]
[ROW][C]7[/C][C]0.138003[/C][C]1.069[/C][C]0.144683[/C][/ROW]
[ROW][C]8[/C][C]0.132468[/C][C]1.0261[/C][C]0.154484[/C][/ROW]
[ROW][C]9[/C][C]-0.104129[/C][C]-0.8066[/C][C]0.211546[/C][/ROW]
[ROW][C]10[/C][C]-0.059284[/C][C]-0.4592[/C][C]0.323872[/C][/ROW]
[ROW][C]11[/C][C]0.064354[/C][C]0.4985[/C][C]0.309984[/C][/ROW]
[ROW][C]12[/C][C]-0.020234[/C][C]-0.1567[/C][C]0.437992[/C][/ROW]
[ROW][C]13[/C][C]0.049948[/C][C]0.3869[/C][C]0.3501[/C][/ROW]
[ROW][C]14[/C][C]0.0283[/C][C]0.2192[/C][C]0.413616[/C][/ROW]
[ROW][C]15[/C][C]-0.066377[/C][C]-0.5142[/C][C]0.304517[/C][/ROW]
[ROW][C]16[/C][C]-0.198335[/C][C]-1.5363[/C][C]0.064862[/C][/ROW]
[ROW][C]17[/C][C]-0.00329[/C][C]-0.0255[/C][C]0.489878[/C][/ROW]
[ROW][C]18[/C][C]-0.036602[/C][C]-0.2835[/C][C]0.388877[/C][/ROW]
[ROW][C]19[/C][C]0.052593[/C][C]0.4074[/C][C]0.342587[/C][/ROW]
[ROW][C]20[/C][C]-0.015665[/C][C]-0.1213[/C][C]0.451915[/C][/ROW]
[ROW][C]21[/C][C]-0.049985[/C][C]-0.3872[/C][C]0.349995[/C][/ROW]
[ROW][C]22[/C][C]-0.048589[/C][C]-0.3764[/C][C]0.353986[/C][/ROW]
[ROW][C]23[/C][C]-0.091124[/C][C]-0.7058[/C][C]0.241509[/C][/ROW]
[ROW][C]24[/C][C]0.034543[/C][C]0.2676[/C][C]0.394974[/C][/ROW]
[ROW][C]25[/C][C]-0.047318[/C][C]-0.3665[/C][C]0.357633[/C][/ROW]
[ROW][C]26[/C][C]-0.01489[/C][C]-0.1153[/C][C]0.454281[/C][/ROW]
[ROW][C]27[/C][C]-0.074356[/C][C]-0.576[/C][C]0.283398[/C][/ROW]
[ROW][C]28[/C][C]0.006946[/C][C]0.0538[/C][C]0.478634[/C][/ROW]
[ROW][C]29[/C][C]0.06702[/C][C]0.5191[/C][C]0.302788[/C][/ROW]
[ROW][C]30[/C][C]0.106371[/C][C]0.8239[/C][C]0.206618[/C][/ROW]
[ROW][C]31[/C][C]0.043752[/C][C]0.3389[/C][C]0.367934[/C][/ROW]
[ROW][C]32[/C][C]-0.127558[/C][C]-0.9881[/C][C]0.163545[/C][/ROW]
[ROW][C]33[/C][C]-0.01619[/C][C]-0.1254[/C][C]0.45031[/C][/ROW]
[ROW][C]34[/C][C]0.032748[/C][C]0.2537[/C][C]0.400312[/C][/ROW]
[ROW][C]35[/C][C]0.031063[/C][C]0.2406[/C][C]0.405339[/C][/ROW]
[ROW][C]36[/C][C]-0.052609[/C][C]-0.4075[/C][C]0.342543[/C][/ROW]
[/TABLE]
Source: https://freestatistics.org/blog/index.php?pk=70758&T=2

Globally Unique Identifier (entire table): ba.freestatistics.org/blog/index.php?pk=70758&T=2

As an alternative you can also use a QR Code:  

The GUIDs for individual cells are displayed in the table below:

Partial Autocorrelation Function
Time lag kPACF(k)T-STATP-value
10.9511167.36730
2-0.292091-2.26250.013649
3-0.026516-0.20540.418981
4-0.105808-0.81960.207849
5-0.123315-0.95520.171657
6-0.094765-0.7340.23289
70.1380031.0690.144683
80.1324681.02610.154484
9-0.104129-0.80660.211546
10-0.059284-0.45920.323872
110.0643540.49850.309984
12-0.020234-0.15670.437992
130.0499480.38690.3501
140.02830.21920.413616
15-0.066377-0.51420.304517
16-0.198335-1.53630.064862
17-0.00329-0.02550.489878
18-0.036602-0.28350.388877
190.0525930.40740.342587
20-0.015665-0.12130.451915
21-0.049985-0.38720.349995
22-0.048589-0.37640.353986
23-0.091124-0.70580.241509
240.0345430.26760.394974
25-0.047318-0.36650.357633
26-0.01489-0.11530.454281
27-0.074356-0.5760.283398
280.0069460.05380.478634
290.067020.51910.302788
300.1063710.82390.206618
310.0437520.33890.367934
32-0.127558-0.98810.163545
33-0.01619-0.12540.45031
340.0327480.25370.400312
350.0310630.24060.405339
36-0.052609-0.40750.342543


Parameters (Session):
par1 = 36 ; par2 = 1 ; par3 = 0 ; par4 = 0 ; par5 = 12 ; par6 = White Noise ; par7 = 0.95 ;
Parameters (R input):
par1 = 36 ; par2 = 1 ; par3 = 0 ; par4 = 0 ; par5 = 12 ; par6 = White Noise ; par7 = 0.95 ;
R code (references can be found in the software module):
if (par1 == 'Default') {
par1 = 10*log10(length(x))
} else {
par1 <- as.numeric(par1)
}
par2 <- as.numeric(par2)
par3 <- as.numeric(par3)
par4 <- as.numeric(par4)
par5 <- as.numeric(par5)
if (par6 == 'White Noise') par6 <- 'white' else par6 <- 'ma'
par7 <- as.numeric(par7)
if (par2 == 0) {
x <- log(x)
} else {
x <- (x ^ par2 - 1) / par2
}
if (par3 > 0) x <- diff(x,lag=1,difference=par3)
if (par4 > 0) x <- diff(x,lag=par5,difference=par4)
bitmap(file='pic1.png')
racf <- acf(x, par1, main='Autocorrelation', xlab='time lag', ylab='ACF', ci.type=par6, ci=par7, sub=paste('(lambda=',par2,', d=',par3,', D=',par4,', CI=', par7, ', CI type=',par6,')',sep=''))
dev.off()
bitmap(file='pic2.png')
rpacf <- pacf(x,par1,main='Partial Autocorrelation',xlab='lags',ylab='PACF')
dev.off()
(myacf <- c(racf$acf))
(mypacf <- c(rpacf$acf))
lengthx <- length(x)
sqrtn <- sqrt(lengthx)
load(file='createtable')
a<-table.start()
a<-table.row.start(a)
a<-table.element(a,'Autocorrelation Function',4,TRUE)
a<-table.row.end(a)
a<-table.row.start(a)
a<-table.element(a,'Time lag k',header=TRUE)
a<-table.element(a,hyperlink('basics.htm','ACF(k)','click here for more information about the Autocorrelation Function'),header=TRUE)
a<-table.element(a,'T-STAT',header=TRUE)
a<-table.element(a,'P-value',header=TRUE)
a<-table.row.end(a)
for (i in 2:(par1+1)) {
a<-table.row.start(a)
a<-table.element(a,i-1,header=TRUE)
a<-table.element(a,round(myacf[i],6))
mytstat <- myacf[i]*sqrtn
a<-table.element(a,round(mytstat,4))
a<-table.element(a,round(1-pt(abs(mytstat),lengthx),6))
a<-table.row.end(a)
}
a<-table.end(a)
table.save(a,file='mytable.tab')
a<-table.start()
a<-table.row.start(a)
a<-table.element(a,'Partial Autocorrelation Function',4,TRUE)
a<-table.row.end(a)
a<-table.row.start(a)
a<-table.element(a,'Time lag k',header=TRUE)
a<-table.element(a,hyperlink('basics.htm','PACF(k)','click here for more information about the Partial Autocorrelation Function'),header=TRUE)
a<-table.element(a,'T-STAT',header=TRUE)
a<-table.element(a,'P-value',header=TRUE)
a<-table.row.end(a)
for (i in 1:par1) {
a<-table.row.start(a)
a<-table.element(a,i,header=TRUE)
a<-table.element(a,round(mypacf[i],6))
mytstat <- mypacf[i]*sqrtn
a<-table.element(a,round(mytstat,4))
a<-table.element(a,round(1-pt(abs(mytstat),lengthx),6))
a<-table.row.end(a)
}
a<-table.end(a)
table.save(a,file='mytable1.tab')