Free Statistics

of Irreproducible Research!

Author's title

Author*The author of this computation has been verified*
R Software Modulerwasp_autocorrelation.wasp
Title produced by software(Partial) Autocorrelation Function
Date of computationSat, 26 Dec 2009 09:50:21 -0700
Cite this page as followsStatistical Computations at FreeStatistics.org, Office for Research Development and Education, URL https://freestatistics.org/blog/index.php?v=date/2009/Dec/26/t1261846301ma1nbznohjcljcv.htm/, Retrieved Mon, 29 Apr 2024 00:31:23 +0000
Statistical Computations at FreeStatistics.org, Office for Research Development and Education, URL https://freestatistics.org/blog/index.php?pk=70761, Retrieved Mon, 29 Apr 2024 00:31:23 +0000
QR Codes:

Original text written by user:
IsPrivate?No (this computation is public)
User-defined keywords
Estimated Impact155
Family? (F = Feedback message, R = changed R code, M = changed R Module, P = changed Parameters, D = changed Data)
-     [Univariate Data Series] [Paper] [2009-12-21 20:42:12] [0df1a6455bedfaf424729b1e006090d0]
- RMPD    [(Partial) Autocorrelation Function] [Paper] [2009-12-26 16:50:21] [e2f800c9186517d2e5c4a809848912a7] [Current]
Feedback Forum

Post a new message
Dataseries X:
1.2613
1.2646
1.2262
1.1985
1.2007
1.2138
1.2266
1.2176
1.2218
1.249
1.2991
1.3408
1.3119
1.3014
1.3201
1.2938
1.2694
1.2165
1.2037
1.2292
1.2256
1.2015
1.1786
1.1856
1.2103
1.1938
1.202
1.2271
1.277
1.265
1.2684
1.2811
1.2727
1.2611
1.2881
1.3213
1.2999
1.3074
1.3242
1.3516
1.3511
1.3419
1.3716
1.3622
1.3896
1.4227
1.4684
1.457
1.4718
1.4748
1.5527
1.5751
1.5557
1.5553
1.577
1.4975
1.437
1.3322
1.2732
1.3449


Summary of computational transaction
Raw Inputview raw input (R code)
Raw Outputview raw output of R engine
Computing time1 seconds
R Server'Gwilym Jenkins' @ 72.249.127.135

\begin{tabular}{lllllllll}
\hline
Summary of computational transaction \tabularnewline
Raw Input & view raw input (R code)  \tabularnewline
Raw Output & view raw output of R engine  \tabularnewline
Computing time & 1 seconds \tabularnewline
R Server & 'Gwilym Jenkins' @ 72.249.127.135 \tabularnewline
\hline
\end{tabular}
%Source: https://freestatistics.org/blog/index.php?pk=70761&T=0

[TABLE]
[ROW][C]Summary of computational transaction[/C][/ROW]
[ROW][C]Raw Input[/C][C]view raw input (R code) [/C][/ROW]
[ROW][C]Raw Output[/C][C]view raw output of R engine [/C][/ROW]
[ROW][C]Computing time[/C][C]1 seconds[/C][/ROW]
[ROW][C]R Server[/C][C]'Gwilym Jenkins' @ 72.249.127.135[/C][/ROW]
[/TABLE]
Source: https://freestatistics.org/blog/index.php?pk=70761&T=0

Globally Unique Identifier (entire table): ba.freestatistics.org/blog/index.php?pk=70761&T=0

As an alternative you can also use a QR Code:  

The GUIDs for individual cells are displayed in the table below:

Summary of computational transaction
Raw Inputview raw input (R code)
Raw Outputview raw output of R engine
Computing time1 seconds
R Server'Gwilym Jenkins' @ 72.249.127.135


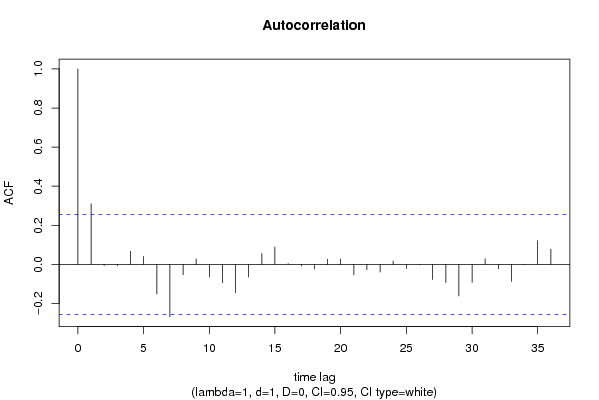
Autocorrelation Function
Time lag kACF(k)T-STATP-value
10.3097392.37910.010303
2-0.005487-0.04210.483262
3-0.006462-0.04960.48029
40.0671430.51570.303983
50.0408950.31410.377268
6-0.151012-1.15990.125371
7-0.267379-2.05380.022219
8-0.052942-0.40670.342865
90.0272550.20930.417448
10-0.064458-0.49510.31118
11-0.093409-0.71750.237953
12-0.145163-1.1150.134682
13-0.064337-0.49420.311506
140.0555760.42690.335508
150.0892090.68520.247941
160.0045710.03510.486056
17-0.007634-0.05860.47672
18-0.023093-0.17740.429909
190.0267150.20520.419059
200.0281680.21640.414725
21-0.053047-0.40750.342571
22-0.026791-0.20580.418833
23-0.039361-0.30230.38173
240.0171190.13150.447916
25-0.021058-0.16170.436028
26-0.002177-0.01670.493358
27-0.076923-0.59090.278436
28-0.093263-0.71640.238296
29-0.161208-1.23830.110262
30-0.092183-0.70810.240845
310.0290350.2230.412145
32-0.022761-0.17480.430905
33-0.087499-0.67210.252075
34-0.001811-0.01390.494475
350.1214380.93280.177367
360.0778210.59780.276146

\begin{tabular}{lllllllll}
\hline
Autocorrelation Function \tabularnewline
Time lag k & ACF(k) & T-STAT & P-value \tabularnewline
1 & 0.309739 & 2.3791 & 0.010303 \tabularnewline
2 & -0.005487 & -0.0421 & 0.483262 \tabularnewline
3 & -0.006462 & -0.0496 & 0.48029 \tabularnewline
4 & 0.067143 & 0.5157 & 0.303983 \tabularnewline
5 & 0.040895 & 0.3141 & 0.377268 \tabularnewline
6 & -0.151012 & -1.1599 & 0.125371 \tabularnewline
7 & -0.267379 & -2.0538 & 0.022219 \tabularnewline
8 & -0.052942 & -0.4067 & 0.342865 \tabularnewline
9 & 0.027255 & 0.2093 & 0.417448 \tabularnewline
10 & -0.064458 & -0.4951 & 0.31118 \tabularnewline
11 & -0.093409 & -0.7175 & 0.237953 \tabularnewline
12 & -0.145163 & -1.115 & 0.134682 \tabularnewline
13 & -0.064337 & -0.4942 & 0.311506 \tabularnewline
14 & 0.055576 & 0.4269 & 0.335508 \tabularnewline
15 & 0.089209 & 0.6852 & 0.247941 \tabularnewline
16 & 0.004571 & 0.0351 & 0.486056 \tabularnewline
17 & -0.007634 & -0.0586 & 0.47672 \tabularnewline
18 & -0.023093 & -0.1774 & 0.429909 \tabularnewline
19 & 0.026715 & 0.2052 & 0.419059 \tabularnewline
20 & 0.028168 & 0.2164 & 0.414725 \tabularnewline
21 & -0.053047 & -0.4075 & 0.342571 \tabularnewline
22 & -0.026791 & -0.2058 & 0.418833 \tabularnewline
23 & -0.039361 & -0.3023 & 0.38173 \tabularnewline
24 & 0.017119 & 0.1315 & 0.447916 \tabularnewline
25 & -0.021058 & -0.1617 & 0.436028 \tabularnewline
26 & -0.002177 & -0.0167 & 0.493358 \tabularnewline
27 & -0.076923 & -0.5909 & 0.278436 \tabularnewline
28 & -0.093263 & -0.7164 & 0.238296 \tabularnewline
29 & -0.161208 & -1.2383 & 0.110262 \tabularnewline
30 & -0.092183 & -0.7081 & 0.240845 \tabularnewline
31 & 0.029035 & 0.223 & 0.412145 \tabularnewline
32 & -0.022761 & -0.1748 & 0.430905 \tabularnewline
33 & -0.087499 & -0.6721 & 0.252075 \tabularnewline
34 & -0.001811 & -0.0139 & 0.494475 \tabularnewline
35 & 0.121438 & 0.9328 & 0.177367 \tabularnewline
36 & 0.077821 & 0.5978 & 0.276146 \tabularnewline
\hline
\end{tabular}
%Source: https://freestatistics.org/blog/index.php?pk=70761&T=1

[TABLE]
[ROW][C]Autocorrelation Function[/C][/ROW]
[ROW][C]Time lag k[/C][C]ACF(k)[/C][C]T-STAT[/C][C]P-value[/C][/ROW]
[ROW][C]1[/C][C]0.309739[/C][C]2.3791[/C][C]0.010303[/C][/ROW]
[ROW][C]2[/C][C]-0.005487[/C][C]-0.0421[/C][C]0.483262[/C][/ROW]
[ROW][C]3[/C][C]-0.006462[/C][C]-0.0496[/C][C]0.48029[/C][/ROW]
[ROW][C]4[/C][C]0.067143[/C][C]0.5157[/C][C]0.303983[/C][/ROW]
[ROW][C]5[/C][C]0.040895[/C][C]0.3141[/C][C]0.377268[/C][/ROW]
[ROW][C]6[/C][C]-0.151012[/C][C]-1.1599[/C][C]0.125371[/C][/ROW]
[ROW][C]7[/C][C]-0.267379[/C][C]-2.0538[/C][C]0.022219[/C][/ROW]
[ROW][C]8[/C][C]-0.052942[/C][C]-0.4067[/C][C]0.342865[/C][/ROW]
[ROW][C]9[/C][C]0.027255[/C][C]0.2093[/C][C]0.417448[/C][/ROW]
[ROW][C]10[/C][C]-0.064458[/C][C]-0.4951[/C][C]0.31118[/C][/ROW]
[ROW][C]11[/C][C]-0.093409[/C][C]-0.7175[/C][C]0.237953[/C][/ROW]
[ROW][C]12[/C][C]-0.145163[/C][C]-1.115[/C][C]0.134682[/C][/ROW]
[ROW][C]13[/C][C]-0.064337[/C][C]-0.4942[/C][C]0.311506[/C][/ROW]
[ROW][C]14[/C][C]0.055576[/C][C]0.4269[/C][C]0.335508[/C][/ROW]
[ROW][C]15[/C][C]0.089209[/C][C]0.6852[/C][C]0.247941[/C][/ROW]
[ROW][C]16[/C][C]0.004571[/C][C]0.0351[/C][C]0.486056[/C][/ROW]
[ROW][C]17[/C][C]-0.007634[/C][C]-0.0586[/C][C]0.47672[/C][/ROW]
[ROW][C]18[/C][C]-0.023093[/C][C]-0.1774[/C][C]0.429909[/C][/ROW]
[ROW][C]19[/C][C]0.026715[/C][C]0.2052[/C][C]0.419059[/C][/ROW]
[ROW][C]20[/C][C]0.028168[/C][C]0.2164[/C][C]0.414725[/C][/ROW]
[ROW][C]21[/C][C]-0.053047[/C][C]-0.4075[/C][C]0.342571[/C][/ROW]
[ROW][C]22[/C][C]-0.026791[/C][C]-0.2058[/C][C]0.418833[/C][/ROW]
[ROW][C]23[/C][C]-0.039361[/C][C]-0.3023[/C][C]0.38173[/C][/ROW]
[ROW][C]24[/C][C]0.017119[/C][C]0.1315[/C][C]0.447916[/C][/ROW]
[ROW][C]25[/C][C]-0.021058[/C][C]-0.1617[/C][C]0.436028[/C][/ROW]
[ROW][C]26[/C][C]-0.002177[/C][C]-0.0167[/C][C]0.493358[/C][/ROW]
[ROW][C]27[/C][C]-0.076923[/C][C]-0.5909[/C][C]0.278436[/C][/ROW]
[ROW][C]28[/C][C]-0.093263[/C][C]-0.7164[/C][C]0.238296[/C][/ROW]
[ROW][C]29[/C][C]-0.161208[/C][C]-1.2383[/C][C]0.110262[/C][/ROW]
[ROW][C]30[/C][C]-0.092183[/C][C]-0.7081[/C][C]0.240845[/C][/ROW]
[ROW][C]31[/C][C]0.029035[/C][C]0.223[/C][C]0.412145[/C][/ROW]
[ROW][C]32[/C][C]-0.022761[/C][C]-0.1748[/C][C]0.430905[/C][/ROW]
[ROW][C]33[/C][C]-0.087499[/C][C]-0.6721[/C][C]0.252075[/C][/ROW]
[ROW][C]34[/C][C]-0.001811[/C][C]-0.0139[/C][C]0.494475[/C][/ROW]
[ROW][C]35[/C][C]0.121438[/C][C]0.9328[/C][C]0.177367[/C][/ROW]
[ROW][C]36[/C][C]0.077821[/C][C]0.5978[/C][C]0.276146[/C][/ROW]
[/TABLE]
Source: https://freestatistics.org/blog/index.php?pk=70761&T=1

Globally Unique Identifier (entire table): ba.freestatistics.org/blog/index.php?pk=70761&T=1

As an alternative you can also use a QR Code:  

The GUIDs for individual cells are displayed in the table below:

Autocorrelation Function
Time lag kACF(k)T-STATP-value
10.3097392.37910.010303
2-0.005487-0.04210.483262
3-0.006462-0.04960.48029
40.0671430.51570.303983
50.0408950.31410.377268
6-0.151012-1.15990.125371
7-0.267379-2.05380.022219
8-0.052942-0.40670.342865
90.0272550.20930.417448
10-0.064458-0.49510.31118
11-0.093409-0.71750.237953
12-0.145163-1.1150.134682
13-0.064337-0.49420.311506
140.0555760.42690.335508
150.0892090.68520.247941
160.0045710.03510.486056
17-0.007634-0.05860.47672
18-0.023093-0.17740.429909
190.0267150.20520.419059
200.0281680.21640.414725
21-0.053047-0.40750.342571
22-0.026791-0.20580.418833
23-0.039361-0.30230.38173
240.0171190.13150.447916
25-0.021058-0.16170.436028
26-0.002177-0.01670.493358
27-0.076923-0.59090.278436
28-0.093263-0.71640.238296
29-0.161208-1.23830.110262
30-0.092183-0.70810.240845
310.0290350.2230.412145
32-0.022761-0.17480.430905
33-0.087499-0.67210.252075
34-0.001811-0.01390.494475
350.1214380.93280.177367
360.0778210.59780.276146


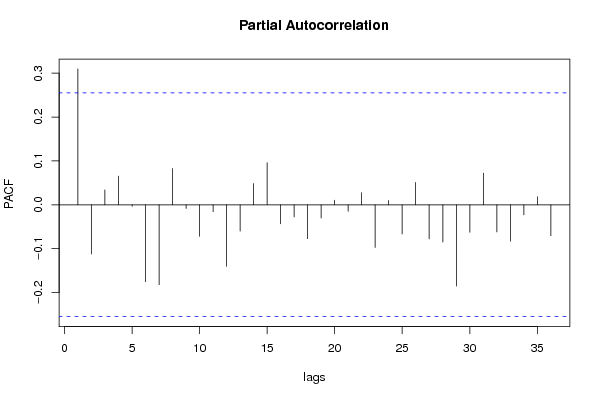
Partial Autocorrelation Function
Time lag kPACF(k)T-STATP-value
10.3097392.37910.010303
2-0.112188-0.86170.196161
30.0338050.25970.398014
40.065320.50170.308862
5-0.003672-0.02820.488797
6-0.17552-1.34820.091375
7-0.182205-1.39950.083444
80.0826310.63470.264038
9-0.008327-0.0640.474608
10-0.071993-0.5530.291181
11-0.01584-0.12170.451788
12-0.140313-1.07780.142762
13-0.059994-0.46080.323311
140.0483270.37120.355907
150.0959620.73710.231991
16-0.043565-0.33460.369547
17-0.027631-0.21220.416328
18-0.077373-0.59430.277288
19-0.030091-0.23110.409006
200.0104220.08010.468233
21-0.014866-0.11420.454738
220.0276110.21210.416385
23-0.09726-0.74710.228994
240.0098830.07590.469873
25-0.066637-0.51180.305335
260.0508520.39060.348749
27-0.077896-0.59830.275954
28-0.084997-0.65290.258186
29-0.185303-1.42330.079952
30-0.062909-0.48320.315367
310.0719930.5530.291181
32-0.062084-0.47690.317605
33-0.083051-0.63790.262994
34-0.023028-0.17690.430103
350.0180180.13840.445199
36-0.070412-0.54080.295326

\begin{tabular}{lllllllll}
\hline
Partial Autocorrelation Function \tabularnewline
Time lag k & PACF(k) & T-STAT & P-value \tabularnewline
1 & 0.309739 & 2.3791 & 0.010303 \tabularnewline
2 & -0.112188 & -0.8617 & 0.196161 \tabularnewline
3 & 0.033805 & 0.2597 & 0.398014 \tabularnewline
4 & 0.06532 & 0.5017 & 0.308862 \tabularnewline
5 & -0.003672 & -0.0282 & 0.488797 \tabularnewline
6 & -0.17552 & -1.3482 & 0.091375 \tabularnewline
7 & -0.182205 & -1.3995 & 0.083444 \tabularnewline
8 & 0.082631 & 0.6347 & 0.264038 \tabularnewline
9 & -0.008327 & -0.064 & 0.474608 \tabularnewline
10 & -0.071993 & -0.553 & 0.291181 \tabularnewline
11 & -0.01584 & -0.1217 & 0.451788 \tabularnewline
12 & -0.140313 & -1.0778 & 0.142762 \tabularnewline
13 & -0.059994 & -0.4608 & 0.323311 \tabularnewline
14 & 0.048327 & 0.3712 & 0.355907 \tabularnewline
15 & 0.095962 & 0.7371 & 0.231991 \tabularnewline
16 & -0.043565 & -0.3346 & 0.369547 \tabularnewline
17 & -0.027631 & -0.2122 & 0.416328 \tabularnewline
18 & -0.077373 & -0.5943 & 0.277288 \tabularnewline
19 & -0.030091 & -0.2311 & 0.409006 \tabularnewline
20 & 0.010422 & 0.0801 & 0.468233 \tabularnewline
21 & -0.014866 & -0.1142 & 0.454738 \tabularnewline
22 & 0.027611 & 0.2121 & 0.416385 \tabularnewline
23 & -0.09726 & -0.7471 & 0.228994 \tabularnewline
24 & 0.009883 & 0.0759 & 0.469873 \tabularnewline
25 & -0.066637 & -0.5118 & 0.305335 \tabularnewline
26 & 0.050852 & 0.3906 & 0.348749 \tabularnewline
27 & -0.077896 & -0.5983 & 0.275954 \tabularnewline
28 & -0.084997 & -0.6529 & 0.258186 \tabularnewline
29 & -0.185303 & -1.4233 & 0.079952 \tabularnewline
30 & -0.062909 & -0.4832 & 0.315367 \tabularnewline
31 & 0.071993 & 0.553 & 0.291181 \tabularnewline
32 & -0.062084 & -0.4769 & 0.317605 \tabularnewline
33 & -0.083051 & -0.6379 & 0.262994 \tabularnewline
34 & -0.023028 & -0.1769 & 0.430103 \tabularnewline
35 & 0.018018 & 0.1384 & 0.445199 \tabularnewline
36 & -0.070412 & -0.5408 & 0.295326 \tabularnewline
\hline
\end{tabular}
%Source: https://freestatistics.org/blog/index.php?pk=70761&T=2

[TABLE]
[ROW][C]Partial Autocorrelation Function[/C][/ROW]
[ROW][C]Time lag k[/C][C]PACF(k)[/C][C]T-STAT[/C][C]P-value[/C][/ROW]
[ROW][C]1[/C][C]0.309739[/C][C]2.3791[/C][C]0.010303[/C][/ROW]
[ROW][C]2[/C][C]-0.112188[/C][C]-0.8617[/C][C]0.196161[/C][/ROW]
[ROW][C]3[/C][C]0.033805[/C][C]0.2597[/C][C]0.398014[/C][/ROW]
[ROW][C]4[/C][C]0.06532[/C][C]0.5017[/C][C]0.308862[/C][/ROW]
[ROW][C]5[/C][C]-0.003672[/C][C]-0.0282[/C][C]0.488797[/C][/ROW]
[ROW][C]6[/C][C]-0.17552[/C][C]-1.3482[/C][C]0.091375[/C][/ROW]
[ROW][C]7[/C][C]-0.182205[/C][C]-1.3995[/C][C]0.083444[/C][/ROW]
[ROW][C]8[/C][C]0.082631[/C][C]0.6347[/C][C]0.264038[/C][/ROW]
[ROW][C]9[/C][C]-0.008327[/C][C]-0.064[/C][C]0.474608[/C][/ROW]
[ROW][C]10[/C][C]-0.071993[/C][C]-0.553[/C][C]0.291181[/C][/ROW]
[ROW][C]11[/C][C]-0.01584[/C][C]-0.1217[/C][C]0.451788[/C][/ROW]
[ROW][C]12[/C][C]-0.140313[/C][C]-1.0778[/C][C]0.142762[/C][/ROW]
[ROW][C]13[/C][C]-0.059994[/C][C]-0.4608[/C][C]0.323311[/C][/ROW]
[ROW][C]14[/C][C]0.048327[/C][C]0.3712[/C][C]0.355907[/C][/ROW]
[ROW][C]15[/C][C]0.095962[/C][C]0.7371[/C][C]0.231991[/C][/ROW]
[ROW][C]16[/C][C]-0.043565[/C][C]-0.3346[/C][C]0.369547[/C][/ROW]
[ROW][C]17[/C][C]-0.027631[/C][C]-0.2122[/C][C]0.416328[/C][/ROW]
[ROW][C]18[/C][C]-0.077373[/C][C]-0.5943[/C][C]0.277288[/C][/ROW]
[ROW][C]19[/C][C]-0.030091[/C][C]-0.2311[/C][C]0.409006[/C][/ROW]
[ROW][C]20[/C][C]0.010422[/C][C]0.0801[/C][C]0.468233[/C][/ROW]
[ROW][C]21[/C][C]-0.014866[/C][C]-0.1142[/C][C]0.454738[/C][/ROW]
[ROW][C]22[/C][C]0.027611[/C][C]0.2121[/C][C]0.416385[/C][/ROW]
[ROW][C]23[/C][C]-0.09726[/C][C]-0.7471[/C][C]0.228994[/C][/ROW]
[ROW][C]24[/C][C]0.009883[/C][C]0.0759[/C][C]0.469873[/C][/ROW]
[ROW][C]25[/C][C]-0.066637[/C][C]-0.5118[/C][C]0.305335[/C][/ROW]
[ROW][C]26[/C][C]0.050852[/C][C]0.3906[/C][C]0.348749[/C][/ROW]
[ROW][C]27[/C][C]-0.077896[/C][C]-0.5983[/C][C]0.275954[/C][/ROW]
[ROW][C]28[/C][C]-0.084997[/C][C]-0.6529[/C][C]0.258186[/C][/ROW]
[ROW][C]29[/C][C]-0.185303[/C][C]-1.4233[/C][C]0.079952[/C][/ROW]
[ROW][C]30[/C][C]-0.062909[/C][C]-0.4832[/C][C]0.315367[/C][/ROW]
[ROW][C]31[/C][C]0.071993[/C][C]0.553[/C][C]0.291181[/C][/ROW]
[ROW][C]32[/C][C]-0.062084[/C][C]-0.4769[/C][C]0.317605[/C][/ROW]
[ROW][C]33[/C][C]-0.083051[/C][C]-0.6379[/C][C]0.262994[/C][/ROW]
[ROW][C]34[/C][C]-0.023028[/C][C]-0.1769[/C][C]0.430103[/C][/ROW]
[ROW][C]35[/C][C]0.018018[/C][C]0.1384[/C][C]0.445199[/C][/ROW]
[ROW][C]36[/C][C]-0.070412[/C][C]-0.5408[/C][C]0.295326[/C][/ROW]
[/TABLE]
Source: https://freestatistics.org/blog/index.php?pk=70761&T=2

Globally Unique Identifier (entire table): ba.freestatistics.org/blog/index.php?pk=70761&T=2

As an alternative you can also use a QR Code:  

The GUIDs for individual cells are displayed in the table below:

Partial Autocorrelation Function
Time lag kPACF(k)T-STATP-value
10.3097392.37910.010303
2-0.112188-0.86170.196161
30.0338050.25970.398014
40.065320.50170.308862
5-0.003672-0.02820.488797
6-0.17552-1.34820.091375
7-0.182205-1.39950.083444
80.0826310.63470.264038
9-0.008327-0.0640.474608
10-0.071993-0.5530.291181
11-0.01584-0.12170.451788
12-0.140313-1.07780.142762
13-0.059994-0.46080.323311
140.0483270.37120.355907
150.0959620.73710.231991
16-0.043565-0.33460.369547
17-0.027631-0.21220.416328
18-0.077373-0.59430.277288
19-0.030091-0.23110.409006
200.0104220.08010.468233
21-0.014866-0.11420.454738
220.0276110.21210.416385
23-0.09726-0.74710.228994
240.0098830.07590.469873
25-0.066637-0.51180.305335
260.0508520.39060.348749
27-0.077896-0.59830.275954
28-0.084997-0.65290.258186
29-0.185303-1.42330.079952
30-0.062909-0.48320.315367
310.0719930.5530.291181
32-0.062084-0.47690.317605
33-0.083051-0.63790.262994
34-0.023028-0.17690.430103
350.0180180.13840.445199
36-0.070412-0.54080.295326


Parameters (Session):
par1 = 1 ;
Parameters (R input):
par1 = 36 ; par2 = 1 ; par3 = 1 ; par4 = 0 ; par5 = 12 ; par6 = White Noise ; par7 = 0.95 ;
R code (references can be found in the software module):
if (par1 == 'Default') {
par1 = 10*log10(length(x))
} else {
par1 <- as.numeric(par1)
}
par2 <- as.numeric(par2)
par3 <- as.numeric(par3)
par4 <- as.numeric(par4)
par5 <- as.numeric(par5)
if (par6 == 'White Noise') par6 <- 'white' else par6 <- 'ma'
par7 <- as.numeric(par7)
if (par2 == 0) {
x <- log(x)
} else {
x <- (x ^ par2 - 1) / par2
}
if (par3 > 0) x <- diff(x,lag=1,difference=par3)
if (par4 > 0) x <- diff(x,lag=par5,difference=par4)
bitmap(file='pic1.png')
racf <- acf(x, par1, main='Autocorrelation', xlab='time lag', ylab='ACF', ci.type=par6, ci=par7, sub=paste('(lambda=',par2,', d=',par3,', D=',par4,', CI=', par7, ', CI type=',par6,')',sep=''))
dev.off()
bitmap(file='pic2.png')
rpacf <- pacf(x,par1,main='Partial Autocorrelation',xlab='lags',ylab='PACF')
dev.off()
(myacf <- c(racf$acf))
(mypacf <- c(rpacf$acf))
lengthx <- length(x)
sqrtn <- sqrt(lengthx)
load(file='createtable')
a<-table.start()
a<-table.row.start(a)
a<-table.element(a,'Autocorrelation Function',4,TRUE)
a<-table.row.end(a)
a<-table.row.start(a)
a<-table.element(a,'Time lag k',header=TRUE)
a<-table.element(a,hyperlink('basics.htm','ACF(k)','click here for more information about the Autocorrelation Function'),header=TRUE)
a<-table.element(a,'T-STAT',header=TRUE)
a<-table.element(a,'P-value',header=TRUE)
a<-table.row.end(a)
for (i in 2:(par1+1)) {
a<-table.row.start(a)
a<-table.element(a,i-1,header=TRUE)
a<-table.element(a,round(myacf[i],6))
mytstat <- myacf[i]*sqrtn
a<-table.element(a,round(mytstat,4))
a<-table.element(a,round(1-pt(abs(mytstat),lengthx),6))
a<-table.row.end(a)
}
a<-table.end(a)
table.save(a,file='mytable.tab')
a<-table.start()
a<-table.row.start(a)
a<-table.element(a,'Partial Autocorrelation Function',4,TRUE)
a<-table.row.end(a)
a<-table.row.start(a)
a<-table.element(a,'Time lag k',header=TRUE)
a<-table.element(a,hyperlink('basics.htm','PACF(k)','click here for more information about the Partial Autocorrelation Function'),header=TRUE)
a<-table.element(a,'T-STAT',header=TRUE)
a<-table.element(a,'P-value',header=TRUE)
a<-table.row.end(a)
for (i in 1:par1) {
a<-table.row.start(a)
a<-table.element(a,i,header=TRUE)
a<-table.element(a,round(mypacf[i],6))
mytstat <- mypacf[i]*sqrtn
a<-table.element(a,round(mytstat,4))
a<-table.element(a,round(1-pt(abs(mytstat),lengthx),6))
a<-table.row.end(a)
}
a<-table.end(a)
table.save(a,file='mytable1.tab')