Free Statistics

of Irreproducible Research!

Author's title

Author*The author of this computation has been verified*
R Software Modulerwasp_autocorrelation.wasp
Title produced by software(Partial) Autocorrelation Function
Date of computationSat, 26 Dec 2009 09:53:41 -0700
Cite this page as followsStatistical Computations at FreeStatistics.org, Office for Research Development and Education, URL https://freestatistics.org/blog/index.php?v=date/2009/Dec/26/t1261846494t5mhchx3cfcaenq.htm/, Retrieved Sun, 28 Apr 2024 19:32:52 +0000
Statistical Computations at FreeStatistics.org, Office for Research Development and Education, URL https://freestatistics.org/blog/index.php?pk=70762, Retrieved Sun, 28 Apr 2024 19:32:52 +0000
QR Codes:

Original text written by user:
IsPrivate?No (this computation is public)
User-defined keywords
Estimated Impact175
Family? (F = Feedback message, R = changed R code, M = changed R Module, P = changed Parameters, D = changed Data)
-     [Univariate Data Series] [Paper] [2009-12-21 20:42:12] [0df1a6455bedfaf424729b1e006090d0]
- RMPD    [(Partial) Autocorrelation Function] [Paper] [2009-12-26 16:53:41] [e2f800c9186517d2e5c4a809848912a7] [Current]
Feedback Forum

Post a new message
Dataseries X:
1.2613
1.2646
1.2262
1.1985
1.2007
1.2138
1.2266
1.2176
1.2218
1.249
1.2991
1.3408
1.3119
1.3014
1.3201
1.2938
1.2694
1.2165
1.2037
1.2292
1.2256
1.2015
1.1786
1.1856
1.2103
1.1938
1.202
1.2271
1.277
1.265
1.2684
1.2811
1.2727
1.2611
1.2881
1.3213
1.2999
1.3074
1.3242
1.3516
1.3511
1.3419
1.3716
1.3622
1.3896
1.4227
1.4684
1.457
1.4718
1.4748
1.5527
1.5751
1.5557
1.5553
1.577
1.4975
1.437
1.3322
1.2732
1.3449


Summary of computational transaction
Raw Inputview raw input (R code)
Raw Outputview raw output of R engine
Computing time1 seconds
R Server'Gwilym Jenkins' @ 72.249.127.135

\begin{tabular}{lllllllll}
\hline
Summary of computational transaction \tabularnewline
Raw Input & view raw input (R code)  \tabularnewline
Raw Output & view raw output of R engine  \tabularnewline
Computing time & 1 seconds \tabularnewline
R Server & 'Gwilym Jenkins' @ 72.249.127.135 \tabularnewline
\hline
\end{tabular}
%Source: https://freestatistics.org/blog/index.php?pk=70762&T=0

[TABLE]
[ROW][C]Summary of computational transaction[/C][/ROW]
[ROW][C]Raw Input[/C][C]view raw input (R code) [/C][/ROW]
[ROW][C]Raw Output[/C][C]view raw output of R engine [/C][/ROW]
[ROW][C]Computing time[/C][C]1 seconds[/C][/ROW]
[ROW][C]R Server[/C][C]'Gwilym Jenkins' @ 72.249.127.135[/C][/ROW]
[/TABLE]
Source: https://freestatistics.org/blog/index.php?pk=70762&T=0

Globally Unique Identifier (entire table): ba.freestatistics.org/blog/index.php?pk=70762&T=0

As an alternative you can also use a QR Code:  

The GUIDs for individual cells are displayed in the table below:

Summary of computational transaction
Raw Inputview raw input (R code)
Raw Outputview raw output of R engine
Computing time1 seconds
R Server'Gwilym Jenkins' @ 72.249.127.135


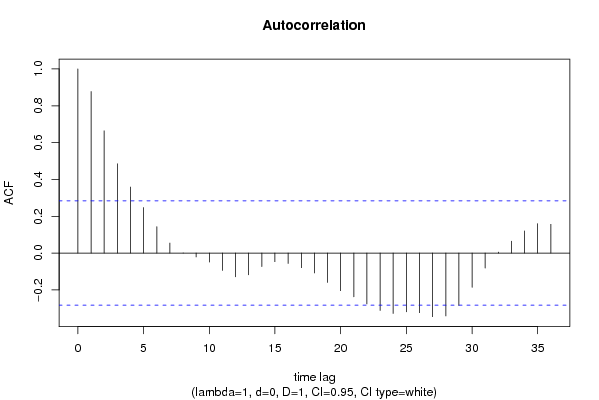
Autocorrelation Function
Time lag kACF(k)T-STATP-value
10.8773666.07860
20.6637554.59861.6e-05
30.4851563.36130.000765
40.3586542.48480.00825
50.2471571.71240.046643
60.143310.99290.162874
70.0545040.37760.353691
80.0007370.00510.497972
9-0.021061-0.14590.442299
10-0.048833-0.33830.368297
11-0.093928-0.65080.259155
12-0.128916-0.89320.188116
13-0.118151-0.81860.208537
14-0.07341-0.50860.306681
15-0.04656-0.32260.374208
16-0.056145-0.3890.349505
17-0.079668-0.5520.291769
18-0.107951-0.74790.229082
19-0.159154-1.10270.137838
20-0.20443-1.41630.081568
21-0.237719-1.6470.053048
22-0.275846-1.91110.030985
23-0.311208-2.15610.018058
24-0.327803-2.27110.013833
25-0.319202-2.21150.015898
26-0.323957-2.24440.014725
27-0.34522-2.39180.010367
28-0.341702-2.36740.010997
29-0.284613-1.97190.027202
30-0.186081-1.28920.101752
31-0.081325-0.56340.28788
320.0052160.03610.485661
330.0647980.44890.32775
340.1205040.83490.203962
350.1594381.10460.137415
360.1562391.08250.142229

\begin{tabular}{lllllllll}
\hline
Autocorrelation Function \tabularnewline
Time lag k & ACF(k) & T-STAT & P-value \tabularnewline
1 & 0.877366 & 6.0786 & 0 \tabularnewline
2 & 0.663755 & 4.5986 & 1.6e-05 \tabularnewline
3 & 0.485156 & 3.3613 & 0.000765 \tabularnewline
4 & 0.358654 & 2.4848 & 0.00825 \tabularnewline
5 & 0.247157 & 1.7124 & 0.046643 \tabularnewline
6 & 0.14331 & 0.9929 & 0.162874 \tabularnewline
7 & 0.054504 & 0.3776 & 0.353691 \tabularnewline
8 & 0.000737 & 0.0051 & 0.497972 \tabularnewline
9 & -0.021061 & -0.1459 & 0.442299 \tabularnewline
10 & -0.048833 & -0.3383 & 0.368297 \tabularnewline
11 & -0.093928 & -0.6508 & 0.259155 \tabularnewline
12 & -0.128916 & -0.8932 & 0.188116 \tabularnewline
13 & -0.118151 & -0.8186 & 0.208537 \tabularnewline
14 & -0.07341 & -0.5086 & 0.306681 \tabularnewline
15 & -0.04656 & -0.3226 & 0.374208 \tabularnewline
16 & -0.056145 & -0.389 & 0.349505 \tabularnewline
17 & -0.079668 & -0.552 & 0.291769 \tabularnewline
18 & -0.107951 & -0.7479 & 0.229082 \tabularnewline
19 & -0.159154 & -1.1027 & 0.137838 \tabularnewline
20 & -0.20443 & -1.4163 & 0.081568 \tabularnewline
21 & -0.237719 & -1.647 & 0.053048 \tabularnewline
22 & -0.275846 & -1.9111 & 0.030985 \tabularnewline
23 & -0.311208 & -2.1561 & 0.018058 \tabularnewline
24 & -0.327803 & -2.2711 & 0.013833 \tabularnewline
25 & -0.319202 & -2.2115 & 0.015898 \tabularnewline
26 & -0.323957 & -2.2444 & 0.014725 \tabularnewline
27 & -0.34522 & -2.3918 & 0.010367 \tabularnewline
28 & -0.341702 & -2.3674 & 0.010997 \tabularnewline
29 & -0.284613 & -1.9719 & 0.027202 \tabularnewline
30 & -0.186081 & -1.2892 & 0.101752 \tabularnewline
31 & -0.081325 & -0.5634 & 0.28788 \tabularnewline
32 & 0.005216 & 0.0361 & 0.485661 \tabularnewline
33 & 0.064798 & 0.4489 & 0.32775 \tabularnewline
34 & 0.120504 & 0.8349 & 0.203962 \tabularnewline
35 & 0.159438 & 1.1046 & 0.137415 \tabularnewline
36 & 0.156239 & 1.0825 & 0.142229 \tabularnewline
\hline
\end{tabular}
%Source: https://freestatistics.org/blog/index.php?pk=70762&T=1

[TABLE]
[ROW][C]Autocorrelation Function[/C][/ROW]
[ROW][C]Time lag k[/C][C]ACF(k)[/C][C]T-STAT[/C][C]P-value[/C][/ROW]
[ROW][C]1[/C][C]0.877366[/C][C]6.0786[/C][C]0[/C][/ROW]
[ROW][C]2[/C][C]0.663755[/C][C]4.5986[/C][C]1.6e-05[/C][/ROW]
[ROW][C]3[/C][C]0.485156[/C][C]3.3613[/C][C]0.000765[/C][/ROW]
[ROW][C]4[/C][C]0.358654[/C][C]2.4848[/C][C]0.00825[/C][/ROW]
[ROW][C]5[/C][C]0.247157[/C][C]1.7124[/C][C]0.046643[/C][/ROW]
[ROW][C]6[/C][C]0.14331[/C][C]0.9929[/C][C]0.162874[/C][/ROW]
[ROW][C]7[/C][C]0.054504[/C][C]0.3776[/C][C]0.353691[/C][/ROW]
[ROW][C]8[/C][C]0.000737[/C][C]0.0051[/C][C]0.497972[/C][/ROW]
[ROW][C]9[/C][C]-0.021061[/C][C]-0.1459[/C][C]0.442299[/C][/ROW]
[ROW][C]10[/C][C]-0.048833[/C][C]-0.3383[/C][C]0.368297[/C][/ROW]
[ROW][C]11[/C][C]-0.093928[/C][C]-0.6508[/C][C]0.259155[/C][/ROW]
[ROW][C]12[/C][C]-0.128916[/C][C]-0.8932[/C][C]0.188116[/C][/ROW]
[ROW][C]13[/C][C]-0.118151[/C][C]-0.8186[/C][C]0.208537[/C][/ROW]
[ROW][C]14[/C][C]-0.07341[/C][C]-0.5086[/C][C]0.306681[/C][/ROW]
[ROW][C]15[/C][C]-0.04656[/C][C]-0.3226[/C][C]0.374208[/C][/ROW]
[ROW][C]16[/C][C]-0.056145[/C][C]-0.389[/C][C]0.349505[/C][/ROW]
[ROW][C]17[/C][C]-0.079668[/C][C]-0.552[/C][C]0.291769[/C][/ROW]
[ROW][C]18[/C][C]-0.107951[/C][C]-0.7479[/C][C]0.229082[/C][/ROW]
[ROW][C]19[/C][C]-0.159154[/C][C]-1.1027[/C][C]0.137838[/C][/ROW]
[ROW][C]20[/C][C]-0.20443[/C][C]-1.4163[/C][C]0.081568[/C][/ROW]
[ROW][C]21[/C][C]-0.237719[/C][C]-1.647[/C][C]0.053048[/C][/ROW]
[ROW][C]22[/C][C]-0.275846[/C][C]-1.9111[/C][C]0.030985[/C][/ROW]
[ROW][C]23[/C][C]-0.311208[/C][C]-2.1561[/C][C]0.018058[/C][/ROW]
[ROW][C]24[/C][C]-0.327803[/C][C]-2.2711[/C][C]0.013833[/C][/ROW]
[ROW][C]25[/C][C]-0.319202[/C][C]-2.2115[/C][C]0.015898[/C][/ROW]
[ROW][C]26[/C][C]-0.323957[/C][C]-2.2444[/C][C]0.014725[/C][/ROW]
[ROW][C]27[/C][C]-0.34522[/C][C]-2.3918[/C][C]0.010367[/C][/ROW]
[ROW][C]28[/C][C]-0.341702[/C][C]-2.3674[/C][C]0.010997[/C][/ROW]
[ROW][C]29[/C][C]-0.284613[/C][C]-1.9719[/C][C]0.027202[/C][/ROW]
[ROW][C]30[/C][C]-0.186081[/C][C]-1.2892[/C][C]0.101752[/C][/ROW]
[ROW][C]31[/C][C]-0.081325[/C][C]-0.5634[/C][C]0.28788[/C][/ROW]
[ROW][C]32[/C][C]0.005216[/C][C]0.0361[/C][C]0.485661[/C][/ROW]
[ROW][C]33[/C][C]0.064798[/C][C]0.4489[/C][C]0.32775[/C][/ROW]
[ROW][C]34[/C][C]0.120504[/C][C]0.8349[/C][C]0.203962[/C][/ROW]
[ROW][C]35[/C][C]0.159438[/C][C]1.1046[/C][C]0.137415[/C][/ROW]
[ROW][C]36[/C][C]0.156239[/C][C]1.0825[/C][C]0.142229[/C][/ROW]
[/TABLE]
Source: https://freestatistics.org/blog/index.php?pk=70762&T=1

Globally Unique Identifier (entire table): ba.freestatistics.org/blog/index.php?pk=70762&T=1

As an alternative you can also use a QR Code:  

The GUIDs for individual cells are displayed in the table below:

Autocorrelation Function
Time lag kACF(k)T-STATP-value
10.8773666.07860
20.6637554.59861.6e-05
30.4851563.36130.000765
40.3586542.48480.00825
50.2471571.71240.046643
60.143310.99290.162874
70.0545040.37760.353691
80.0007370.00510.497972
9-0.021061-0.14590.442299
10-0.048833-0.33830.368297
11-0.093928-0.65080.259155
12-0.128916-0.89320.188116
13-0.118151-0.81860.208537
14-0.07341-0.50860.306681
15-0.04656-0.32260.374208
16-0.056145-0.3890.349505
17-0.079668-0.5520.291769
18-0.107951-0.74790.229082
19-0.159154-1.10270.137838
20-0.20443-1.41630.081568
21-0.237719-1.6470.053048
22-0.275846-1.91110.030985
23-0.311208-2.15610.018058
24-0.327803-2.27110.013833
25-0.319202-2.21150.015898
26-0.323957-2.24440.014725
27-0.34522-2.39180.010367
28-0.341702-2.36740.010997
29-0.284613-1.97190.027202
30-0.186081-1.28920.101752
31-0.081325-0.56340.28788
320.0052160.03610.485661
330.0647980.44890.32775
340.1205040.83490.203962
350.1594381.10460.137415
360.1562391.08250.142229


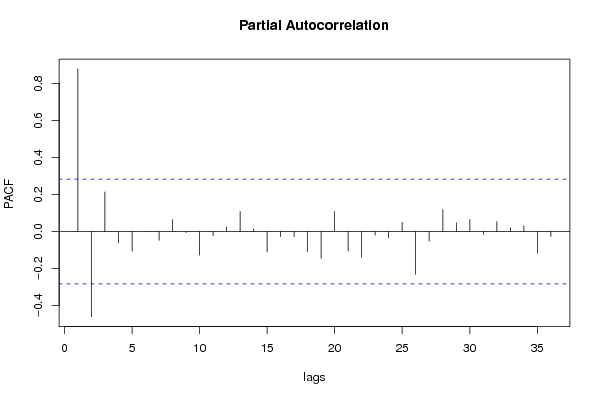
Partial Autocorrelation Function
Time lag kPACF(k)T-STATP-value
10.8773666.07860
2-0.460483-3.19030.001253
30.2130331.47590.073246
4-0.061658-0.42720.335578
5-0.106005-0.73440.233132
60.0002860.0020.499214
7-0.04811-0.33330.370175
80.0640320.44360.329654
9-0.006286-0.04350.482722
10-0.127989-0.88670.189823
11-0.022506-0.15590.438371
120.0236420.16380.435289
130.1073590.74380.230311
140.0132230.09160.463695
15-0.110975-0.76890.222873
16-0.027758-0.19230.424155
17-0.029571-0.20490.419267
18-0.108719-0.75320.227496
19-0.145671-1.00920.158961
200.1074960.74480.230027
21-0.105648-0.73190.233879
22-0.139132-0.96390.169955
23-0.019816-0.13730.445688
24-0.035523-0.24610.403322
250.0481080.33330.370178
26-0.23106-1.60080.057988
27-0.052829-0.3660.357982
280.1174640.81380.209885
290.0462450.32040.37503
300.0636070.44070.33071
31-0.015925-0.11030.456302
320.0529010.36650.357797
330.019040.13190.447801
340.0296160.20520.419147
35-0.117561-0.81450.209694
36-0.02711-0.18780.425904

\begin{tabular}{lllllllll}
\hline
Partial Autocorrelation Function \tabularnewline
Time lag k & PACF(k) & T-STAT & P-value \tabularnewline
1 & 0.877366 & 6.0786 & 0 \tabularnewline
2 & -0.460483 & -3.1903 & 0.001253 \tabularnewline
3 & 0.213033 & 1.4759 & 0.073246 \tabularnewline
4 & -0.061658 & -0.4272 & 0.335578 \tabularnewline
5 & -0.106005 & -0.7344 & 0.233132 \tabularnewline
6 & 0.000286 & 0.002 & 0.499214 \tabularnewline
7 & -0.04811 & -0.3333 & 0.370175 \tabularnewline
8 & 0.064032 & 0.4436 & 0.329654 \tabularnewline
9 & -0.006286 & -0.0435 & 0.482722 \tabularnewline
10 & -0.127989 & -0.8867 & 0.189823 \tabularnewline
11 & -0.022506 & -0.1559 & 0.438371 \tabularnewline
12 & 0.023642 & 0.1638 & 0.435289 \tabularnewline
13 & 0.107359 & 0.7438 & 0.230311 \tabularnewline
14 & 0.013223 & 0.0916 & 0.463695 \tabularnewline
15 & -0.110975 & -0.7689 & 0.222873 \tabularnewline
16 & -0.027758 & -0.1923 & 0.424155 \tabularnewline
17 & -0.029571 & -0.2049 & 0.419267 \tabularnewline
18 & -0.108719 & -0.7532 & 0.227496 \tabularnewline
19 & -0.145671 & -1.0092 & 0.158961 \tabularnewline
20 & 0.107496 & 0.7448 & 0.230027 \tabularnewline
21 & -0.105648 & -0.7319 & 0.233879 \tabularnewline
22 & -0.139132 & -0.9639 & 0.169955 \tabularnewline
23 & -0.019816 & -0.1373 & 0.445688 \tabularnewline
24 & -0.035523 & -0.2461 & 0.403322 \tabularnewline
25 & 0.048108 & 0.3333 & 0.370178 \tabularnewline
26 & -0.23106 & -1.6008 & 0.057988 \tabularnewline
27 & -0.052829 & -0.366 & 0.357982 \tabularnewline
28 & 0.117464 & 0.8138 & 0.209885 \tabularnewline
29 & 0.046245 & 0.3204 & 0.37503 \tabularnewline
30 & 0.063607 & 0.4407 & 0.33071 \tabularnewline
31 & -0.015925 & -0.1103 & 0.456302 \tabularnewline
32 & 0.052901 & 0.3665 & 0.357797 \tabularnewline
33 & 0.01904 & 0.1319 & 0.447801 \tabularnewline
34 & 0.029616 & 0.2052 & 0.419147 \tabularnewline
35 & -0.117561 & -0.8145 & 0.209694 \tabularnewline
36 & -0.02711 & -0.1878 & 0.425904 \tabularnewline
\hline
\end{tabular}
%Source: https://freestatistics.org/blog/index.php?pk=70762&T=2

[TABLE]
[ROW][C]Partial Autocorrelation Function[/C][/ROW]
[ROW][C]Time lag k[/C][C]PACF(k)[/C][C]T-STAT[/C][C]P-value[/C][/ROW]
[ROW][C]1[/C][C]0.877366[/C][C]6.0786[/C][C]0[/C][/ROW]
[ROW][C]2[/C][C]-0.460483[/C][C]-3.1903[/C][C]0.001253[/C][/ROW]
[ROW][C]3[/C][C]0.213033[/C][C]1.4759[/C][C]0.073246[/C][/ROW]
[ROW][C]4[/C][C]-0.061658[/C][C]-0.4272[/C][C]0.335578[/C][/ROW]
[ROW][C]5[/C][C]-0.106005[/C][C]-0.7344[/C][C]0.233132[/C][/ROW]
[ROW][C]6[/C][C]0.000286[/C][C]0.002[/C][C]0.499214[/C][/ROW]
[ROW][C]7[/C][C]-0.04811[/C][C]-0.3333[/C][C]0.370175[/C][/ROW]
[ROW][C]8[/C][C]0.064032[/C][C]0.4436[/C][C]0.329654[/C][/ROW]
[ROW][C]9[/C][C]-0.006286[/C][C]-0.0435[/C][C]0.482722[/C][/ROW]
[ROW][C]10[/C][C]-0.127989[/C][C]-0.8867[/C][C]0.189823[/C][/ROW]
[ROW][C]11[/C][C]-0.022506[/C][C]-0.1559[/C][C]0.438371[/C][/ROW]
[ROW][C]12[/C][C]0.023642[/C][C]0.1638[/C][C]0.435289[/C][/ROW]
[ROW][C]13[/C][C]0.107359[/C][C]0.7438[/C][C]0.230311[/C][/ROW]
[ROW][C]14[/C][C]0.013223[/C][C]0.0916[/C][C]0.463695[/C][/ROW]
[ROW][C]15[/C][C]-0.110975[/C][C]-0.7689[/C][C]0.222873[/C][/ROW]
[ROW][C]16[/C][C]-0.027758[/C][C]-0.1923[/C][C]0.424155[/C][/ROW]
[ROW][C]17[/C][C]-0.029571[/C][C]-0.2049[/C][C]0.419267[/C][/ROW]
[ROW][C]18[/C][C]-0.108719[/C][C]-0.7532[/C][C]0.227496[/C][/ROW]
[ROW][C]19[/C][C]-0.145671[/C][C]-1.0092[/C][C]0.158961[/C][/ROW]
[ROW][C]20[/C][C]0.107496[/C][C]0.7448[/C][C]0.230027[/C][/ROW]
[ROW][C]21[/C][C]-0.105648[/C][C]-0.7319[/C][C]0.233879[/C][/ROW]
[ROW][C]22[/C][C]-0.139132[/C][C]-0.9639[/C][C]0.169955[/C][/ROW]
[ROW][C]23[/C][C]-0.019816[/C][C]-0.1373[/C][C]0.445688[/C][/ROW]
[ROW][C]24[/C][C]-0.035523[/C][C]-0.2461[/C][C]0.403322[/C][/ROW]
[ROW][C]25[/C][C]0.048108[/C][C]0.3333[/C][C]0.370178[/C][/ROW]
[ROW][C]26[/C][C]-0.23106[/C][C]-1.6008[/C][C]0.057988[/C][/ROW]
[ROW][C]27[/C][C]-0.052829[/C][C]-0.366[/C][C]0.357982[/C][/ROW]
[ROW][C]28[/C][C]0.117464[/C][C]0.8138[/C][C]0.209885[/C][/ROW]
[ROW][C]29[/C][C]0.046245[/C][C]0.3204[/C][C]0.37503[/C][/ROW]
[ROW][C]30[/C][C]0.063607[/C][C]0.4407[/C][C]0.33071[/C][/ROW]
[ROW][C]31[/C][C]-0.015925[/C][C]-0.1103[/C][C]0.456302[/C][/ROW]
[ROW][C]32[/C][C]0.052901[/C][C]0.3665[/C][C]0.357797[/C][/ROW]
[ROW][C]33[/C][C]0.01904[/C][C]0.1319[/C][C]0.447801[/C][/ROW]
[ROW][C]34[/C][C]0.029616[/C][C]0.2052[/C][C]0.419147[/C][/ROW]
[ROW][C]35[/C][C]-0.117561[/C][C]-0.8145[/C][C]0.209694[/C][/ROW]
[ROW][C]36[/C][C]-0.02711[/C][C]-0.1878[/C][C]0.425904[/C][/ROW]
[/TABLE]
Source: https://freestatistics.org/blog/index.php?pk=70762&T=2

Globally Unique Identifier (entire table): ba.freestatistics.org/blog/index.php?pk=70762&T=2

As an alternative you can also use a QR Code:  

The GUIDs for individual cells are displayed in the table below:

Partial Autocorrelation Function
Time lag kPACF(k)T-STATP-value
10.8773666.07860
2-0.460483-3.19030.001253
30.2130331.47590.073246
4-0.061658-0.42720.335578
5-0.106005-0.73440.233132
60.0002860.0020.499214
7-0.04811-0.33330.370175
80.0640320.44360.329654
9-0.006286-0.04350.482722
10-0.127989-0.88670.189823
11-0.022506-0.15590.438371
120.0236420.16380.435289
130.1073590.74380.230311
140.0132230.09160.463695
15-0.110975-0.76890.222873
16-0.027758-0.19230.424155
17-0.029571-0.20490.419267
18-0.108719-0.75320.227496
19-0.145671-1.00920.158961
200.1074960.74480.230027
21-0.105648-0.73190.233879
22-0.139132-0.96390.169955
23-0.019816-0.13730.445688
24-0.035523-0.24610.403322
250.0481080.33330.370178
26-0.23106-1.60080.057988
27-0.052829-0.3660.357982
280.1174640.81380.209885
290.0462450.32040.37503
300.0636070.44070.33071
31-0.015925-0.11030.456302
320.0529010.36650.357797
330.019040.13190.447801
340.0296160.20520.419147
35-0.117561-0.81450.209694
36-0.02711-0.18780.425904


Parameters (Session):
par1 = 1 ;
Parameters (R input):
par1 = 36 ; par2 = 1 ; par3 = 0 ; par4 = 1 ; par5 = 12 ; par6 = White Noise ; par7 = 0.95 ;
R code (references can be found in the software module):
if (par1 == 'Default') {
par1 = 10*log10(length(x))
} else {
par1 <- as.numeric(par1)
}
par2 <- as.numeric(par2)
par3 <- as.numeric(par3)
par4 <- as.numeric(par4)
par5 <- as.numeric(par5)
if (par6 == 'White Noise') par6 <- 'white' else par6 <- 'ma'
par7 <- as.numeric(par7)
if (par2 == 0) {
x <- log(x)
} else {
x <- (x ^ par2 - 1) / par2
}
if (par3 > 0) x <- diff(x,lag=1,difference=par3)
if (par4 > 0) x <- diff(x,lag=par5,difference=par4)
bitmap(file='pic1.png')
racf <- acf(x, par1, main='Autocorrelation', xlab='time lag', ylab='ACF', ci.type=par6, ci=par7, sub=paste('(lambda=',par2,', d=',par3,', D=',par4,', CI=', par7, ', CI type=',par6,')',sep=''))
dev.off()
bitmap(file='pic2.png')
rpacf <- pacf(x,par1,main='Partial Autocorrelation',xlab='lags',ylab='PACF')
dev.off()
(myacf <- c(racf$acf))
(mypacf <- c(rpacf$acf))
lengthx <- length(x)
sqrtn <- sqrt(lengthx)
load(file='createtable')
a<-table.start()
a<-table.row.start(a)
a<-table.element(a,'Autocorrelation Function',4,TRUE)
a<-table.row.end(a)
a<-table.row.start(a)
a<-table.element(a,'Time lag k',header=TRUE)
a<-table.element(a,hyperlink('basics.htm','ACF(k)','click here for more information about the Autocorrelation Function'),header=TRUE)
a<-table.element(a,'T-STAT',header=TRUE)
a<-table.element(a,'P-value',header=TRUE)
a<-table.row.end(a)
for (i in 2:(par1+1)) {
a<-table.row.start(a)
a<-table.element(a,i-1,header=TRUE)
a<-table.element(a,round(myacf[i],6))
mytstat <- myacf[i]*sqrtn
a<-table.element(a,round(mytstat,4))
a<-table.element(a,round(1-pt(abs(mytstat),lengthx),6))
a<-table.row.end(a)
}
a<-table.end(a)
table.save(a,file='mytable.tab')
a<-table.start()
a<-table.row.start(a)
a<-table.element(a,'Partial Autocorrelation Function',4,TRUE)
a<-table.row.end(a)
a<-table.row.start(a)
a<-table.element(a,'Time lag k',header=TRUE)
a<-table.element(a,hyperlink('basics.htm','PACF(k)','click here for more information about the Partial Autocorrelation Function'),header=TRUE)
a<-table.element(a,'T-STAT',header=TRUE)
a<-table.element(a,'P-value',header=TRUE)
a<-table.row.end(a)
for (i in 1:par1) {
a<-table.row.start(a)
a<-table.element(a,i,header=TRUE)
a<-table.element(a,round(mypacf[i],6))
mytstat <- mypacf[i]*sqrtn
a<-table.element(a,round(mytstat,4))
a<-table.element(a,round(1-pt(abs(mytstat),lengthx),6))
a<-table.row.end(a)
}
a<-table.end(a)
table.save(a,file='mytable1.tab')