Free Statistics

of Irreproducible Research!

Author's title

Author*The author of this computation has been verified*
R Software Modulerwasp_autocorrelation.wasp
Title produced by software(Partial) Autocorrelation Function
Date of computationSat, 26 Dec 2009 09:56:09 -0700
Cite this page as followsStatistical Computations at FreeStatistics.org, Office for Research Development and Education, URL https://freestatistics.org/blog/index.php?v=date/2009/Dec/26/t126184664230nrzlzhavv5nto.htm/, Retrieved Mon, 29 Apr 2024 04:36:36 +0000
Statistical Computations at FreeStatistics.org, Office for Research Development and Education, URL https://freestatistics.org/blog/index.php?pk=70763, Retrieved Mon, 29 Apr 2024 04:36:36 +0000
QR Codes:

Original text written by user:
IsPrivate?No (this computation is public)
User-defined keywords
Estimated Impact158
Family? (F = Feedback message, R = changed R code, M = changed R Module, P = changed Parameters, D = changed Data)
-     [Univariate Data Series] [Paper] [2009-12-21 20:42:12] [0df1a6455bedfaf424729b1e006090d0]
- RMPD    [(Partial) Autocorrelation Function] [Paper] [2009-12-26 16:56:09] [e2f800c9186517d2e5c4a809848912a7] [Current]
Feedback Forum

Post a new message
Dataseries X:
1.2613
1.2646
1.2262
1.1985
1.2007
1.2138
1.2266
1.2176
1.2218
1.249
1.2991
1.3408
1.3119
1.3014
1.3201
1.2938
1.2694
1.2165
1.2037
1.2292
1.2256
1.2015
1.1786
1.1856
1.2103
1.1938
1.202
1.2271
1.277
1.265
1.2684
1.2811
1.2727
1.2611
1.2881
1.3213
1.2999
1.3074
1.3242
1.3516
1.3511
1.3419
1.3716
1.3622
1.3896
1.4227
1.4684
1.457
1.4718
1.4748
1.5527
1.5751
1.5557
1.5553
1.577
1.4975
1.437
1.3322
1.2732
1.3449


Summary of computational transaction
Raw Inputview raw input (R code)
Raw Outputview raw output of R engine
Computing time2 seconds
R Server'Gwilym Jenkins' @ 72.249.127.135

\begin{tabular}{lllllllll}
\hline
Summary of computational transaction \tabularnewline
Raw Input & view raw input (R code)  \tabularnewline
Raw Output & view raw output of R engine  \tabularnewline
Computing time & 2 seconds \tabularnewline
R Server & 'Gwilym Jenkins' @ 72.249.127.135 \tabularnewline
\hline
\end{tabular}
%Source: https://freestatistics.org/blog/index.php?pk=70763&T=0

[TABLE]
[ROW][C]Summary of computational transaction[/C][/ROW]
[ROW][C]Raw Input[/C][C]view raw input (R code) [/C][/ROW]
[ROW][C]Raw Output[/C][C]view raw output of R engine [/C][/ROW]
[ROW][C]Computing time[/C][C]2 seconds[/C][/ROW]
[ROW][C]R Server[/C][C]'Gwilym Jenkins' @ 72.249.127.135[/C][/ROW]
[/TABLE]
Source: https://freestatistics.org/blog/index.php?pk=70763&T=0

Globally Unique Identifier (entire table): ba.freestatistics.org/blog/index.php?pk=70763&T=0

As an alternative you can also use a QR Code:  

The GUIDs for individual cells are displayed in the table below:

Summary of computational transaction
Raw Inputview raw input (R code)
Raw Outputview raw output of R engine
Computing time2 seconds
R Server'Gwilym Jenkins' @ 72.249.127.135


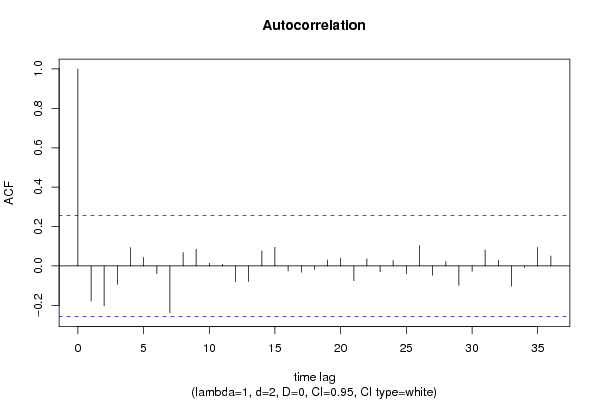
Autocorrelation Function
Time lag kACF(k)T-STATP-value
1-0.178508-1.35950.089629
2-0.20243-1.54170.064297
3-0.093665-0.71330.239251
40.0932810.71040.24015
50.0432580.32940.371505
6-0.039423-0.30020.382534
7-0.238154-1.81370.037447
80.0678650.51680.303615
90.0849770.64720.260039
100.0143070.1090.456804
110.008520.06490.474245
12-0.080649-0.61420.270741
13-0.078406-0.59710.276375
140.0765460.5830.281092
150.0944370.71920.237448
16-0.025391-0.19340.423672
17-0.03157-0.24040.405422
18-0.018585-0.14150.443968
190.0301970.230.40946
200.0397750.30290.381517
21-0.074608-0.56820.286048
220.0364420.27750.391179
23-0.029218-0.22250.412348
240.0273260.20810.417937
25-0.039865-0.30360.381259
260.1034340.78770.21703
27-0.047633-0.36280.359049
280.0227230.17310.431607
29-0.098207-0.74790.228765
30-0.027667-0.21070.416927
310.0807260.61480.270548
320.0294610.22440.411629
33-0.102567-0.78110.218953
34-0.008407-0.0640.474585
350.0939610.71560.238558
360.0505370.38490.350869

\begin{tabular}{lllllllll}
\hline
Autocorrelation Function \tabularnewline
Time lag k & ACF(k) & T-STAT & P-value \tabularnewline
1 & -0.178508 & -1.3595 & 0.089629 \tabularnewline
2 & -0.20243 & -1.5417 & 0.064297 \tabularnewline
3 & -0.093665 & -0.7133 & 0.239251 \tabularnewline
4 & 0.093281 & 0.7104 & 0.24015 \tabularnewline
5 & 0.043258 & 0.3294 & 0.371505 \tabularnewline
6 & -0.039423 & -0.3002 & 0.382534 \tabularnewline
7 & -0.238154 & -1.8137 & 0.037447 \tabularnewline
8 & 0.067865 & 0.5168 & 0.303615 \tabularnewline
9 & 0.084977 & 0.6472 & 0.260039 \tabularnewline
10 & 0.014307 & 0.109 & 0.456804 \tabularnewline
11 & 0.00852 & 0.0649 & 0.474245 \tabularnewline
12 & -0.080649 & -0.6142 & 0.270741 \tabularnewline
13 & -0.078406 & -0.5971 & 0.276375 \tabularnewline
14 & 0.076546 & 0.583 & 0.281092 \tabularnewline
15 & 0.094437 & 0.7192 & 0.237448 \tabularnewline
16 & -0.025391 & -0.1934 & 0.423672 \tabularnewline
17 & -0.03157 & -0.2404 & 0.405422 \tabularnewline
18 & -0.018585 & -0.1415 & 0.443968 \tabularnewline
19 & 0.030197 & 0.23 & 0.40946 \tabularnewline
20 & 0.039775 & 0.3029 & 0.381517 \tabularnewline
21 & -0.074608 & -0.5682 & 0.286048 \tabularnewline
22 & 0.036442 & 0.2775 & 0.391179 \tabularnewline
23 & -0.029218 & -0.2225 & 0.412348 \tabularnewline
24 & 0.027326 & 0.2081 & 0.417937 \tabularnewline
25 & -0.039865 & -0.3036 & 0.381259 \tabularnewline
26 & 0.103434 & 0.7877 & 0.21703 \tabularnewline
27 & -0.047633 & -0.3628 & 0.359049 \tabularnewline
28 & 0.022723 & 0.1731 & 0.431607 \tabularnewline
29 & -0.098207 & -0.7479 & 0.228765 \tabularnewline
30 & -0.027667 & -0.2107 & 0.416927 \tabularnewline
31 & 0.080726 & 0.6148 & 0.270548 \tabularnewline
32 & 0.029461 & 0.2244 & 0.411629 \tabularnewline
33 & -0.102567 & -0.7811 & 0.218953 \tabularnewline
34 & -0.008407 & -0.064 & 0.474585 \tabularnewline
35 & 0.093961 & 0.7156 & 0.238558 \tabularnewline
36 & 0.050537 & 0.3849 & 0.350869 \tabularnewline
\hline
\end{tabular}
%Source: https://freestatistics.org/blog/index.php?pk=70763&T=1

[TABLE]
[ROW][C]Autocorrelation Function[/C][/ROW]
[ROW][C]Time lag k[/C][C]ACF(k)[/C][C]T-STAT[/C][C]P-value[/C][/ROW]
[ROW][C]1[/C][C]-0.178508[/C][C]-1.3595[/C][C]0.089629[/C][/ROW]
[ROW][C]2[/C][C]-0.20243[/C][C]-1.5417[/C][C]0.064297[/C][/ROW]
[ROW][C]3[/C][C]-0.093665[/C][C]-0.7133[/C][C]0.239251[/C][/ROW]
[ROW][C]4[/C][C]0.093281[/C][C]0.7104[/C][C]0.24015[/C][/ROW]
[ROW][C]5[/C][C]0.043258[/C][C]0.3294[/C][C]0.371505[/C][/ROW]
[ROW][C]6[/C][C]-0.039423[/C][C]-0.3002[/C][C]0.382534[/C][/ROW]
[ROW][C]7[/C][C]-0.238154[/C][C]-1.8137[/C][C]0.037447[/C][/ROW]
[ROW][C]8[/C][C]0.067865[/C][C]0.5168[/C][C]0.303615[/C][/ROW]
[ROW][C]9[/C][C]0.084977[/C][C]0.6472[/C][C]0.260039[/C][/ROW]
[ROW][C]10[/C][C]0.014307[/C][C]0.109[/C][C]0.456804[/C][/ROW]
[ROW][C]11[/C][C]0.00852[/C][C]0.0649[/C][C]0.474245[/C][/ROW]
[ROW][C]12[/C][C]-0.080649[/C][C]-0.6142[/C][C]0.270741[/C][/ROW]
[ROW][C]13[/C][C]-0.078406[/C][C]-0.5971[/C][C]0.276375[/C][/ROW]
[ROW][C]14[/C][C]0.076546[/C][C]0.583[/C][C]0.281092[/C][/ROW]
[ROW][C]15[/C][C]0.094437[/C][C]0.7192[/C][C]0.237448[/C][/ROW]
[ROW][C]16[/C][C]-0.025391[/C][C]-0.1934[/C][C]0.423672[/C][/ROW]
[ROW][C]17[/C][C]-0.03157[/C][C]-0.2404[/C][C]0.405422[/C][/ROW]
[ROW][C]18[/C][C]-0.018585[/C][C]-0.1415[/C][C]0.443968[/C][/ROW]
[ROW][C]19[/C][C]0.030197[/C][C]0.23[/C][C]0.40946[/C][/ROW]
[ROW][C]20[/C][C]0.039775[/C][C]0.3029[/C][C]0.381517[/C][/ROW]
[ROW][C]21[/C][C]-0.074608[/C][C]-0.5682[/C][C]0.286048[/C][/ROW]
[ROW][C]22[/C][C]0.036442[/C][C]0.2775[/C][C]0.391179[/C][/ROW]
[ROW][C]23[/C][C]-0.029218[/C][C]-0.2225[/C][C]0.412348[/C][/ROW]
[ROW][C]24[/C][C]0.027326[/C][C]0.2081[/C][C]0.417937[/C][/ROW]
[ROW][C]25[/C][C]-0.039865[/C][C]-0.3036[/C][C]0.381259[/C][/ROW]
[ROW][C]26[/C][C]0.103434[/C][C]0.7877[/C][C]0.21703[/C][/ROW]
[ROW][C]27[/C][C]-0.047633[/C][C]-0.3628[/C][C]0.359049[/C][/ROW]
[ROW][C]28[/C][C]0.022723[/C][C]0.1731[/C][C]0.431607[/C][/ROW]
[ROW][C]29[/C][C]-0.098207[/C][C]-0.7479[/C][C]0.228765[/C][/ROW]
[ROW][C]30[/C][C]-0.027667[/C][C]-0.2107[/C][C]0.416927[/C][/ROW]
[ROW][C]31[/C][C]0.080726[/C][C]0.6148[/C][C]0.270548[/C][/ROW]
[ROW][C]32[/C][C]0.029461[/C][C]0.2244[/C][C]0.411629[/C][/ROW]
[ROW][C]33[/C][C]-0.102567[/C][C]-0.7811[/C][C]0.218953[/C][/ROW]
[ROW][C]34[/C][C]-0.008407[/C][C]-0.064[/C][C]0.474585[/C][/ROW]
[ROW][C]35[/C][C]0.093961[/C][C]0.7156[/C][C]0.238558[/C][/ROW]
[ROW][C]36[/C][C]0.050537[/C][C]0.3849[/C][C]0.350869[/C][/ROW]
[/TABLE]
Source: https://freestatistics.org/blog/index.php?pk=70763&T=1

Globally Unique Identifier (entire table): ba.freestatistics.org/blog/index.php?pk=70763&T=1

As an alternative you can also use a QR Code:  

The GUIDs for individual cells are displayed in the table below:

Autocorrelation Function
Time lag kACF(k)T-STATP-value
1-0.178508-1.35950.089629
2-0.20243-1.54170.064297
3-0.093665-0.71330.239251
40.0932810.71040.24015
50.0432580.32940.371505
6-0.039423-0.30020.382534
7-0.238154-1.81370.037447
80.0678650.51680.303615
90.0849770.64720.260039
100.0143070.1090.456804
110.008520.06490.474245
12-0.080649-0.61420.270741
13-0.078406-0.59710.276375
140.0765460.5830.281092
150.0944370.71920.237448
16-0.025391-0.19340.423672
17-0.03157-0.24040.405422
18-0.018585-0.14150.443968
190.0301970.230.40946
200.0397750.30290.381517
21-0.074608-0.56820.286048
220.0364420.27750.391179
23-0.029218-0.22250.412348
240.0273260.20810.417937
25-0.039865-0.30360.381259
260.1034340.78770.21703
27-0.047633-0.36280.359049
280.0227230.17310.431607
29-0.098207-0.74790.228765
30-0.027667-0.21070.416927
310.0807260.61480.270548
320.0294610.22440.411629
33-0.102567-0.78110.218953
34-0.008407-0.0640.474585
350.0939610.71560.238558
360.0505370.38490.350869


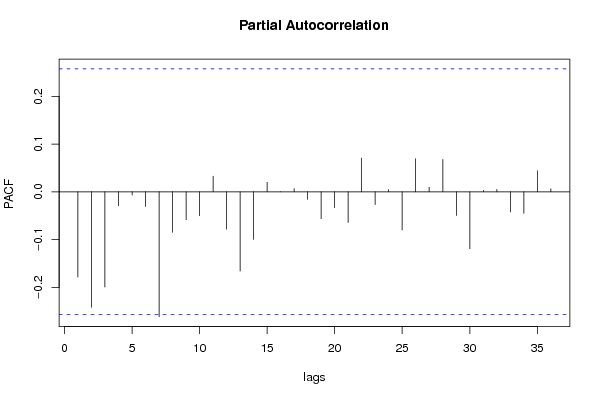
Partial Autocorrelation Function
Time lag kPACF(k)T-STATP-value
1-0.178508-1.35950.089629
2-0.242007-1.84310.035215
3-0.199406-1.51860.067144
4-0.029182-0.22220.412453
5-0.006607-0.05030.480021
6-0.030801-0.23460.407682
7-0.261447-1.99110.025592
8-0.084914-0.64670.260192
9-0.058444-0.44510.328955
10-0.050068-0.38130.352184
110.0327340.24930.402007
12-0.07827-0.59610.276718
13-0.165978-1.2640.105634
14-0.09969-0.75920.225398
150.0198150.15090.440287
160.0001199e-040.499639
170.00690.05250.479137
18-0.01581-0.12040.45229
19-0.056138-0.42750.335286
20-0.033096-0.25210.400946
21-0.064083-0.4880.313679
220.0706620.53810.296267
23-0.026722-0.20350.419724
240.004650.03540.485937
25-0.079765-0.60750.272955
260.0694510.52890.299438
270.0093410.07110.471767
280.0677860.51620.303823
29-0.049484-0.37690.353826
30-0.118992-0.90620.184285
310.0029850.02270.49097
320.0049060.03740.485163
33-0.042012-0.320.375077
34-0.045086-0.34340.366283
350.0439120.33440.369634
360.0063760.04860.480719

\begin{tabular}{lllllllll}
\hline
Partial Autocorrelation Function \tabularnewline
Time lag k & PACF(k) & T-STAT & P-value \tabularnewline
1 & -0.178508 & -1.3595 & 0.089629 \tabularnewline
2 & -0.242007 & -1.8431 & 0.035215 \tabularnewline
3 & -0.199406 & -1.5186 & 0.067144 \tabularnewline
4 & -0.029182 & -0.2222 & 0.412453 \tabularnewline
5 & -0.006607 & -0.0503 & 0.480021 \tabularnewline
6 & -0.030801 & -0.2346 & 0.407682 \tabularnewline
7 & -0.261447 & -1.9911 & 0.025592 \tabularnewline
8 & -0.084914 & -0.6467 & 0.260192 \tabularnewline
9 & -0.058444 & -0.4451 & 0.328955 \tabularnewline
10 & -0.050068 & -0.3813 & 0.352184 \tabularnewline
11 & 0.032734 & 0.2493 & 0.402007 \tabularnewline
12 & -0.07827 & -0.5961 & 0.276718 \tabularnewline
13 & -0.165978 & -1.264 & 0.105634 \tabularnewline
14 & -0.09969 & -0.7592 & 0.225398 \tabularnewline
15 & 0.019815 & 0.1509 & 0.440287 \tabularnewline
16 & 0.000119 & 9e-04 & 0.499639 \tabularnewline
17 & 0.0069 & 0.0525 & 0.479137 \tabularnewline
18 & -0.01581 & -0.1204 & 0.45229 \tabularnewline
19 & -0.056138 & -0.4275 & 0.335286 \tabularnewline
20 & -0.033096 & -0.2521 & 0.400946 \tabularnewline
21 & -0.064083 & -0.488 & 0.313679 \tabularnewline
22 & 0.070662 & 0.5381 & 0.296267 \tabularnewline
23 & -0.026722 & -0.2035 & 0.419724 \tabularnewline
24 & 0.00465 & 0.0354 & 0.485937 \tabularnewline
25 & -0.079765 & -0.6075 & 0.272955 \tabularnewline
26 & 0.069451 & 0.5289 & 0.299438 \tabularnewline
27 & 0.009341 & 0.0711 & 0.471767 \tabularnewline
28 & 0.067786 & 0.5162 & 0.303823 \tabularnewline
29 & -0.049484 & -0.3769 & 0.353826 \tabularnewline
30 & -0.118992 & -0.9062 & 0.184285 \tabularnewline
31 & 0.002985 & 0.0227 & 0.49097 \tabularnewline
32 & 0.004906 & 0.0374 & 0.485163 \tabularnewline
33 & -0.042012 & -0.32 & 0.375077 \tabularnewline
34 & -0.045086 & -0.3434 & 0.366283 \tabularnewline
35 & 0.043912 & 0.3344 & 0.369634 \tabularnewline
36 & 0.006376 & 0.0486 & 0.480719 \tabularnewline
\hline
\end{tabular}
%Source: https://freestatistics.org/blog/index.php?pk=70763&T=2

[TABLE]
[ROW][C]Partial Autocorrelation Function[/C][/ROW]
[ROW][C]Time lag k[/C][C]PACF(k)[/C][C]T-STAT[/C][C]P-value[/C][/ROW]
[ROW][C]1[/C][C]-0.178508[/C][C]-1.3595[/C][C]0.089629[/C][/ROW]
[ROW][C]2[/C][C]-0.242007[/C][C]-1.8431[/C][C]0.035215[/C][/ROW]
[ROW][C]3[/C][C]-0.199406[/C][C]-1.5186[/C][C]0.067144[/C][/ROW]
[ROW][C]4[/C][C]-0.029182[/C][C]-0.2222[/C][C]0.412453[/C][/ROW]
[ROW][C]5[/C][C]-0.006607[/C][C]-0.0503[/C][C]0.480021[/C][/ROW]
[ROW][C]6[/C][C]-0.030801[/C][C]-0.2346[/C][C]0.407682[/C][/ROW]
[ROW][C]7[/C][C]-0.261447[/C][C]-1.9911[/C][C]0.025592[/C][/ROW]
[ROW][C]8[/C][C]-0.084914[/C][C]-0.6467[/C][C]0.260192[/C][/ROW]
[ROW][C]9[/C][C]-0.058444[/C][C]-0.4451[/C][C]0.328955[/C][/ROW]
[ROW][C]10[/C][C]-0.050068[/C][C]-0.3813[/C][C]0.352184[/C][/ROW]
[ROW][C]11[/C][C]0.032734[/C][C]0.2493[/C][C]0.402007[/C][/ROW]
[ROW][C]12[/C][C]-0.07827[/C][C]-0.5961[/C][C]0.276718[/C][/ROW]
[ROW][C]13[/C][C]-0.165978[/C][C]-1.264[/C][C]0.105634[/C][/ROW]
[ROW][C]14[/C][C]-0.09969[/C][C]-0.7592[/C][C]0.225398[/C][/ROW]
[ROW][C]15[/C][C]0.019815[/C][C]0.1509[/C][C]0.440287[/C][/ROW]
[ROW][C]16[/C][C]0.000119[/C][C]9e-04[/C][C]0.499639[/C][/ROW]
[ROW][C]17[/C][C]0.0069[/C][C]0.0525[/C][C]0.479137[/C][/ROW]
[ROW][C]18[/C][C]-0.01581[/C][C]-0.1204[/C][C]0.45229[/C][/ROW]
[ROW][C]19[/C][C]-0.056138[/C][C]-0.4275[/C][C]0.335286[/C][/ROW]
[ROW][C]20[/C][C]-0.033096[/C][C]-0.2521[/C][C]0.400946[/C][/ROW]
[ROW][C]21[/C][C]-0.064083[/C][C]-0.488[/C][C]0.313679[/C][/ROW]
[ROW][C]22[/C][C]0.070662[/C][C]0.5381[/C][C]0.296267[/C][/ROW]
[ROW][C]23[/C][C]-0.026722[/C][C]-0.2035[/C][C]0.419724[/C][/ROW]
[ROW][C]24[/C][C]0.00465[/C][C]0.0354[/C][C]0.485937[/C][/ROW]
[ROW][C]25[/C][C]-0.079765[/C][C]-0.6075[/C][C]0.272955[/C][/ROW]
[ROW][C]26[/C][C]0.069451[/C][C]0.5289[/C][C]0.299438[/C][/ROW]
[ROW][C]27[/C][C]0.009341[/C][C]0.0711[/C][C]0.471767[/C][/ROW]
[ROW][C]28[/C][C]0.067786[/C][C]0.5162[/C][C]0.303823[/C][/ROW]
[ROW][C]29[/C][C]-0.049484[/C][C]-0.3769[/C][C]0.353826[/C][/ROW]
[ROW][C]30[/C][C]-0.118992[/C][C]-0.9062[/C][C]0.184285[/C][/ROW]
[ROW][C]31[/C][C]0.002985[/C][C]0.0227[/C][C]0.49097[/C][/ROW]
[ROW][C]32[/C][C]0.004906[/C][C]0.0374[/C][C]0.485163[/C][/ROW]
[ROW][C]33[/C][C]-0.042012[/C][C]-0.32[/C][C]0.375077[/C][/ROW]
[ROW][C]34[/C][C]-0.045086[/C][C]-0.3434[/C][C]0.366283[/C][/ROW]
[ROW][C]35[/C][C]0.043912[/C][C]0.3344[/C][C]0.369634[/C][/ROW]
[ROW][C]36[/C][C]0.006376[/C][C]0.0486[/C][C]0.480719[/C][/ROW]
[/TABLE]
Source: https://freestatistics.org/blog/index.php?pk=70763&T=2

Globally Unique Identifier (entire table): ba.freestatistics.org/blog/index.php?pk=70763&T=2

As an alternative you can also use a QR Code:  

The GUIDs for individual cells are displayed in the table below:

Partial Autocorrelation Function
Time lag kPACF(k)T-STATP-value
1-0.178508-1.35950.089629
2-0.242007-1.84310.035215
3-0.199406-1.51860.067144
4-0.029182-0.22220.412453
5-0.006607-0.05030.480021
6-0.030801-0.23460.407682
7-0.261447-1.99110.025592
8-0.084914-0.64670.260192
9-0.058444-0.44510.328955
10-0.050068-0.38130.352184
110.0327340.24930.402007
12-0.07827-0.59610.276718
13-0.165978-1.2640.105634
14-0.09969-0.75920.225398
150.0198150.15090.440287
160.0001199e-040.499639
170.00690.05250.479137
18-0.01581-0.12040.45229
19-0.056138-0.42750.335286
20-0.033096-0.25210.400946
21-0.064083-0.4880.313679
220.0706620.53810.296267
23-0.026722-0.20350.419724
240.004650.03540.485937
25-0.079765-0.60750.272955
260.0694510.52890.299438
270.0093410.07110.471767
280.0677860.51620.303823
29-0.049484-0.37690.353826
30-0.118992-0.90620.184285
310.0029850.02270.49097
320.0049060.03740.485163
33-0.042012-0.320.375077
34-0.045086-0.34340.366283
350.0439120.33440.369634
360.0063760.04860.480719


Parameters (Session):
par1 = 1 ;
Parameters (R input):
par1 = 36 ; par2 = 1 ; par3 = 2 ; par4 = 0 ; par5 = 12 ; par6 = White Noise ; par7 = 0.95 ;
R code (references can be found in the software module):
if (par1 == 'Default') {
par1 = 10*log10(length(x))
} else {
par1 <- as.numeric(par1)
}
par2 <- as.numeric(par2)
par3 <- as.numeric(par3)
par4 <- as.numeric(par4)
par5 <- as.numeric(par5)
if (par6 == 'White Noise') par6 <- 'white' else par6 <- 'ma'
par7 <- as.numeric(par7)
if (par2 == 0) {
x <- log(x)
} else {
x <- (x ^ par2 - 1) / par2
}
if (par3 > 0) x <- diff(x,lag=1,difference=par3)
if (par4 > 0) x <- diff(x,lag=par5,difference=par4)
bitmap(file='pic1.png')
racf <- acf(x, par1, main='Autocorrelation', xlab='time lag', ylab='ACF', ci.type=par6, ci=par7, sub=paste('(lambda=',par2,', d=',par3,', D=',par4,', CI=', par7, ', CI type=',par6,')',sep=''))
dev.off()
bitmap(file='pic2.png')
rpacf <- pacf(x,par1,main='Partial Autocorrelation',xlab='lags',ylab='PACF')
dev.off()
(myacf <- c(racf$acf))
(mypacf <- c(rpacf$acf))
lengthx <- length(x)
sqrtn <- sqrt(lengthx)
load(file='createtable')
a<-table.start()
a<-table.row.start(a)
a<-table.element(a,'Autocorrelation Function',4,TRUE)
a<-table.row.end(a)
a<-table.row.start(a)
a<-table.element(a,'Time lag k',header=TRUE)
a<-table.element(a,hyperlink('basics.htm','ACF(k)','click here for more information about the Autocorrelation Function'),header=TRUE)
a<-table.element(a,'T-STAT',header=TRUE)
a<-table.element(a,'P-value',header=TRUE)
a<-table.row.end(a)
for (i in 2:(par1+1)) {
a<-table.row.start(a)
a<-table.element(a,i-1,header=TRUE)
a<-table.element(a,round(myacf[i],6))
mytstat <- myacf[i]*sqrtn
a<-table.element(a,round(mytstat,4))
a<-table.element(a,round(1-pt(abs(mytstat),lengthx),6))
a<-table.row.end(a)
}
a<-table.end(a)
table.save(a,file='mytable.tab')
a<-table.start()
a<-table.row.start(a)
a<-table.element(a,'Partial Autocorrelation Function',4,TRUE)
a<-table.row.end(a)
a<-table.row.start(a)
a<-table.element(a,'Time lag k',header=TRUE)
a<-table.element(a,hyperlink('basics.htm','PACF(k)','click here for more information about the Partial Autocorrelation Function'),header=TRUE)
a<-table.element(a,'T-STAT',header=TRUE)
a<-table.element(a,'P-value',header=TRUE)
a<-table.row.end(a)
for (i in 1:par1) {
a<-table.row.start(a)
a<-table.element(a,i,header=TRUE)
a<-table.element(a,round(mypacf[i],6))
mytstat <- mypacf[i]*sqrtn
a<-table.element(a,round(mytstat,4))
a<-table.element(a,round(1-pt(abs(mytstat),lengthx),6))
a<-table.row.end(a)
}
a<-table.end(a)
table.save(a,file='mytable1.tab')