Free Statistics

of Irreproducible Research!

Author's title

Author*The author of this computation has been verified*
R Software Modulerwasp_autocorrelation.wasp
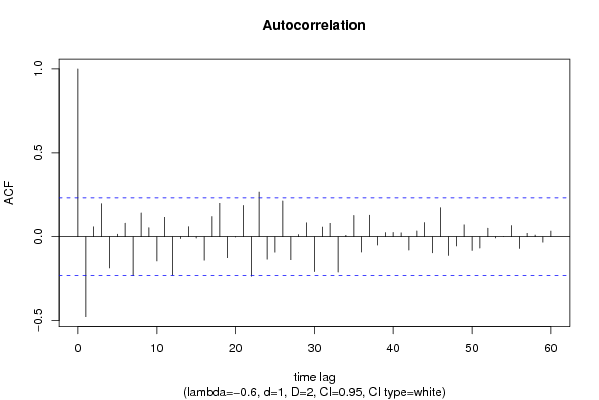
Title produced by software(Partial) Autocorrelation Function
Date of computationSun, 27 Dec 2009 05:09:35 -0700
Cite this page as followsStatistical Computations at FreeStatistics.org, Office for Research Development and Education, URL https://freestatistics.org/blog/index.php?v=date/2009/Dec/27/t1261915830mxqzpxn44eewml3.htm/, Retrieved Thu, 02 May 2024 13:57:48 +0000
Statistical Computations at FreeStatistics.org, Office for Research Development and Education, URL https://freestatistics.org/blog/index.php?pk=70860, Retrieved Thu, 02 May 2024 13:57:48 +0000
QR Codes:

Original text written by user:
IsPrivate?No (this computation is public)
User-defined keywords
Estimated Impact123
Family? (F = Feedback message, R = changed R code, M = changed R Module, P = changed Parameters, D = changed Data)
-     [(Partial) Autocorrelation Function] [Toon Nauwelaerts] [2009-12-27 12:06:14] [28075c6928548bea087cb2be962cfe7e]
-   P     [(Partial) Autocorrelation Function] [Toon Nauwelaerts] [2009-12-27 12:09:35] [b7e924d6f720297f82cd59f42434ec05] [Current]
Feedback Forum

Post a new message
Dataseries X:
13139.7
14532.2
15167
16071.1
14827.5
15082
14772.7
16083
14272.5
15223.3
14897.3
13062.6
12603.8
13629.8
14421.1
13978.3
12927.9
13429.9
13470.1
14785.8
14292
14308.8
14013
13240.9
12153.4
14289.7
15669.2
14169.5
14569.8
14469.1
14264.9
15320.9
14433.5
13691.5
14194.1
13519.2
11857.9
14616
15643.4
14077.2
14887.5
14159.9
14643
17192.5
15386.1
14287.1
17526.6
14497
14398.3
16629.6
16670.7
16614.8
16869.2
15663.9
16359.9
18447.7
16889
16505
18320.9
15052.1
15699.8
18135.3
16768.7
18883
19021
18101.9
17776.1
21489.9
17065.3
18690
18953.1
16398.9
16895.7
18553
19270
19422.1
17579.4
18637.3
18076.7
20438.6
18075.2
19563
19899.2
19227.5
17789.6
19220.8
21968.9
21131.5
19484.6
22404.1
21099
22486.5
23707.5
21897.5
23326.4
23765.4
20444


Summary of computational transaction
Raw Inputview raw input (R code)
Raw Outputview raw output of R engine
Computing time1 seconds
R Server'Gwilym Jenkins' @ 72.249.127.135

\begin{tabular}{lllllllll}
\hline
Summary of computational transaction \tabularnewline
Raw Input & view raw input (R code)  \tabularnewline
Raw Output & view raw output of R engine  \tabularnewline
Computing time & 1 seconds \tabularnewline
R Server & 'Gwilym Jenkins' @ 72.249.127.135 \tabularnewline
\hline
\end{tabular}
%Source: https://freestatistics.org/blog/index.php?pk=70860&T=0

[TABLE]
[ROW][C]Summary of computational transaction[/C][/ROW]
[ROW][C]Raw Input[/C][C]view raw input (R code) [/C][/ROW]
[ROW][C]Raw Output[/C][C]view raw output of R engine [/C][/ROW]
[ROW][C]Computing time[/C][C]1 seconds[/C][/ROW]
[ROW][C]R Server[/C][C]'Gwilym Jenkins' @ 72.249.127.135[/C][/ROW]
[/TABLE]
Source: https://freestatistics.org/blog/index.php?pk=70860&T=0

Globally Unique Identifier (entire table): ba.freestatistics.org/blog/index.php?pk=70860&T=0

As an alternative you can also use a QR Code:  

The GUIDs for individual cells are displayed in the table below:

Summary of computational transaction
Raw Inputview raw input (R code)
Raw Outputview raw output of R engine
Computing time1 seconds
R Server'Gwilym Jenkins' @ 72.249.127.135


Autocorrelation Function
Time lag kACF(k)T-STATP-value
1-0.477162-4.04896.4e-05
20.0589820.50050.309132
30.1961591.66450.050183
4-0.186687-1.58410.058778
50.014840.12590.450073
60.0801910.68040.249204
7-0.233129-1.97820.025869
80.1414161.20.117045
90.053640.45520.325185
10-0.145301-1.23290.110809
110.1149460.97530.166327
12-0.229627-1.94840.027629
13-0.011752-0.09970.460422
140.0590450.5010.308945
15-0.008597-0.0730.471024
16-0.140547-1.19260.118475
170.1199511.01780.156086
180.1987351.68630.048031
19-0.125392-1.0640.145445
20-0.002213-0.01880.492534
210.1862211.58010.05923
22-0.235585-1.9990.024692
230.2659552.25670.013531
24-0.134703-1.1430.128414
25-0.092782-0.78730.216851
260.2127471.80520.037611
27-0.137605-1.16760.123406
280.0121250.10290.459171
290.0821480.6970.24401
30-0.20797-1.76470.040929
310.0567340.48140.315845
320.079840.67750.25014
33-0.211532-1.79490.038433
340.0079280.06730.473277
350.1264251.07270.143483
36-0.091895-0.77980.219045
370.1279561.08570.140607
38-0.050441-0.4280.334962
390.0240480.20410.419444
400.0248810.21110.416694
410.0225380.19120.424437
42-0.079942-0.67830.249868
430.0340260.28870.386812
440.0837650.71080.239763
45-0.096547-0.81920.207679
460.1727411.46580.073535
47-0.112251-0.95250.17202
48-0.05585-0.47390.318502
490.0708840.60150.274707
50-0.08265-0.70130.242687
51-0.068165-0.57840.282399
520.0503860.42750.33513
53-0.007892-0.0670.473398
54-0.000171-0.00140.499425
550.0661890.56160.288056
56-0.070462-0.59790.275894
570.0201950.17140.432211
580.0094830.08050.468045
59-0.032817-0.27850.390729
600.0336310.28540.388092

\begin{tabular}{lllllllll}
\hline
Autocorrelation Function \tabularnewline
Time lag k & ACF(k) & T-STAT & P-value \tabularnewline
1 & -0.477162 & -4.0489 & 6.4e-05 \tabularnewline
2 & 0.058982 & 0.5005 & 0.309132 \tabularnewline
3 & 0.196159 & 1.6645 & 0.050183 \tabularnewline
4 & -0.186687 & -1.5841 & 0.058778 \tabularnewline
5 & 0.01484 & 0.1259 & 0.450073 \tabularnewline
6 & 0.080191 & 0.6804 & 0.249204 \tabularnewline
7 & -0.233129 & -1.9782 & 0.025869 \tabularnewline
8 & 0.141416 & 1.2 & 0.117045 \tabularnewline
9 & 0.05364 & 0.4552 & 0.325185 \tabularnewline
10 & -0.145301 & -1.2329 & 0.110809 \tabularnewline
11 & 0.114946 & 0.9753 & 0.166327 \tabularnewline
12 & -0.229627 & -1.9484 & 0.027629 \tabularnewline
13 & -0.011752 & -0.0997 & 0.460422 \tabularnewline
14 & 0.059045 & 0.501 & 0.308945 \tabularnewline
15 & -0.008597 & -0.073 & 0.471024 \tabularnewline
16 & -0.140547 & -1.1926 & 0.118475 \tabularnewline
17 & 0.119951 & 1.0178 & 0.156086 \tabularnewline
18 & 0.198735 & 1.6863 & 0.048031 \tabularnewline
19 & -0.125392 & -1.064 & 0.145445 \tabularnewline
20 & -0.002213 & -0.0188 & 0.492534 \tabularnewline
21 & 0.186221 & 1.5801 & 0.05923 \tabularnewline
22 & -0.235585 & -1.999 & 0.024692 \tabularnewline
23 & 0.265955 & 2.2567 & 0.013531 \tabularnewline
24 & -0.134703 & -1.143 & 0.128414 \tabularnewline
25 & -0.092782 & -0.7873 & 0.216851 \tabularnewline
26 & 0.212747 & 1.8052 & 0.037611 \tabularnewline
27 & -0.137605 & -1.1676 & 0.123406 \tabularnewline
28 & 0.012125 & 0.1029 & 0.459171 \tabularnewline
29 & 0.082148 & 0.697 & 0.24401 \tabularnewline
30 & -0.20797 & -1.7647 & 0.040929 \tabularnewline
31 & 0.056734 & 0.4814 & 0.315845 \tabularnewline
32 & 0.07984 & 0.6775 & 0.25014 \tabularnewline
33 & -0.211532 & -1.7949 & 0.038433 \tabularnewline
34 & 0.007928 & 0.0673 & 0.473277 \tabularnewline
35 & 0.126425 & 1.0727 & 0.143483 \tabularnewline
36 & -0.091895 & -0.7798 & 0.219045 \tabularnewline
37 & 0.127956 & 1.0857 & 0.140607 \tabularnewline
38 & -0.050441 & -0.428 & 0.334962 \tabularnewline
39 & 0.024048 & 0.2041 & 0.419444 \tabularnewline
40 & 0.024881 & 0.2111 & 0.416694 \tabularnewline
41 & 0.022538 & 0.1912 & 0.424437 \tabularnewline
42 & -0.079942 & -0.6783 & 0.249868 \tabularnewline
43 & 0.034026 & 0.2887 & 0.386812 \tabularnewline
44 & 0.083765 & 0.7108 & 0.239763 \tabularnewline
45 & -0.096547 & -0.8192 & 0.207679 \tabularnewline
46 & 0.172741 & 1.4658 & 0.073535 \tabularnewline
47 & -0.112251 & -0.9525 & 0.17202 \tabularnewline
48 & -0.05585 & -0.4739 & 0.318502 \tabularnewline
49 & 0.070884 & 0.6015 & 0.274707 \tabularnewline
50 & -0.08265 & -0.7013 & 0.242687 \tabularnewline
51 & -0.068165 & -0.5784 & 0.282399 \tabularnewline
52 & 0.050386 & 0.4275 & 0.33513 \tabularnewline
53 & -0.007892 & -0.067 & 0.473398 \tabularnewline
54 & -0.000171 & -0.0014 & 0.499425 \tabularnewline
55 & 0.066189 & 0.5616 & 0.288056 \tabularnewline
56 & -0.070462 & -0.5979 & 0.275894 \tabularnewline
57 & 0.020195 & 0.1714 & 0.432211 \tabularnewline
58 & 0.009483 & 0.0805 & 0.468045 \tabularnewline
59 & -0.032817 & -0.2785 & 0.390729 \tabularnewline
60 & 0.033631 & 0.2854 & 0.388092 \tabularnewline
\hline
\end{tabular}
%Source: https://freestatistics.org/blog/index.php?pk=70860&T=1

[TABLE]
[ROW][C]Autocorrelation Function[/C][/ROW]
[ROW][C]Time lag k[/C][C]ACF(k)[/C][C]T-STAT[/C][C]P-value[/C][/ROW]
[ROW][C]1[/C][C]-0.477162[/C][C]-4.0489[/C][C]6.4e-05[/C][/ROW]
[ROW][C]2[/C][C]0.058982[/C][C]0.5005[/C][C]0.309132[/C][/ROW]
[ROW][C]3[/C][C]0.196159[/C][C]1.6645[/C][C]0.050183[/C][/ROW]
[ROW][C]4[/C][C]-0.186687[/C][C]-1.5841[/C][C]0.058778[/C][/ROW]
[ROW][C]5[/C][C]0.01484[/C][C]0.1259[/C][C]0.450073[/C][/ROW]
[ROW][C]6[/C][C]0.080191[/C][C]0.6804[/C][C]0.249204[/C][/ROW]
[ROW][C]7[/C][C]-0.233129[/C][C]-1.9782[/C][C]0.025869[/C][/ROW]
[ROW][C]8[/C][C]0.141416[/C][C]1.2[/C][C]0.117045[/C][/ROW]
[ROW][C]9[/C][C]0.05364[/C][C]0.4552[/C][C]0.325185[/C][/ROW]
[ROW][C]10[/C][C]-0.145301[/C][C]-1.2329[/C][C]0.110809[/C][/ROW]
[ROW][C]11[/C][C]0.114946[/C][C]0.9753[/C][C]0.166327[/C][/ROW]
[ROW][C]12[/C][C]-0.229627[/C][C]-1.9484[/C][C]0.027629[/C][/ROW]
[ROW][C]13[/C][C]-0.011752[/C][C]-0.0997[/C][C]0.460422[/C][/ROW]
[ROW][C]14[/C][C]0.059045[/C][C]0.501[/C][C]0.308945[/C][/ROW]
[ROW][C]15[/C][C]-0.008597[/C][C]-0.073[/C][C]0.471024[/C][/ROW]
[ROW][C]16[/C][C]-0.140547[/C][C]-1.1926[/C][C]0.118475[/C][/ROW]
[ROW][C]17[/C][C]0.119951[/C][C]1.0178[/C][C]0.156086[/C][/ROW]
[ROW][C]18[/C][C]0.198735[/C][C]1.6863[/C][C]0.048031[/C][/ROW]
[ROW][C]19[/C][C]-0.125392[/C][C]-1.064[/C][C]0.145445[/C][/ROW]
[ROW][C]20[/C][C]-0.002213[/C][C]-0.0188[/C][C]0.492534[/C][/ROW]
[ROW][C]21[/C][C]0.186221[/C][C]1.5801[/C][C]0.05923[/C][/ROW]
[ROW][C]22[/C][C]-0.235585[/C][C]-1.999[/C][C]0.024692[/C][/ROW]
[ROW][C]23[/C][C]0.265955[/C][C]2.2567[/C][C]0.013531[/C][/ROW]
[ROW][C]24[/C][C]-0.134703[/C][C]-1.143[/C][C]0.128414[/C][/ROW]
[ROW][C]25[/C][C]-0.092782[/C][C]-0.7873[/C][C]0.216851[/C][/ROW]
[ROW][C]26[/C][C]0.212747[/C][C]1.8052[/C][C]0.037611[/C][/ROW]
[ROW][C]27[/C][C]-0.137605[/C][C]-1.1676[/C][C]0.123406[/C][/ROW]
[ROW][C]28[/C][C]0.012125[/C][C]0.1029[/C][C]0.459171[/C][/ROW]
[ROW][C]29[/C][C]0.082148[/C][C]0.697[/C][C]0.24401[/C][/ROW]
[ROW][C]30[/C][C]-0.20797[/C][C]-1.7647[/C][C]0.040929[/C][/ROW]
[ROW][C]31[/C][C]0.056734[/C][C]0.4814[/C][C]0.315845[/C][/ROW]
[ROW][C]32[/C][C]0.07984[/C][C]0.6775[/C][C]0.25014[/C][/ROW]
[ROW][C]33[/C][C]-0.211532[/C][C]-1.7949[/C][C]0.038433[/C][/ROW]
[ROW][C]34[/C][C]0.007928[/C][C]0.0673[/C][C]0.473277[/C][/ROW]
[ROW][C]35[/C][C]0.126425[/C][C]1.0727[/C][C]0.143483[/C][/ROW]
[ROW][C]36[/C][C]-0.091895[/C][C]-0.7798[/C][C]0.219045[/C][/ROW]
[ROW][C]37[/C][C]0.127956[/C][C]1.0857[/C][C]0.140607[/C][/ROW]
[ROW][C]38[/C][C]-0.050441[/C][C]-0.428[/C][C]0.334962[/C][/ROW]
[ROW][C]39[/C][C]0.024048[/C][C]0.2041[/C][C]0.419444[/C][/ROW]
[ROW][C]40[/C][C]0.024881[/C][C]0.2111[/C][C]0.416694[/C][/ROW]
[ROW][C]41[/C][C]0.022538[/C][C]0.1912[/C][C]0.424437[/C][/ROW]
[ROW][C]42[/C][C]-0.079942[/C][C]-0.6783[/C][C]0.249868[/C][/ROW]
[ROW][C]43[/C][C]0.034026[/C][C]0.2887[/C][C]0.386812[/C][/ROW]
[ROW][C]44[/C][C]0.083765[/C][C]0.7108[/C][C]0.239763[/C][/ROW]
[ROW][C]45[/C][C]-0.096547[/C][C]-0.8192[/C][C]0.207679[/C][/ROW]
[ROW][C]46[/C][C]0.172741[/C][C]1.4658[/C][C]0.073535[/C][/ROW]
[ROW][C]47[/C][C]-0.112251[/C][C]-0.9525[/C][C]0.17202[/C][/ROW]
[ROW][C]48[/C][C]-0.05585[/C][C]-0.4739[/C][C]0.318502[/C][/ROW]
[ROW][C]49[/C][C]0.070884[/C][C]0.6015[/C][C]0.274707[/C][/ROW]
[ROW][C]50[/C][C]-0.08265[/C][C]-0.7013[/C][C]0.242687[/C][/ROW]
[ROW][C]51[/C][C]-0.068165[/C][C]-0.5784[/C][C]0.282399[/C][/ROW]
[ROW][C]52[/C][C]0.050386[/C][C]0.4275[/C][C]0.33513[/C][/ROW]
[ROW][C]53[/C][C]-0.007892[/C][C]-0.067[/C][C]0.473398[/C][/ROW]
[ROW][C]54[/C][C]-0.000171[/C][C]-0.0014[/C][C]0.499425[/C][/ROW]
[ROW][C]55[/C][C]0.066189[/C][C]0.5616[/C][C]0.288056[/C][/ROW]
[ROW][C]56[/C][C]-0.070462[/C][C]-0.5979[/C][C]0.275894[/C][/ROW]
[ROW][C]57[/C][C]0.020195[/C][C]0.1714[/C][C]0.432211[/C][/ROW]
[ROW][C]58[/C][C]0.009483[/C][C]0.0805[/C][C]0.468045[/C][/ROW]
[ROW][C]59[/C][C]-0.032817[/C][C]-0.2785[/C][C]0.390729[/C][/ROW]
[ROW][C]60[/C][C]0.033631[/C][C]0.2854[/C][C]0.388092[/C][/ROW]
[/TABLE]
Source: https://freestatistics.org/blog/index.php?pk=70860&T=1

Globally Unique Identifier (entire table): ba.freestatistics.org/blog/index.php?pk=70860&T=1

As an alternative you can also use a QR Code:  

The GUIDs for individual cells are displayed in the table below:

Autocorrelation Function
Time lag kACF(k)T-STATP-value
1-0.477162-4.04896.4e-05
20.0589820.50050.309132
30.1961591.66450.050183
4-0.186687-1.58410.058778
50.014840.12590.450073
60.0801910.68040.249204
7-0.233129-1.97820.025869
80.1414161.20.117045
90.053640.45520.325185
10-0.145301-1.23290.110809
110.1149460.97530.166327
12-0.229627-1.94840.027629
13-0.011752-0.09970.460422
140.0590450.5010.308945
15-0.008597-0.0730.471024
16-0.140547-1.19260.118475
170.1199511.01780.156086
180.1987351.68630.048031
19-0.125392-1.0640.145445
20-0.002213-0.01880.492534
210.1862211.58010.05923
22-0.235585-1.9990.024692
230.2659552.25670.013531
24-0.134703-1.1430.128414
25-0.092782-0.78730.216851
260.2127471.80520.037611
27-0.137605-1.16760.123406
280.0121250.10290.459171
290.0821480.6970.24401
30-0.20797-1.76470.040929
310.0567340.48140.315845
320.079840.67750.25014
33-0.211532-1.79490.038433
340.0079280.06730.473277
350.1264251.07270.143483
36-0.091895-0.77980.219045
370.1279561.08570.140607
38-0.050441-0.4280.334962
390.0240480.20410.419444
400.0248810.21110.416694
410.0225380.19120.424437
42-0.079942-0.67830.249868
430.0340260.28870.386812
440.0837650.71080.239763
45-0.096547-0.81920.207679
460.1727411.46580.073535
47-0.112251-0.95250.17202
48-0.05585-0.47390.318502
490.0708840.60150.274707
50-0.08265-0.70130.242687
51-0.068165-0.57840.282399
520.0503860.42750.33513
53-0.007892-0.0670.473398
54-0.000171-0.00140.499425
550.0661890.56160.288056
56-0.070462-0.59790.275894
570.0201950.17140.432211
580.0094830.08050.468045
59-0.032817-0.27850.390729
600.0336310.28540.388092


Partial Autocorrelation Function
Time lag kPACF(k)T-STATP-value
1-0.477162-4.04896.4e-05
2-0.218436-1.85350.033954
30.1716211.45630.074835
40.0124610.10570.458043
5-0.096245-0.81670.208406
6-0.009527-0.08080.467897
7-0.20776-1.76290.04108
8-0.07085-0.60120.274804
90.1138040.96570.168724
100.0168930.14330.443212
11-0.020437-0.17340.431406
12-0.353017-2.99540.001878
13-0.367129-3.11520.00132
14-0.221028-1.87550.032391
150.1512761.28360.101695
16-0.017767-0.15080.440294
17-0.245004-2.07890.020594
180.1346131.14220.128572
190.1500271.2730.103553
20-0.121631-1.03210.152747
210.1545491.31140.096947
22-0.009572-0.08120.467747
230.1560651.32430.094804
24-0.115742-0.98210.164669
25-0.23182-1.96710.026515
260.0007480.00640.497475
270.0115740.09820.46102
280.0184170.15630.438126
29-0.029211-0.24790.402474
300.0909640.77190.221364
310.0430510.36530.35798
32-0.171332-1.45380.075173
33-0.006008-0.0510.479742
34-0.106187-0.9010.185289
350.1107430.93970.17526
36-0.091917-0.77990.21899
370.0073980.06280.475061
380.0709620.60210.274488
39-0.020276-0.1720.431942
40-0.083396-0.70760.240727
41-0.107654-0.91350.18202
420.0421950.3580.360681
430.0591160.50160.308734
44-0.082801-0.70260.242288
45-0.04961-0.4210.337521
460.0149940.12720.449556
470.0138740.11770.453306
48-0.073771-0.6260.266659
49-0.075397-0.63980.262179
500.0123650.10490.458365
510.0583430.49510.311034
52-0.063901-0.54220.29467
53-0.032723-0.27770.391034
54-0.022312-0.18930.425186
550.0049860.04230.483186
56-0.076598-0.650.258893
570.0014230.01210.495201
58-0.061386-0.52090.302025
59-0.009422-0.07990.468251
60-0.026665-0.22630.41082

\begin{tabular}{lllllllll}
\hline
Partial Autocorrelation Function \tabularnewline
Time lag k & PACF(k) & T-STAT & P-value \tabularnewline
1 & -0.477162 & -4.0489 & 6.4e-05 \tabularnewline
2 & -0.218436 & -1.8535 & 0.033954 \tabularnewline
3 & 0.171621 & 1.4563 & 0.074835 \tabularnewline
4 & 0.012461 & 0.1057 & 0.458043 \tabularnewline
5 & -0.096245 & -0.8167 & 0.208406 \tabularnewline
6 & -0.009527 & -0.0808 & 0.467897 \tabularnewline
7 & -0.20776 & -1.7629 & 0.04108 \tabularnewline
8 & -0.07085 & -0.6012 & 0.274804 \tabularnewline
9 & 0.113804 & 0.9657 & 0.168724 \tabularnewline
10 & 0.016893 & 0.1433 & 0.443212 \tabularnewline
11 & -0.020437 & -0.1734 & 0.431406 \tabularnewline
12 & -0.353017 & -2.9954 & 0.001878 \tabularnewline
13 & -0.367129 & -3.1152 & 0.00132 \tabularnewline
14 & -0.221028 & -1.8755 & 0.032391 \tabularnewline
15 & 0.151276 & 1.2836 & 0.101695 \tabularnewline
16 & -0.017767 & -0.1508 & 0.440294 \tabularnewline
17 & -0.245004 & -2.0789 & 0.020594 \tabularnewline
18 & 0.134613 & 1.1422 & 0.128572 \tabularnewline
19 & 0.150027 & 1.273 & 0.103553 \tabularnewline
20 & -0.121631 & -1.0321 & 0.152747 \tabularnewline
21 & 0.154549 & 1.3114 & 0.096947 \tabularnewline
22 & -0.009572 & -0.0812 & 0.467747 \tabularnewline
23 & 0.156065 & 1.3243 & 0.094804 \tabularnewline
24 & -0.115742 & -0.9821 & 0.164669 \tabularnewline
25 & -0.23182 & -1.9671 & 0.026515 \tabularnewline
26 & 0.000748 & 0.0064 & 0.497475 \tabularnewline
27 & 0.011574 & 0.0982 & 0.46102 \tabularnewline
28 & 0.018417 & 0.1563 & 0.438126 \tabularnewline
29 & -0.029211 & -0.2479 & 0.402474 \tabularnewline
30 & 0.090964 & 0.7719 & 0.221364 \tabularnewline
31 & 0.043051 & 0.3653 & 0.35798 \tabularnewline
32 & -0.171332 & -1.4538 & 0.075173 \tabularnewline
33 & -0.006008 & -0.051 & 0.479742 \tabularnewline
34 & -0.106187 & -0.901 & 0.185289 \tabularnewline
35 & 0.110743 & 0.9397 & 0.17526 \tabularnewline
36 & -0.091917 & -0.7799 & 0.21899 \tabularnewline
37 & 0.007398 & 0.0628 & 0.475061 \tabularnewline
38 & 0.070962 & 0.6021 & 0.274488 \tabularnewline
39 & -0.020276 & -0.172 & 0.431942 \tabularnewline
40 & -0.083396 & -0.7076 & 0.240727 \tabularnewline
41 & -0.107654 & -0.9135 & 0.18202 \tabularnewline
42 & 0.042195 & 0.358 & 0.360681 \tabularnewline
43 & 0.059116 & 0.5016 & 0.308734 \tabularnewline
44 & -0.082801 & -0.7026 & 0.242288 \tabularnewline
45 & -0.04961 & -0.421 & 0.337521 \tabularnewline
46 & 0.014994 & 0.1272 & 0.449556 \tabularnewline
47 & 0.013874 & 0.1177 & 0.453306 \tabularnewline
48 & -0.073771 & -0.626 & 0.266659 \tabularnewline
49 & -0.075397 & -0.6398 & 0.262179 \tabularnewline
50 & 0.012365 & 0.1049 & 0.458365 \tabularnewline
51 & 0.058343 & 0.4951 & 0.311034 \tabularnewline
52 & -0.063901 & -0.5422 & 0.29467 \tabularnewline
53 & -0.032723 & -0.2777 & 0.391034 \tabularnewline
54 & -0.022312 & -0.1893 & 0.425186 \tabularnewline
55 & 0.004986 & 0.0423 & 0.483186 \tabularnewline
56 & -0.076598 & -0.65 & 0.258893 \tabularnewline
57 & 0.001423 & 0.0121 & 0.495201 \tabularnewline
58 & -0.061386 & -0.5209 & 0.302025 \tabularnewline
59 & -0.009422 & -0.0799 & 0.468251 \tabularnewline
60 & -0.026665 & -0.2263 & 0.41082 \tabularnewline
\hline
\end{tabular}
%Source: https://freestatistics.org/blog/index.php?pk=70860&T=2

[TABLE]
[ROW][C]Partial Autocorrelation Function[/C][/ROW]
[ROW][C]Time lag k[/C][C]PACF(k)[/C][C]T-STAT[/C][C]P-value[/C][/ROW]
[ROW][C]1[/C][C]-0.477162[/C][C]-4.0489[/C][C]6.4e-05[/C][/ROW]
[ROW][C]2[/C][C]-0.218436[/C][C]-1.8535[/C][C]0.033954[/C][/ROW]
[ROW][C]3[/C][C]0.171621[/C][C]1.4563[/C][C]0.074835[/C][/ROW]
[ROW][C]4[/C][C]0.012461[/C][C]0.1057[/C][C]0.458043[/C][/ROW]
[ROW][C]5[/C][C]-0.096245[/C][C]-0.8167[/C][C]0.208406[/C][/ROW]
[ROW][C]6[/C][C]-0.009527[/C][C]-0.0808[/C][C]0.467897[/C][/ROW]
[ROW][C]7[/C][C]-0.20776[/C][C]-1.7629[/C][C]0.04108[/C][/ROW]
[ROW][C]8[/C][C]-0.07085[/C][C]-0.6012[/C][C]0.274804[/C][/ROW]
[ROW][C]9[/C][C]0.113804[/C][C]0.9657[/C][C]0.168724[/C][/ROW]
[ROW][C]10[/C][C]0.016893[/C][C]0.1433[/C][C]0.443212[/C][/ROW]
[ROW][C]11[/C][C]-0.020437[/C][C]-0.1734[/C][C]0.431406[/C][/ROW]
[ROW][C]12[/C][C]-0.353017[/C][C]-2.9954[/C][C]0.001878[/C][/ROW]
[ROW][C]13[/C][C]-0.367129[/C][C]-3.1152[/C][C]0.00132[/C][/ROW]
[ROW][C]14[/C][C]-0.221028[/C][C]-1.8755[/C][C]0.032391[/C][/ROW]
[ROW][C]15[/C][C]0.151276[/C][C]1.2836[/C][C]0.101695[/C][/ROW]
[ROW][C]16[/C][C]-0.017767[/C][C]-0.1508[/C][C]0.440294[/C][/ROW]
[ROW][C]17[/C][C]-0.245004[/C][C]-2.0789[/C][C]0.020594[/C][/ROW]
[ROW][C]18[/C][C]0.134613[/C][C]1.1422[/C][C]0.128572[/C][/ROW]
[ROW][C]19[/C][C]0.150027[/C][C]1.273[/C][C]0.103553[/C][/ROW]
[ROW][C]20[/C][C]-0.121631[/C][C]-1.0321[/C][C]0.152747[/C][/ROW]
[ROW][C]21[/C][C]0.154549[/C][C]1.3114[/C][C]0.096947[/C][/ROW]
[ROW][C]22[/C][C]-0.009572[/C][C]-0.0812[/C][C]0.467747[/C][/ROW]
[ROW][C]23[/C][C]0.156065[/C][C]1.3243[/C][C]0.094804[/C][/ROW]
[ROW][C]24[/C][C]-0.115742[/C][C]-0.9821[/C][C]0.164669[/C][/ROW]
[ROW][C]25[/C][C]-0.23182[/C][C]-1.9671[/C][C]0.026515[/C][/ROW]
[ROW][C]26[/C][C]0.000748[/C][C]0.0064[/C][C]0.497475[/C][/ROW]
[ROW][C]27[/C][C]0.011574[/C][C]0.0982[/C][C]0.46102[/C][/ROW]
[ROW][C]28[/C][C]0.018417[/C][C]0.1563[/C][C]0.438126[/C][/ROW]
[ROW][C]29[/C][C]-0.029211[/C][C]-0.2479[/C][C]0.402474[/C][/ROW]
[ROW][C]30[/C][C]0.090964[/C][C]0.7719[/C][C]0.221364[/C][/ROW]
[ROW][C]31[/C][C]0.043051[/C][C]0.3653[/C][C]0.35798[/C][/ROW]
[ROW][C]32[/C][C]-0.171332[/C][C]-1.4538[/C][C]0.075173[/C][/ROW]
[ROW][C]33[/C][C]-0.006008[/C][C]-0.051[/C][C]0.479742[/C][/ROW]
[ROW][C]34[/C][C]-0.106187[/C][C]-0.901[/C][C]0.185289[/C][/ROW]
[ROW][C]35[/C][C]0.110743[/C][C]0.9397[/C][C]0.17526[/C][/ROW]
[ROW][C]36[/C][C]-0.091917[/C][C]-0.7799[/C][C]0.21899[/C][/ROW]
[ROW][C]37[/C][C]0.007398[/C][C]0.0628[/C][C]0.475061[/C][/ROW]
[ROW][C]38[/C][C]0.070962[/C][C]0.6021[/C][C]0.274488[/C][/ROW]
[ROW][C]39[/C][C]-0.020276[/C][C]-0.172[/C][C]0.431942[/C][/ROW]
[ROW][C]40[/C][C]-0.083396[/C][C]-0.7076[/C][C]0.240727[/C][/ROW]
[ROW][C]41[/C][C]-0.107654[/C][C]-0.9135[/C][C]0.18202[/C][/ROW]
[ROW][C]42[/C][C]0.042195[/C][C]0.358[/C][C]0.360681[/C][/ROW]
[ROW][C]43[/C][C]0.059116[/C][C]0.5016[/C][C]0.308734[/C][/ROW]
[ROW][C]44[/C][C]-0.082801[/C][C]-0.7026[/C][C]0.242288[/C][/ROW]
[ROW][C]45[/C][C]-0.04961[/C][C]-0.421[/C][C]0.337521[/C][/ROW]
[ROW][C]46[/C][C]0.014994[/C][C]0.1272[/C][C]0.449556[/C][/ROW]
[ROW][C]47[/C][C]0.013874[/C][C]0.1177[/C][C]0.453306[/C][/ROW]
[ROW][C]48[/C][C]-0.073771[/C][C]-0.626[/C][C]0.266659[/C][/ROW]
[ROW][C]49[/C][C]-0.075397[/C][C]-0.6398[/C][C]0.262179[/C][/ROW]
[ROW][C]50[/C][C]0.012365[/C][C]0.1049[/C][C]0.458365[/C][/ROW]
[ROW][C]51[/C][C]0.058343[/C][C]0.4951[/C][C]0.311034[/C][/ROW]
[ROW][C]52[/C][C]-0.063901[/C][C]-0.5422[/C][C]0.29467[/C][/ROW]
[ROW][C]53[/C][C]-0.032723[/C][C]-0.2777[/C][C]0.391034[/C][/ROW]
[ROW][C]54[/C][C]-0.022312[/C][C]-0.1893[/C][C]0.425186[/C][/ROW]
[ROW][C]55[/C][C]0.004986[/C][C]0.0423[/C][C]0.483186[/C][/ROW]
[ROW][C]56[/C][C]-0.076598[/C][C]-0.65[/C][C]0.258893[/C][/ROW]
[ROW][C]57[/C][C]0.001423[/C][C]0.0121[/C][C]0.495201[/C][/ROW]
[ROW][C]58[/C][C]-0.061386[/C][C]-0.5209[/C][C]0.302025[/C][/ROW]
[ROW][C]59[/C][C]-0.009422[/C][C]-0.0799[/C][C]0.468251[/C][/ROW]
[ROW][C]60[/C][C]-0.026665[/C][C]-0.2263[/C][C]0.41082[/C][/ROW]
[/TABLE]
Source: https://freestatistics.org/blog/index.php?pk=70860&T=2

Globally Unique Identifier (entire table): ba.freestatistics.org/blog/index.php?pk=70860&T=2

As an alternative you can also use a QR Code:  

The GUIDs for individual cells are displayed in the table below:

Partial Autocorrelation Function
Time lag kPACF(k)T-STATP-value
1-0.477162-4.04896.4e-05
2-0.218436-1.85350.033954
30.1716211.45630.074835
40.0124610.10570.458043
5-0.096245-0.81670.208406
6-0.009527-0.08080.467897
7-0.20776-1.76290.04108
8-0.07085-0.60120.274804
90.1138040.96570.168724
100.0168930.14330.443212
11-0.020437-0.17340.431406
12-0.353017-2.99540.001878
13-0.367129-3.11520.00132
14-0.221028-1.87550.032391
150.1512761.28360.101695
16-0.017767-0.15080.440294
17-0.245004-2.07890.020594
180.1346131.14220.128572
190.1500271.2730.103553
20-0.121631-1.03210.152747
210.1545491.31140.096947
22-0.009572-0.08120.467747
230.1560651.32430.094804
24-0.115742-0.98210.164669
25-0.23182-1.96710.026515
260.0007480.00640.497475
270.0115740.09820.46102
280.0184170.15630.438126
29-0.029211-0.24790.402474
300.0909640.77190.221364
310.0430510.36530.35798
32-0.171332-1.45380.075173
33-0.006008-0.0510.479742
34-0.106187-0.9010.185289
350.1107430.93970.17526
36-0.091917-0.77990.21899
370.0073980.06280.475061
380.0709620.60210.274488
39-0.020276-0.1720.431942
40-0.083396-0.70760.240727
41-0.107654-0.91350.18202
420.0421950.3580.360681
430.0591160.50160.308734
44-0.082801-0.70260.242288
45-0.04961-0.4210.337521
460.0149940.12720.449556
470.0138740.11770.453306
48-0.073771-0.6260.266659
49-0.075397-0.63980.262179
500.0123650.10490.458365
510.0583430.49510.311034
52-0.063901-0.54220.29467
53-0.032723-0.27770.391034
54-0.022312-0.18930.425186
550.0049860.04230.483186
56-0.076598-0.650.258893
570.0014230.01210.495201
58-0.061386-0.52090.302025
59-0.009422-0.07990.468251
60-0.026665-0.22630.41082


Parameters (Session):
par1 = 60 ; par2 = -0.6 ; par3 = 1 ; par4 = 2 ; par5 = 12 ; par6 = White Noise ; par7 = 0.95 ;
Parameters (R input):
par1 = 60 ; par2 = -0.6 ; par3 = 1 ; par4 = 2 ; par5 = 12 ; par6 = White Noise ; par7 = 0.95 ;
R code (references can be found in the software module):
if (par1 == 'Default') {
par1 = 10*log10(length(x))
} else {
par1 <- as.numeric(par1)
}
par2 <- as.numeric(par2)
par3 <- as.numeric(par3)
par4 <- as.numeric(par4)
par5 <- as.numeric(par5)
if (par6 == 'White Noise') par6 <- 'white' else par6 <- 'ma'
par7 <- as.numeric(par7)
if (par2 == 0) {
x <- log(x)
} else {
x <- (x ^ par2 - 1) / par2
}
if (par3 > 0) x <- diff(x,lag=1,difference=par3)
if (par4 > 0) x <- diff(x,lag=par5,difference=par4)
bitmap(file='pic1.png')
racf <- acf(x, par1, main='Autocorrelation', xlab='time lag', ylab='ACF', ci.type=par6, ci=par7, sub=paste('(lambda=',par2,', d=',par3,', D=',par4,', CI=', par7, ', CI type=',par6,')',sep=''))
dev.off()
bitmap(file='pic2.png')
rpacf <- pacf(x,par1,main='Partial Autocorrelation',xlab='lags',ylab='PACF')
dev.off()
(myacf <- c(racf$acf))
(mypacf <- c(rpacf$acf))
lengthx <- length(x)
sqrtn <- sqrt(lengthx)
load(file='createtable')
a<-table.start()
a<-table.row.start(a)
a<-table.element(a,'Autocorrelation Function',4,TRUE)
a<-table.row.end(a)
a<-table.row.start(a)
a<-table.element(a,'Time lag k',header=TRUE)
a<-table.element(a,hyperlink('basics.htm','ACF(k)','click here for more information about the Autocorrelation Function'),header=TRUE)
a<-table.element(a,'T-STAT',header=TRUE)
a<-table.element(a,'P-value',header=TRUE)
a<-table.row.end(a)
for (i in 2:(par1+1)) {
a<-table.row.start(a)
a<-table.element(a,i-1,header=TRUE)
a<-table.element(a,round(myacf[i],6))
mytstat <- myacf[i]*sqrtn
a<-table.element(a,round(mytstat,4))
a<-table.element(a,round(1-pt(abs(mytstat),lengthx),6))
a<-table.row.end(a)
}
a<-table.end(a)
table.save(a,file='mytable.tab')
a<-table.start()
a<-table.row.start(a)
a<-table.element(a,'Partial Autocorrelation Function',4,TRUE)
a<-table.row.end(a)
a<-table.row.start(a)
a<-table.element(a,'Time lag k',header=TRUE)
a<-table.element(a,hyperlink('basics.htm','PACF(k)','click here for more information about the Partial Autocorrelation Function'),header=TRUE)
a<-table.element(a,'T-STAT',header=TRUE)
a<-table.element(a,'P-value',header=TRUE)
a<-table.row.end(a)
for (i in 1:par1) {
a<-table.row.start(a)
a<-table.element(a,i,header=TRUE)
a<-table.element(a,round(mypacf[i],6))
mytstat <- mypacf[i]*sqrtn
a<-table.element(a,round(mytstat,4))
a<-table.element(a,round(1-pt(abs(mytstat),lengthx),6))
a<-table.row.end(a)
}
a<-table.end(a)
table.save(a,file='mytable1.tab')