Free Statistics
of Irreproducible Research!
Description of Statistical Computation | |
|---|---|
| Author's title | |
| Author | *Unverified author* |
| R Software Module | Rscript (source code is shown below) |
| Title produced by software | R console |
| Date of computation | Thu, 02 Jul 2009 10:32:12 -0600 |
| Cite this page as follows | Statistical Computations at FreeStatistics.org, Office for Research Development and Education, URL https://freestatistics.org/blog/index.php?v=date/2009/Jul/02/t1246552334wj7aky6qwy9wfzx.htm/, Retrieved Sun, 19 May 2024 13:45:06 +0000 |
| Statistical Computations at FreeStatistics.org, Office for Research Development and Education, URL https://freestatistics.org/blog/index.php?pk=42307, Retrieved Sun, 19 May 2024 13:45:06 +0000 | |
| QR Codes: | |
|
| |
| Original text written by user: | |
| IsPrivate? | No (this computation is public) |
| User-defined keywords | |
| Estimated Impact | 168 |
Tree of Dependent Computations | |
| Family? (F = Feedback message, R = changed R code, M = changed R Module, P = changed Parameters, D = changed Data) | |
| - [R console] [test] [2009-07-02 16:32:12] [b768c7adc2675864c15627b87ad9ef22] [Current] | |
| Feedback Forum | |
Post a new message | |
Dataset | |
| Dataseries X: | |
0.290957299482296 0.510681318644528 -0.223667375994289 -0.433237209066157 1.09500326313182 3.06017294743841 -0.958959928222056 -0.36572002609241 -0.706312497388654 0.425612415892932 1.08669996281973 0.86873851918155 -0.297735177693015 0.956812672489445 0.367167618833798 0.483646551220628 0.145345046335042 -0.945594291332716 -1.48687346366557 -0.809077600267184 -0.223393909936892 -0.0885320348444989 -0.120898486480764 1.33822657568055 0.0502571629676235 -1.15101974751997 0.115543886006482 -0.72689618879948 -0.906538876438353 0.542297159059192 0.00173720568960120 -0.279981599055906 0.6003528755455 -0.250374454107401 0.128023903624830 -0.804748834808765 -1.21881121082815 -0.516358203507264 2.08214347427809 -0.892878613676347 -0.577824033218702 -0.995947593292948 -1.11045669153046 1.20620129268764 -0.454221206141101 -0.656551198413958 -1.59843872447189 -0.241419570925360 -1.00441663768800 -0.305570038359062 0.941420079462423 -1.34786438862973 0.94546572348462 0.862100014601029 -0.0526445906106109 -0.89924840519482 0.273777002408869 -1.10458847088788 -0.89048495097194 1.28883817088679 1.72468583558042 0.924911990611713 -0.0747417395089153 2.54474495205497 -0.751226038016642 -0.916225629441721 1.08024981400141 -1.77870705882675 0.00466549499588217 0.486499657198939 1.86683978784409 -2.60732456748824 2.02233139869934 0.76303230879652 0.0528561719275133 -0.537807711839541 0.756303061888386 -0.239056523325846 -0.314793449721253 1.08489208042251 0.949015068062958 1.14988638960229 0.593955583625224 2.26720246786033 1.11786676633437 1.04083582972233 -0.97013064554372 -1.26897060090018 -0.618044954996334 0.113087946093538 -0.88409227665669 -0.436347233377542 0.117627089785898 -1.44618206653447 1.20179279978631 0.196967630354036 2.41098809277505 0.816436633366726 1.28676362619828 -1.11329706994220 | |
Tables (Output of Computation) | |
> first_number = 5
> second_number = 7
> strpar = 'main title'
> {
+ myfun <- function(x, y) {
+ x + y
+ }
+
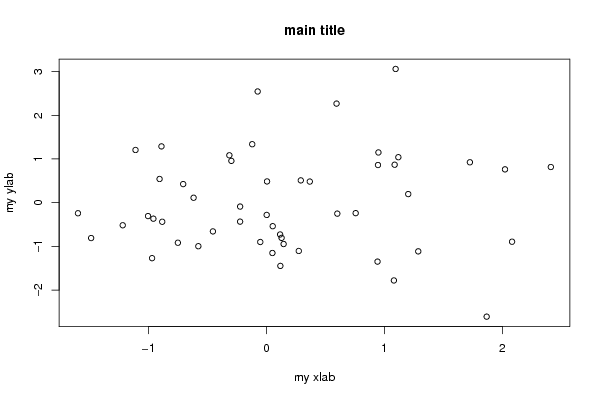
+ plot(RCx, main = strpar, xlab = 'my xlab', ylab = 'my ylab')
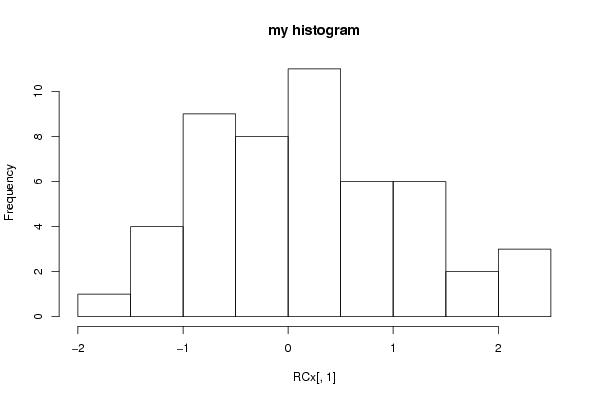
+ hist(R .... [TRUNCATED]
[1] 12
| |
Figures (Output of Computation) | |
Input Parameters & R Code | |
| Parameters (Session): | |
| par1 = 5 ; par2 = 7 ; par3 = maintitle ; | |
| Parameters (R input): | |
| R code (body of R function): | |
{ | |