\begin{tabular}{lllllllll}
\hline
Summary of computational transaction \tabularnewline
Raw Input & view raw input (R code)  \tabularnewline
Raw Output & view raw output of R engine  \tabularnewline
Computing time & 1 seconds \tabularnewline
R Server & 'George Udny Yule' @ 72.249.76.132 \tabularnewline
\hline
\end{tabular}
%Source: https://freestatistics.org/blog/index.php?pk=38775&T=0
[TABLE]
[ROW][C]Summary of computational transaction[/C][/ROW]
[ROW][C]Raw Input[/C][C]view raw input (R code) [/C][/ROW]
[ROW][C]Raw Output[/C][C]view raw output of R engine [/C][/ROW]
[ROW][C]Computing time[/C][C]1 seconds[/C][/ROW]
[ROW][C]R Server[/C][C]'George Udny Yule' @ 72.249.76.132[/C][/ROW]
[/TABLE]
Source: https://freestatistics.org/blog/index.php?pk=38775&T=0
If you paste this QR Code into your document, anyone with a smartphone or tablet will be able to scan it and view this table in a browser.
If you paste this QR Code into your document, anyone with a smartphone or tablet will be able to scan it and view this table in a browser.
If you paste this QR Code into your document, anyone with a smartphone or tablet will be able to scan it and view this table in a browser.
If you paste this QR Code into your document, anyone with a smartphone or tablet will be able to scan it and view this table in a browser.
If you paste this QR Code into your document, anyone with a smartphone or tablet will be able to scan it and view this table in a browser.
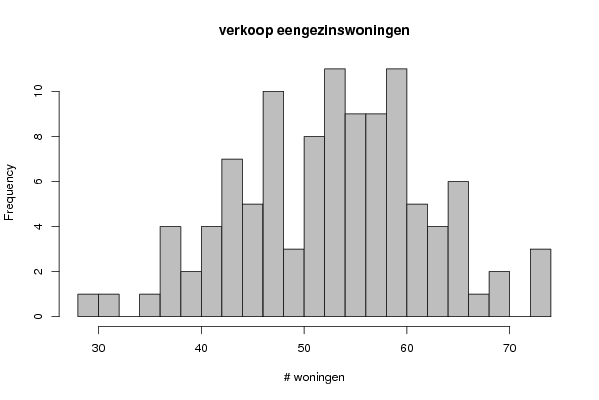
| Frequency Table (Histogram) | | Bins | Midpoint | Abs. Frequency | Rel. Frequency | Cumul. Rel. Freq. | Density | | [28,30[ | 29 | 1 | 0.009346 | 0.009346 | 0.004673 | | [30,32[ | 31 | 1 | 0.009346 | 0.018692 | 0.004673 | | [32,34[ | 33 | 0 | 0 | 0.018692 | 0 | | [34,36[ | 35 | 1 | 0.009346 | 0.028037 | 0.004673 | | [36,38[ | 37 | 4 | 0.037383 | 0.065421 | 0.018692 | | [38,40[ | 39 | 2 | 0.018692 | 0.084112 | 0.009346 | | [40,42[ | 41 | 4 | 0.037383 | 0.121495 | 0.018692 | | [42,44[ | 43 | 7 | 0.065421 | 0.186916 | 0.03271 | | [44,46[ | 45 | 5 | 0.046729 | 0.233645 | 0.023364 | | [46,48[ | 47 | 10 | 0.093458 | 0.327103 | 0.046729 | | [48,50[ | 49 | 3 | 0.028037 | 0.35514 | 0.014019 | | [50,52[ | 51 | 8 | 0.074766 | 0.429907 | 0.037383 | | [52,54[ | 53 | 11 | 0.102804 | 0.53271 | 0.051402 | | [54,56[ | 55 | 9 | 0.084112 | 0.616822 | 0.042056 | | [56,58[ | 57 | 9 | 0.084112 | 0.700935 | 0.042056 | | [58,60[ | 59 | 11 | 0.102804 | 0.803738 | 0.051402 | | [60,62[ | 61 | 5 | 0.046729 | 0.850467 | 0.023364 | | [62,64[ | 63 | 4 | 0.037383 | 0.88785 | 0.018692 | | [64,66[ | 65 | 6 | 0.056075 | 0.943925 | 0.028037 | | [66,68[ | 67 | 1 | 0.009346 | 0.953271 | 0.004673 | | [68,70[ | 69 | 2 | 0.018692 | 0.971963 | 0.009346 | | [70,72[ | 71 | 0 | 0 | 0.971963 | 0 | | [72,74] | 73 | 3 | 0.028037 | 1 | 0.014019 |
\begin{tabular}{lllllllll}
\hline
Frequency Table (Histogram) \tabularnewline
Bins & Midpoint & Abs. Frequency & Rel. Frequency & Cumul. Rel. Freq. & Density \tabularnewline
[28,30[ & 29 & 1 & 0.009346 & 0.009346 & 0.004673 \tabularnewline
[30,32[ & 31 & 1 & 0.009346 & 0.018692 & 0.004673 \tabularnewline
[32,34[ & 33 & 0 & 0 & 0.018692 & 0 \tabularnewline
[34,36[ & 35 & 1 & 0.009346 & 0.028037 & 0.004673 \tabularnewline
[36,38[ & 37 & 4 & 0.037383 & 0.065421 & 0.018692 \tabularnewline
[38,40[ & 39 & 2 & 0.018692 & 0.084112 & 0.009346 \tabularnewline
[40,42[ & 41 & 4 & 0.037383 & 0.121495 & 0.018692 \tabularnewline
[42,44[ & 43 & 7 & 0.065421 & 0.186916 & 0.03271 \tabularnewline
[44,46[ & 45 & 5 & 0.046729 & 0.233645 & 0.023364 \tabularnewline
[46,48[ & 47 & 10 & 0.093458 & 0.327103 & 0.046729 \tabularnewline
[48,50[ & 49 & 3 & 0.028037 & 0.35514 & 0.014019 \tabularnewline
[50,52[ & 51 & 8 & 0.074766 & 0.429907 & 0.037383 \tabularnewline
[52,54[ & 53 & 11 & 0.102804 & 0.53271 & 0.051402 \tabularnewline
[54,56[ & 55 & 9 & 0.084112 & 0.616822 & 0.042056 \tabularnewline
[56,58[ & 57 & 9 & 0.084112 & 0.700935 & 0.042056 \tabularnewline
[58,60[ & 59 & 11 & 0.102804 & 0.803738 & 0.051402 \tabularnewline
[60,62[ & 61 & 5 & 0.046729 & 0.850467 & 0.023364 \tabularnewline
[62,64[ & 63 & 4 & 0.037383 & 0.88785 & 0.018692 \tabularnewline
[64,66[ & 65 & 6 & 0.056075 & 0.943925 & 0.028037 \tabularnewline
[66,68[ & 67 & 1 & 0.009346 & 0.953271 & 0.004673 \tabularnewline
[68,70[ & 69 & 2 & 0.018692 & 0.971963 & 0.009346 \tabularnewline
[70,72[ & 71 & 0 & 0 & 0.971963 & 0 \tabularnewline
[72,74] & 73 & 3 & 0.028037 & 1 & 0.014019 \tabularnewline
\hline
\end{tabular}
%Source: https://freestatistics.org/blog/index.php?pk=38775&T=1
[TABLE]
[ROW][C]Frequency Table (Histogram)[/C][/ROW]
[ROW][C]Bins[/C][C]Midpoint[/C][C]Abs. Frequency[/C][C]Rel. Frequency[/C][C]Cumul. Rel. Freq.[/C][C]Density[/C][/ROW]
[ROW][C][28,30[[/C][C]29[/C][C]1[/C][C]0.009346[/C][C]0.009346[/C][C]0.004673[/C][/ROW]
[ROW][C][30,32[[/C][C]31[/C][C]1[/C][C]0.009346[/C][C]0.018692[/C][C]0.004673[/C][/ROW]
[ROW][C][32,34[[/C][C]33[/C][C]0[/C][C]0[/C][C]0.018692[/C][C]0[/C][/ROW]
[ROW][C][34,36[[/C][C]35[/C][C]1[/C][C]0.009346[/C][C]0.028037[/C][C]0.004673[/C][/ROW]
[ROW][C][36,38[[/C][C]37[/C][C]4[/C][C]0.037383[/C][C]0.065421[/C][C]0.018692[/C][/ROW]
[ROW][C][38,40[[/C][C]39[/C][C]2[/C][C]0.018692[/C][C]0.084112[/C][C]0.009346[/C][/ROW]
[ROW][C][40,42[[/C][C]41[/C][C]4[/C][C]0.037383[/C][C]0.121495[/C][C]0.018692[/C][/ROW]
[ROW][C][42,44[[/C][C]43[/C][C]7[/C][C]0.065421[/C][C]0.186916[/C][C]0.03271[/C][/ROW]
[ROW][C][44,46[[/C][C]45[/C][C]5[/C][C]0.046729[/C][C]0.233645[/C][C]0.023364[/C][/ROW]
[ROW][C][46,48[[/C][C]47[/C][C]10[/C][C]0.093458[/C][C]0.327103[/C][C]0.046729[/C][/ROW]
[ROW][C][48,50[[/C][C]49[/C][C]3[/C][C]0.028037[/C][C]0.35514[/C][C]0.014019[/C][/ROW]
[ROW][C][50,52[[/C][C]51[/C][C]8[/C][C]0.074766[/C][C]0.429907[/C][C]0.037383[/C][/ROW]
[ROW][C][52,54[[/C][C]53[/C][C]11[/C][C]0.102804[/C][C]0.53271[/C][C]0.051402[/C][/ROW]
[ROW][C][54,56[[/C][C]55[/C][C]9[/C][C]0.084112[/C][C]0.616822[/C][C]0.042056[/C][/ROW]
[ROW][C][56,58[[/C][C]57[/C][C]9[/C][C]0.084112[/C][C]0.700935[/C][C]0.042056[/C][/ROW]
[ROW][C][58,60[[/C][C]59[/C][C]11[/C][C]0.102804[/C][C]0.803738[/C][C]0.051402[/C][/ROW]
[ROW][C][60,62[[/C][C]61[/C][C]5[/C][C]0.046729[/C][C]0.850467[/C][C]0.023364[/C][/ROW]
[ROW][C][62,64[[/C][C]63[/C][C]4[/C][C]0.037383[/C][C]0.88785[/C][C]0.018692[/C][/ROW]
[ROW][C][64,66[[/C][C]65[/C][C]6[/C][C]0.056075[/C][C]0.943925[/C][C]0.028037[/C][/ROW]
[ROW][C][66,68[[/C][C]67[/C][C]1[/C][C]0.009346[/C][C]0.953271[/C][C]0.004673[/C][/ROW]
[ROW][C][68,70[[/C][C]69[/C][C]2[/C][C]0.018692[/C][C]0.971963[/C][C]0.009346[/C][/ROW]
[ROW][C][70,72[[/C][C]71[/C][C]0[/C][C]0[/C][C]0.971963[/C][C]0[/C][/ROW]
[ROW][C][72,74][/C][C]73[/C][C]3[/C][C]0.028037[/C][C]1[/C][C]0.014019[/C][/ROW]
[/TABLE]
Source: https://freestatistics.org/blog/index.php?pk=38775&T=1
Globally Unique Identifier (entire table): ba.freestatistics.org/blog/index.php?pk=38775&T=1
As an alternative you can also use a QR Code:
The GUIDs for individual cells are displayed in the table below:
| Frequency Table (Histogram) | | Bins | Midpoint | Abs. Frequency | Rel. Frequency | Cumul. Rel. Freq. | Density | | [28,30[ | 29 | 1 | 0.009346 | 0.009346 | 0.004673 | | [30,32[ | 31 | 1 | 0.009346 | 0.018692 | 0.004673 | | [32,34[ | 33 | 0 | 0 | 0.018692 | 0 | | [34,36[ | 35 | 1 | 0.009346 | 0.028037 | 0.004673 | | [36,38[ | 37 | 4 | 0.037383 | 0.065421 | 0.018692 | | [38,40[ | 39 | 2 | 0.018692 | 0.084112 | 0.009346 | | [40,42[ | 41 | 4 | 0.037383 | 0.121495 | 0.018692 | | [42,44[ | 43 | 7 | 0.065421 | 0.186916 | 0.03271 | | [44,46[ | 45 | 5 | 0.046729 | 0.233645 | 0.023364 | | [46,48[ | 47 | 10 | 0.093458 | 0.327103 | 0.046729 | | [48,50[ | 49 | 3 | 0.028037 | 0.35514 | 0.014019 | | [50,52[ | 51 | 8 | 0.074766 | 0.429907 | 0.037383 | | [52,54[ | 53 | 11 | 0.102804 | 0.53271 | 0.051402 | | [54,56[ | 55 | 9 | 0.084112 | 0.616822 | 0.042056 | | [56,58[ | 57 | 9 | 0.084112 | 0.700935 | 0.042056 | | [58,60[ | 59 | 11 | 0.102804 | 0.803738 | 0.051402 | | [60,62[ | 61 | 5 | 0.046729 | 0.850467 | 0.023364 | | [62,64[ | 63 | 4 | 0.037383 | 0.88785 | 0.018692 | | [64,66[ | 65 | 6 | 0.056075 | 0.943925 | 0.028037 | | [66,68[ | 67 | 1 | 0.009346 | 0.953271 | 0.004673 | | [68,70[ | 69 | 2 | 0.018692 | 0.971963 | 0.009346 | | [70,72[ | 71 | 0 | 0 | 0.971963 | 0 | | [72,74] | 73 | 3 | 0.028037 | 1 | 0.014019 |
If you paste this QR Code into your document, anyone with a smartphone or tablet will be able to scan it and view this table in a browser.
If you paste this QR Code into your document, anyone with a smartphone or tablet will be able to scan it and view this table in a browser.
If you paste this QR Code into your document, anyone with a smartphone or tablet will be able to scan it and view this table in a browser.
If you paste this QR Code into your document, anyone with a smartphone or tablet will be able to scan it and view this table in a browser.
If you paste this QR Code into your document, anyone with a smartphone or tablet will be able to scan it and view this table in a browser.
|