Free Statistics

of Irreproducible Research!

Author's title

Author*Unverified author*
R Software Modulerwasp_edabi.wasp
Title produced by softwareBivariate Explorative Data Analysis
Date of computationSun, 01 Nov 2009 14:06:42 -0700
Cite this page as followsStatistical Computations at FreeStatistics.org, Office for Research Development and Education, URL https://freestatistics.org/blog/index.php?v=date/2009/Nov/01/t1257109772ki61b3ffk0l00l8.htm/, Retrieved Tue, 07 May 2024 01:07:19 +0000
Statistical Computations at FreeStatistics.org, Office for Research Development and Education, URL https://freestatistics.org/blog/index.php?pk=52409, Retrieved Tue, 07 May 2024 01:07:19 +0000
QR Codes:

Original text written by user:
IsPrivate?No (this computation is public)
User-defined keywords
Estimated Impact118
Family? (F = Feedback message, R = changed R code, M = changed R Module, P = changed Parameters, D = changed Data)
-     [Bivariate Explorative Data Analysis] [Workshop 4] [2009-10-29 12:50:48] [1646a2766cb8c4a6f9d3b2fffef409b3]
-  M D    [Bivariate Explorative Data Analysis] [Workshop 4 - Part...] [2009-11-01 21:06:42] [d904c6aa144b8c40108ebe5ec22fe1a0] [Current]
Feedback Forum

Post a new message
Dataseries X:
95077872409
89058674329
83654571361
85249400625
86973087744
86135206144
84422208025
81074589696
79421385124
82859925316
1,00022E+11
1,05893E+11
1,06283E+11
1,07769E+11
1,00794E+11
1,00831E+11
98430905169
97516300176
95722790881
91778702500
90189699856
92437281225
1,11206E+11
1,1404E+11
1,1285E+11
1,04931E+11
98550161329
98900815225
98105515524
95891792896
91786579369
89394422121
89056286929
90981260161
1,08745E+11
1,12281E+11
1,07332E+11
95554556161
87566279056
84921536569
84996737764
81041563684
76438425625
74292224356
70214930361
69321624100
88093801636
92171745604
82365556036
76411886329
70981747776
71370725409
72028361161
68917800484
65301713764
64088972964
59439902809
62871049081
78649398025
81371556049
73427992576
68160677776
65332893609
67795661376
69644793409
69849732681
69314252176
68944055184
65621531889
69812736841
86353699600
90428308369
Dataseries Y:
72708426025
71308759369
66622320769
69070672969
71509712569
71484577956
70106859729
67010052769
64945464336
64957697424
76876989289
81425193201
82140706404
80112773764
76555695969
77236747225
76799928384
76786072609
75645351369
72981022500
71363779600
70221290049
82517733081
84789286596
85439290000
83051170596
79229301529
79894414336
78506436100
78628646464
76638170896
75743846656
75269019904
73609658721
83985199204
84521607076
85439290000
77565592036
72806070276
70682071321
72379293156
69788958976
65126019204
64187742609
60544047249
55399978384
66851205136
68117346049
64853243569
62821913449
59254270084
61060881025
61772628681
60044111521
56206926400
56209297225
50874606916
51455931921
61471268356
61669278889
60993686961
60073029604
60645465169
65415735225
69864533761
72010112409
74554118116
75055725369
71518804900
73980192049
85679144100
87545566161


Summary of computational transaction
Raw Inputview raw input (R code)
Raw Outputview raw output of R engine
Computing time3 seconds
R Server'Gwilym Jenkins' @ 72.249.127.135

\begin{tabular}{lllllllll}
\hline
Summary of computational transaction \tabularnewline
Raw Input & view raw input (R code)  \tabularnewline
Raw Output & view raw output of R engine  \tabularnewline
Computing time & 3 seconds \tabularnewline
R Server & 'Gwilym Jenkins' @ 72.249.127.135 \tabularnewline
\hline
\end{tabular}
%Source: https://freestatistics.org/blog/index.php?pk=52409&T=0

[TABLE]
[ROW][C]Summary of computational transaction[/C][/ROW]
[ROW][C]Raw Input[/C][C]view raw input (R code) [/C][/ROW]
[ROW][C]Raw Output[/C][C]view raw output of R engine [/C][/ROW]
[ROW][C]Computing time[/C][C]3 seconds[/C][/ROW]
[ROW][C]R Server[/C][C]'Gwilym Jenkins' @ 72.249.127.135[/C][/ROW]
[/TABLE]
Source: https://freestatistics.org/blog/index.php?pk=52409&T=0

Globally Unique Identifier (entire table): ba.freestatistics.org/blog/index.php?pk=52409&T=0

As an alternative you can also use a QR Code:  

The GUIDs for individual cells are displayed in the table below:

Summary of computational transaction
Raw Inputview raw input (R code)
Raw Outputview raw output of R engine
Computing time3 seconds
R Server'Gwilym Jenkins' @ 72.249.127.135


Model: Y[t] = c + b X[t] + e[t]
c26936146496.6125
b0.514516187642804

\begin{tabular}{lllllllll}
\hline
Model: Y[t] = c + b X[t] + e[t] \tabularnewline
c & 26936146496.6125 \tabularnewline
b & 0.514516187642804 \tabularnewline
\hline
\end{tabular}
%Source: https://freestatistics.org/blog/index.php?pk=52409&T=1

[TABLE]
[ROW][C]Model: Y[t] = c + b X[t] + e[t][/C][/ROW]
[ROW][C]c[/C][C]26936146496.6125[/C][/ROW]
[ROW][C]b[/C][C]0.514516187642804[/C][/ROW]
[/TABLE]
Source: https://freestatistics.org/blog/index.php?pk=52409&T=1

Globally Unique Identifier (entire table): ba.freestatistics.org/blog/index.php?pk=52409&T=1

As an alternative you can also use a QR Code:  

The GUIDs for individual cells are displayed in the table below:

Model: Y[t] = c + b X[t] + e[t]
c26936146496.6125
b0.514516187642804


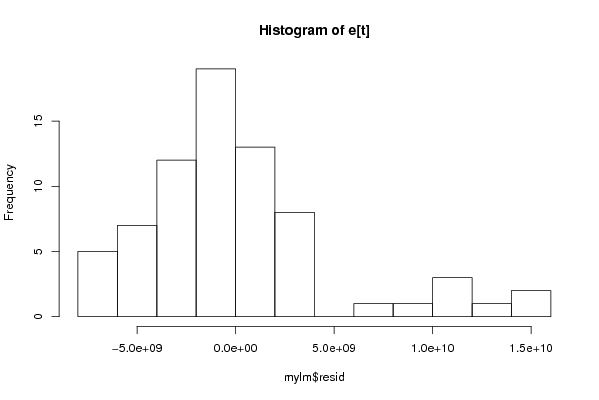
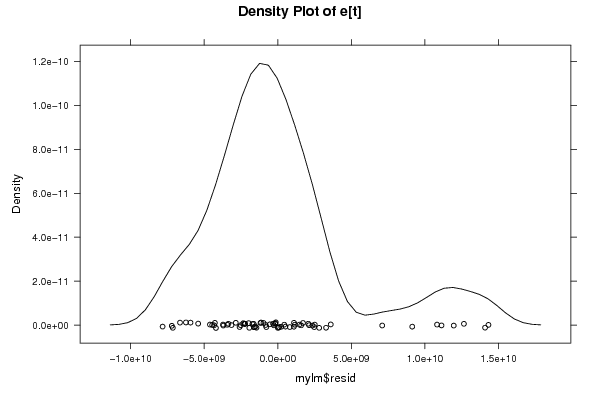
Descriptive Statistics about e[t]
# observations72
minimum-7828387061.8722
Q1-2661061876.74536
median-801399062.897248
mean4.8739214738210e-08
Q31495685127.09902
maximum14312621296.3436

\begin{tabular}{lllllllll}
\hline
Descriptive Statistics about e[t] \tabularnewline
# observations & 72 \tabularnewline
minimum & -7828387061.8722 \tabularnewline
Q1 & -2661061876.74536 \tabularnewline
median & -801399062.897248 \tabularnewline
mean & 4.8739214738210e-08 \tabularnewline
Q3 & 1495685127.09902 \tabularnewline
maximum & 14312621296.3436 \tabularnewline
\hline
\end{tabular}
%Source: https://freestatistics.org/blog/index.php?pk=52409&T=2

[TABLE]
[ROW][C]Descriptive Statistics about e[t][/C][/ROW]
[ROW][C]# observations[/C][C]72[/C][/ROW]
[ROW][C]minimum[/C][C]-7828387061.8722[/C][/ROW]
[ROW][C]Q1[/C][C]-2661061876.74536[/C][/ROW]
[ROW][C]median[/C][C]-801399062.897248[/C][/ROW]
[ROW][C]mean[/C][C]4.8739214738210e-08[/C][/ROW]
[ROW][C]Q3[/C][C]1495685127.09902[/C][/ROW]
[ROW][C]maximum[/C][C]14312621296.3436[/C][/ROW]
[/TABLE]
Source: https://freestatistics.org/blog/index.php?pk=52409&T=2

Globally Unique Identifier (entire table): ba.freestatistics.org/blog/index.php?pk=52409&T=2

As an alternative you can also use a QR Code:  

The GUIDs for individual cells are displayed in the table below:

Descriptive Statistics about e[t]
# observations72
minimum-7828387061.8722
Q1-2661061876.74536
median-801399062.897248
mean4.8739214738210e-08
Q31495685127.09902
maximum14312621296.3436


Parameters (Session):
par1 = 0 ; par2 = 36 ;
Parameters (R input):
par1 = 0 ; par2 = 36 ;
R code (references can be found in the software module):
par1 <- as.numeric(par1)
par2 <- as.numeric(par2)
x <- as.ts(x)
y <- as.ts(y)
mylm <- lm(y~x)
cbind(mylm$resid)
library(lattice)
bitmap(file='pic1.png')
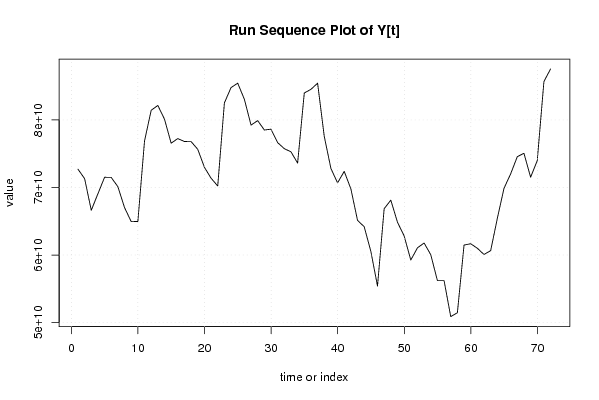
plot(y,type='l',main='Run Sequence Plot of Y[t]',xlab='time or index',ylab='value')
grid()
dev.off()
bitmap(file='pic1a.png')
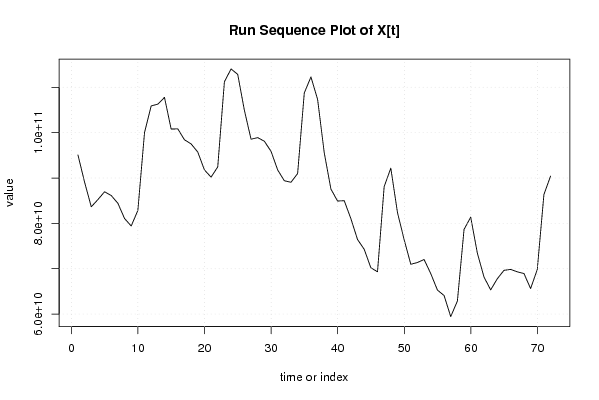
plot(x,type='l',main='Run Sequence Plot of X[t]',xlab='time or index',ylab='value')
grid()
dev.off()
bitmap(file='pic1b.png')
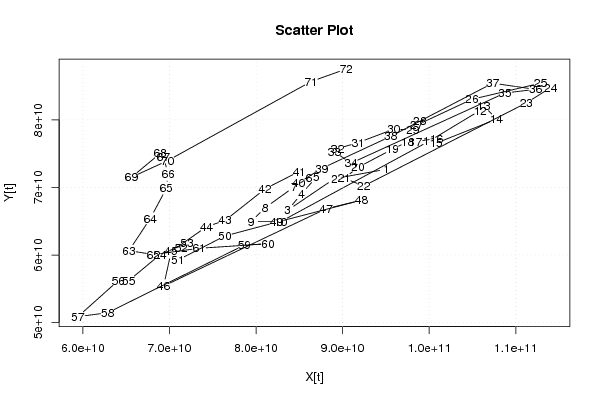
plot(x,y,main='Scatter Plot',xlab='X[t]',ylab='Y[t]')
grid()
dev.off()
bitmap(file='pic1c.png')
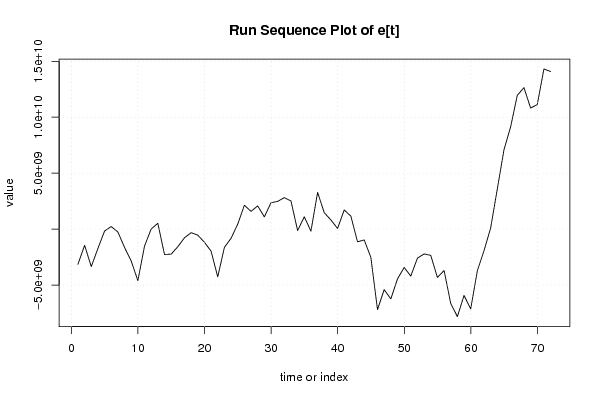
plot(mylm$resid,type='l',main='Run Sequence Plot of e[t]',xlab='time or index',ylab='value')
grid()
dev.off()
bitmap(file='pic2.png')
hist(mylm$resid,main='Histogram of e[t]')
dev.off()
bitmap(file='pic3.png')
if (par1 > 0)
{
densityplot(~mylm$resid,col='black',main=paste('Density Plot of e[t] bw = ',par1),bw=par1)
} else {
densityplot(~mylm$resid,col='black',main='Density Plot of e[t]')
}
dev.off()
bitmap(file='pic4.png')
qqnorm(mylm$resid,main='QQ plot of e[t]')
qqline(mylm$resid)
grid()
dev.off()
if (par2 > 0)
{
bitmap(file='pic5.png')
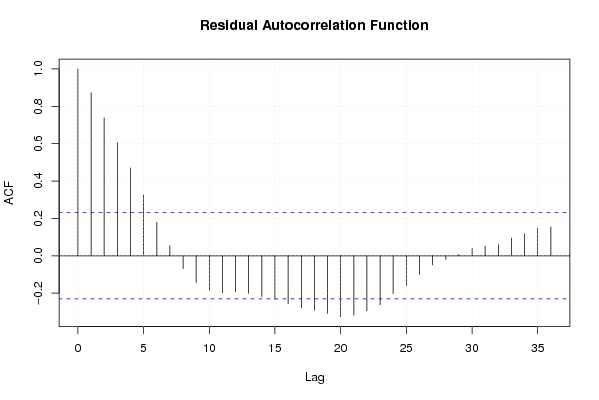
acf(mylm$resid,lag.max=par2,main='Residual Autocorrelation Function')
grid()
dev.off()
}
summary(x)
load(file='createtable')
a<-table.start()
a<-table.row.start(a)
a<-table.element(a,'Model: Y[t] = c + b X[t] + e[t]',2,TRUE)
a<-table.row.end(a)
a<-table.row.start(a)
a<-table.element(a,'c',1,TRUE)
a<-table.element(a,mylm$coeff[[1]])
a<-table.row.end(a)
a<-table.row.start(a)
a<-table.element(a,'b',1,TRUE)
a<-table.element(a,mylm$coeff[[2]])
a<-table.row.end(a)
a<-table.end(a)
table.save(a,file='mytable.tab')
a<-table.start()
a<-table.row.start(a)
a<-table.element(a,'Descriptive Statistics about e[t]',2,TRUE)
a<-table.row.end(a)
a<-table.row.start(a)
a<-table.element(a,'# observations',header=TRUE)
a<-table.element(a,length(mylm$resid))
a<-table.row.end(a)
a<-table.row.start(a)
a<-table.element(a,'minimum',header=TRUE)
a<-table.element(a,min(mylm$resid))
a<-table.row.end(a)
a<-table.row.start(a)
a<-table.element(a,'Q1',header=TRUE)
a<-table.element(a,quantile(mylm$resid,0.25))
a<-table.row.end(a)
a<-table.row.start(a)
a<-table.element(a,'median',header=TRUE)
a<-table.element(a,median(mylm$resid))
a<-table.row.end(a)
a<-table.row.start(a)
a<-table.element(a,'mean',header=TRUE)
a<-table.element(a,mean(mylm$resid))
a<-table.row.end(a)
a<-table.row.start(a)
a<-table.element(a,'Q3',header=TRUE)
a<-table.element(a,quantile(mylm$resid,0.75))
a<-table.row.end(a)
a<-table.row.start(a)
a<-table.element(a,'maximum',header=TRUE)
a<-table.element(a,max(mylm$resid))
a<-table.row.end(a)
a<-table.end(a)
table.save(a,file='mytable.tab')