Free Statistics
of Irreproducible Research!
Description of Statistical Computation | |||||||||||||||||||||||||||||||||||||||||||||
|---|---|---|---|---|---|---|---|---|---|---|---|---|---|---|---|---|---|---|---|---|---|---|---|---|---|---|---|---|---|---|---|---|---|---|---|---|---|---|---|---|---|---|---|---|---|
| Author's title | |||||||||||||||||||||||||||||||||||||||||||||
| Author | *Unverified author* | ||||||||||||||||||||||||||||||||||||||||||||
| R Software Module | rwasp_kendall.wasp | ||||||||||||||||||||||||||||||||||||||||||||
| Title produced by software | Kendall tau Rank Correlation | ||||||||||||||||||||||||||||||||||||||||||||
| Date of computation | Tue, 03 Nov 2009 11:52:09 -0700 | ||||||||||||||||||||||||||||||||||||||||||||
| Cite this page as follows | Statistical Computations at FreeStatistics.org, Office for Research Development and Education, URL https://freestatistics.org/blog/index.php?v=date/2009/Nov/03/t12572743670edgb0oznk6q8y2.htm/, Retrieved Wed, 01 May 2024 15:06:11 +0000 | ||||||||||||||||||||||||||||||||||||||||||||
| Statistical Computations at FreeStatistics.org, Office for Research Development and Education, URL https://freestatistics.org/blog/index.php?pk=53336, Retrieved Wed, 01 May 2024 15:06:11 +0000 | |||||||||||||||||||||||||||||||||||||||||||||
| QR Codes: | |||||||||||||||||||||||||||||||||||||||||||||
|
| |||||||||||||||||||||||||||||||||||||||||||||
| Original text written by user: | |||||||||||||||||||||||||||||||||||||||||||||
| IsPrivate? | No (this computation is public) | ||||||||||||||||||||||||||||||||||||||||||||
| User-defined keywords | |||||||||||||||||||||||||||||||||||||||||||||
| Estimated Impact | 159 | ||||||||||||||||||||||||||||||||||||||||||||
Tree of Dependent Computations | |||||||||||||||||||||||||||||||||||||||||||||
| Family? (F = Feedback message, R = changed R code, M = changed R Module, P = changed Parameters, D = changed Data) | |||||||||||||||||||||||||||||||||||||||||||||
| - [Bivariate Explorative Data Analysis] [Workshop 4 - Part...] [2009-10-28 17:23:53] [33b67a4fef396e07351e7d265eba4806] - RMPD [Kendall tau Rank Correlation] [Review WS4 Stud2] [2009-11-03 18:52:09] [30970b478e356ce7f8c2e9fca280b230] [Current] | |||||||||||||||||||||||||||||||||||||||||||||
| Feedback Forum | |||||||||||||||||||||||||||||||||||||||||||||
Post a new message | |||||||||||||||||||||||||||||||||||||||||||||
Dataset | |||||||||||||||||||||||||||||||||||||||||||||
| Dataseries X: | |||||||||||||||||||||||||||||||||||||||||||||
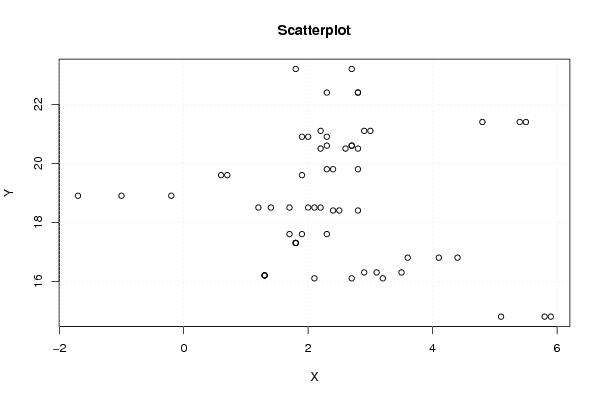
1.8 2.7 2.3 1.9 2 2.3 2.8 2.4 2.3 2.7 2.7 2.9 3 2.2 2.3 2.8 2.8 2.8 2.2 2.6 2.8 2.5 2.4 2.3 1.9 1.7 2 2.1 1.7 1.8 1.8 1.8 1.3 1.3 1.3 1.2 1.4 2.2 2.9 3.1 3.5 3.6 4.4 4.1 5.1 5.8 5.9 5.4 5.5 4.8 3.2 2.7 2.1 1.9 0.6 0.7 -0.2 -1 -1.7 | |||||||||||||||||||||||||||||||||||||||||||||
| Dataseries Y: | |||||||||||||||||||||||||||||||||||||||||||||
23.2 23.2 20.9 20.9 20.9 19.8 19.8 19.8 20.6 20.6 20.6 21.1 21.1 21.1 22.4 22.4 22.4 20.5 20.5 20.5 18.4 18.4 18.4 17.6 17.6 17.6 18.5 18.5 18.5 17.3 17.3 17.3 16.2 16.2 16.2 18.5 18.5 18.5 16.3 16.3 16.3 16.8 16.8 16.8 14.8 14.8 14.8 21.4 21.4 21.4 16.1 16.1 16.1 19.6 19.6 19.6 18.9 18.9 18.9 | |||||||||||||||||||||||||||||||||||||||||||||
Tables (Output of Computation) | |||||||||||||||||||||||||||||||||||||||||||||
| |||||||||||||||||||||||||||||||||||||||||||||
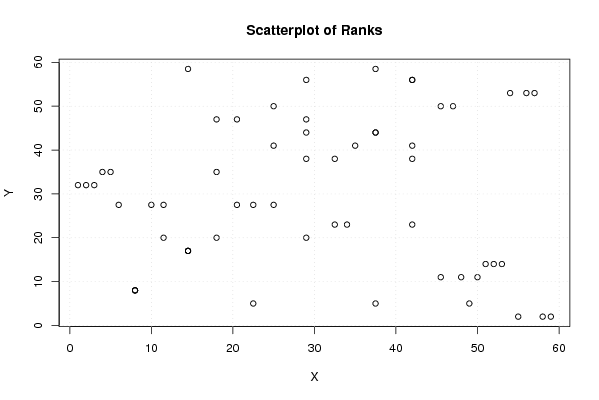
Figures (Output of Computation) | |||||||||||||||||||||||||||||||||||||||||||||
Input Parameters & R Code | |||||||||||||||||||||||||||||||||||||||||||||
| Parameters (Session): | |||||||||||||||||||||||||||||||||||||||||||||
| Parameters (R input): | |||||||||||||||||||||||||||||||||||||||||||||
| R code (references can be found in the software module): | |||||||||||||||||||||||||||||||||||||||||||||
library('Kendall') | |||||||||||||||||||||||||||||||||||||||||||||