Free Statistics

of Irreproducible Research!

Author's title

Author*The author of this computation has been verified*
R Software Modulerwasp_edabi.wasp
Title produced by softwareBivariate Explorative Data Analysis
Date of computationWed, 04 Nov 2009 04:38:51 -0700
Cite this page as followsStatistical Computations at FreeStatistics.org, Office for Research Development and Education, URL https://freestatistics.org/blog/index.php?v=date/2009/Nov/04/t1257334814tjkrqy32xyjcw1r.htm/, Retrieved Mon, 29 Apr 2024 12:19:58 +0000
Statistical Computations at FreeStatistics.org, Office for Research Development and Education, URL https://freestatistics.org/blog/index.php?pk=53569, Retrieved Mon, 29 Apr 2024 12:19:58 +0000
QR Codes:

Original text written by user:
IsPrivate?No (this computation is public)
User-defined keywordsSHWWS5V8
Estimated Impact150
Family? (F = Feedback message, R = changed R code, M = changed R Module, P = changed Parameters, D = changed Data)
-       [Bivariate Explorative Data Analysis] [] [2009-11-04 11:38:51] [71596e6a53ccce532e52aaf6113616ef] [Current]
- RMPD    [Pearson Correlation] [SHWWS5review] [2009-11-06 09:25:57] [a66d3a79ef9e5308cd94a469bc5ca464]
Feedback Forum

Post a new message
Dataseries X:
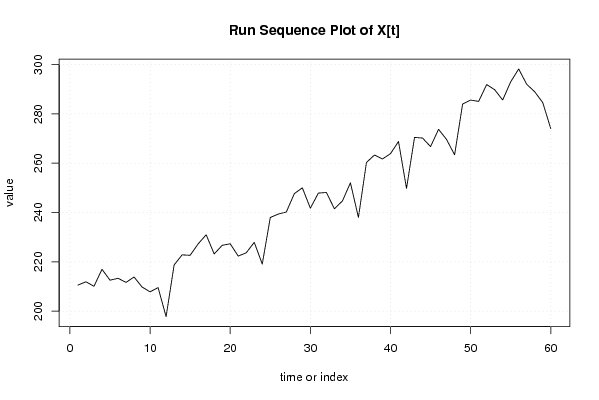
210.5719011
211.8997081
210.0843833
216.9714191
212.5325759
213.3266004
211.6320939
213.8495876
209.7836603
207.8165281
209.5503598
197.7604812
218.7340218
222.8200937
222.6256364
227.2831783
230.9728651
223.1882391
226.6908408
227.3001901
222.3150821
223.6556123
227.8932506
219.077975
237.9620698
239.3620698
240.1949375
247.6320939
250.0126723
241.7479499
247.8635157
248.1117083
241.5191789
244.6548894
252.0347448
237.994072
260.2839013
263.301395
261.6975884
263.8558533
268.7959015
249.7504089
270.4517565
270.1824554
266.7364317
273.7251544
269.6086247
263.3813488
283.9826964
285.5836603
285.0489138
291.8846243
289.7983114
285.6105526
292.9853472
298.2038049
291.9685765
288.9378776
284.5719503
273.9959999
Dataseries Y:
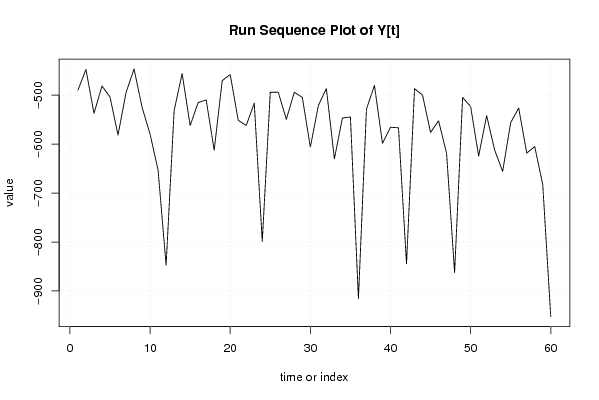
-489.655367
-447.6900293
-537.3677823
-481.4102379
-503.7985479
-581.5953765
-494.8534187
-446.578747
-524.8000885
-579.7086071
-653.407384
-847.3550966
-531.7339354
-455.9861327
-562.2051181
-515.2549594
-509.8456254
-612.3288157
-470.5160829
-457.8351585
-551.5732196
-562.0428617
-516.3417287
-798.8804249
-494.0911623
-494.2911623
-549.4996808
-494.2534187
-504.6475737
-606.2817381
-521.1265498
-486.5573154
-630.0568175
-546.8751679
-544.5016292
-915.6313089
-528.6226531
-480.2479814
-598.5478913
-565.6654263
-566.6899392
-844.5683272
-486.7818283
-499.9872656
-576.1595813
-552.459989
-618.924919
-862.4963291
-504.7098302
-523.2000885
-624.5719965
-541.8903469
-612.415585
-655.7054357
-555.9580406
-526.4736273
-618.4004061
-605.1949688
-683.0163103
-952.4118256


Summary of computational transaction
Raw Inputview raw input (R code)
Raw Outputview raw output of R engine
Computing time3 seconds
R Server'Gwilym Jenkins' @ 72.249.127.135

\begin{tabular}{lllllllll}
\hline
Summary of computational transaction \tabularnewline
Raw Input & view raw input (R code)  \tabularnewline
Raw Output & view raw output of R engine  \tabularnewline
Computing time & 3 seconds \tabularnewline
R Server & 'Gwilym Jenkins' @ 72.249.127.135 \tabularnewline
\hline
\end{tabular}
%Source: https://freestatistics.org/blog/index.php?pk=53569&T=0

[TABLE]
[ROW][C]Summary of computational transaction[/C][/ROW]
[ROW][C]Raw Input[/C][C]view raw input (R code) [/C][/ROW]
[ROW][C]Raw Output[/C][C]view raw output of R engine [/C][/ROW]
[ROW][C]Computing time[/C][C]3 seconds[/C][/ROW]
[ROW][C]R Server[/C][C]'Gwilym Jenkins' @ 72.249.127.135[/C][/ROW]
[/TABLE]
Source: https://freestatistics.org/blog/index.php?pk=53569&T=0

Globally Unique Identifier (entire table): ba.freestatistics.org/blog/index.php?pk=53569&T=0

As an alternative you can also use a QR Code:  

The GUIDs for individual cells are displayed in the table below:

Summary of computational transaction
Raw Inputview raw input (R code)
Raw Outputview raw output of R engine
Computing time3 seconds
R Server'Gwilym Jenkins' @ 72.249.127.135


Model: Y[t] = c + b X[t] + e[t]
c-448.794178972337
b-0.512660423765211

\begin{tabular}{lllllllll}
\hline
Model: Y[t] = c + b X[t] + e[t] \tabularnewline
c & -448.794178972337 \tabularnewline
b & -0.512660423765211 \tabularnewline
\hline
\end{tabular}
%Source: https://freestatistics.org/blog/index.php?pk=53569&T=1

[TABLE]
[ROW][C]Model: Y[t] = c + b X[t] + e[t][/C][/ROW]
[ROW][C]c[/C][C]-448.794178972337[/C][/ROW]
[ROW][C]b[/C][C]-0.512660423765211[/C][/ROW]
[/TABLE]
Source: https://freestatistics.org/blog/index.php?pk=53569&T=1

Globally Unique Identifier (entire table): ba.freestatistics.org/blog/index.php?pk=53569&T=1

As an alternative you can also use a QR Code:  

The GUIDs for individual cells are displayed in the table below:

Model: Y[t] = c + b X[t] + e[t]
c-448.794178972337
b-0.512660423765211


Descriptive Statistics about e[t]
# observations60
minimum-363.150741208956
Q1-23.6715988162811
median30.3691952704729
mean-4.19062932503304e-15
Q373.0381160154381
maximum111.847652173368

\begin{tabular}{lllllllll}
\hline
Descriptive Statistics about e[t] \tabularnewline
# observations & 60 \tabularnewline
minimum & -363.150741208956 \tabularnewline
Q1 & -23.6715988162811 \tabularnewline
median & 30.3691952704729 \tabularnewline
mean & -4.19062932503304e-15 \tabularnewline
Q3 & 73.0381160154381 \tabularnewline
maximum & 111.847652173368 \tabularnewline
\hline
\end{tabular}
%Source: https://freestatistics.org/blog/index.php?pk=53569&T=2

[TABLE]
[ROW][C]Descriptive Statistics about e[t][/C][/ROW]
[ROW][C]# observations[/C][C]60[/C][/ROW]
[ROW][C]minimum[/C][C]-363.150741208956[/C][/ROW]
[ROW][C]Q1[/C][C]-23.6715988162811[/C][/ROW]
[ROW][C]median[/C][C]30.3691952704729[/C][/ROW]
[ROW][C]mean[/C][C]-4.19062932503304e-15[/C][/ROW]
[ROW][C]Q3[/C][C]73.0381160154381[/C][/ROW]
[ROW][C]maximum[/C][C]111.847652173368[/C][/ROW]
[/TABLE]
Source: https://freestatistics.org/blog/index.php?pk=53569&T=2

Globally Unique Identifier (entire table): ba.freestatistics.org/blog/index.php?pk=53569&T=2

As an alternative you can also use a QR Code:  

The GUIDs for individual cells are displayed in the table below:

Descriptive Statistics about e[t]
# observations60
minimum-363.150741208956
Q1-23.6715988162811
median30.3691952704729
mean-4.19062932503304e-15
Q373.0381160154381
maximum111.847652173368


Parameters (Session):
par1 = 0 ; par2 = 36 ;
Parameters (R input):
par1 = 0 ; par2 = 36 ;
R code (references can be found in the software module):
par1 <- as.numeric(par1)
par2 <- as.numeric(par2)
x <- as.ts(x)
y <- as.ts(y)
mylm <- lm(y~x)
cbind(mylm$resid)
library(lattice)
bitmap(file='pic1.png')
plot(y,type='l',main='Run Sequence Plot of Y[t]',xlab='time or index',ylab='value')
grid()
dev.off()
bitmap(file='pic1a.png')
plot(x,type='l',main='Run Sequence Plot of X[t]',xlab='time or index',ylab='value')
grid()
dev.off()
bitmap(file='pic1b.png')
plot(x,y,main='Scatter Plot',xlab='X[t]',ylab='Y[t]')
grid()
dev.off()
bitmap(file='pic1c.png')
plot(mylm$resid,type='l',main='Run Sequence Plot of e[t]',xlab='time or index',ylab='value')
grid()
dev.off()
bitmap(file='pic2.png')
hist(mylm$resid,main='Histogram of e[t]')
dev.off()
bitmap(file='pic3.png')
if (par1 > 0)
{
densityplot(~mylm$resid,col='black',main=paste('Density Plot of e[t] bw = ',par1),bw=par1)
} else {
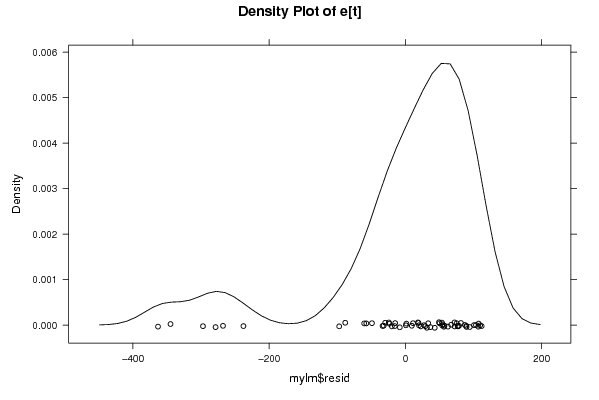
densityplot(~mylm$resid,col='black',main='Density Plot of e[t]')
}
dev.off()
bitmap(file='pic4.png')
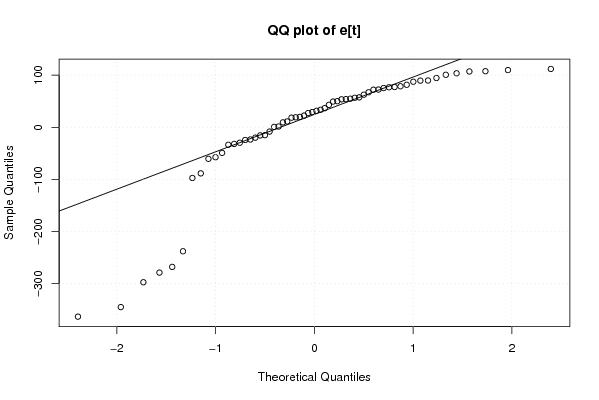
qqnorm(mylm$resid,main='QQ plot of e[t]')
qqline(mylm$resid)
grid()
dev.off()
if (par2 > 0)
{
bitmap(file='pic5.png')
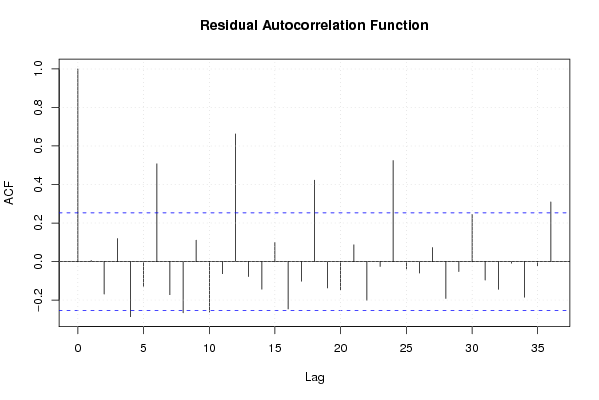
acf(mylm$resid,lag.max=par2,main='Residual Autocorrelation Function')
grid()
dev.off()
}
summary(x)
load(file='createtable')
a<-table.start()
a<-table.row.start(a)
a<-table.element(a,'Model: Y[t] = c + b X[t] + e[t]',2,TRUE)
a<-table.row.end(a)
a<-table.row.start(a)
a<-table.element(a,'c',1,TRUE)
a<-table.element(a,mylm$coeff[[1]])
a<-table.row.end(a)
a<-table.row.start(a)
a<-table.element(a,'b',1,TRUE)
a<-table.element(a,mylm$coeff[[2]])
a<-table.row.end(a)
a<-table.end(a)
table.save(a,file='mytable.tab')
a<-table.start()
a<-table.row.start(a)
a<-table.element(a,'Descriptive Statistics about e[t]',2,TRUE)
a<-table.row.end(a)
a<-table.row.start(a)
a<-table.element(a,'# observations',header=TRUE)
a<-table.element(a,length(mylm$resid))
a<-table.row.end(a)
a<-table.row.start(a)
a<-table.element(a,'minimum',header=TRUE)
a<-table.element(a,min(mylm$resid))
a<-table.row.end(a)
a<-table.row.start(a)
a<-table.element(a,'Q1',header=TRUE)
a<-table.element(a,quantile(mylm$resid,0.25))
a<-table.row.end(a)
a<-table.row.start(a)
a<-table.element(a,'median',header=TRUE)
a<-table.element(a,median(mylm$resid))
a<-table.row.end(a)
a<-table.row.start(a)
a<-table.element(a,'mean',header=TRUE)
a<-table.element(a,mean(mylm$resid))
a<-table.row.end(a)
a<-table.row.start(a)
a<-table.element(a,'Q3',header=TRUE)
a<-table.element(a,quantile(mylm$resid,0.75))
a<-table.row.end(a)
a<-table.row.start(a)
a<-table.element(a,'maximum',header=TRUE)
a<-table.element(a,max(mylm$resid))
a<-table.row.end(a)
a<-table.end(a)
table.save(a,file='mytable.tab')