Free Statistics

of Irreproducible Research!

Author's title

Author*The author of this computation has been verified*
R Software Modulerwasp_edauni.wasp
Title produced by softwareUnivariate Explorative Data Analysis
Date of computationWed, 04 Nov 2009 07:53:44 -0700
Cite this page as followsStatistical Computations at FreeStatistics.org, Office for Research Development and Education, URL https://freestatistics.org/blog/index.php?v=date/2009/Nov/04/t1257346471h3hrc29w47zc94b.htm/, Retrieved Mon, 29 Apr 2024 10:23:18 +0000
Statistical Computations at FreeStatistics.org, Office for Research Development and Education, URL https://freestatistics.org/blog/index.php?pk=53607, Retrieved Mon, 29 Apr 2024 10:23:18 +0000
QR Codes:

Original text written by user:
IsPrivate?No (this computation is public)
User-defined keywords
Estimated Impact104
Family? (F = Feedback message, R = changed R code, M = changed R Module, P = changed Parameters, D = changed Data)
-     [Bivariate Data Series] [Bivariate dataset] [2008-01-05 23:51:08] [74be16979710d4c4e7c6647856088456]
- RMPD    [Univariate Explorative Data Analysis] [WS4: univariate E...] [2009-11-04 14:53:44] [b090d569c0a4c77894e0b029f4429f19] [Current]
Feedback Forum

Post a new message
Dataseries X:
-10.5094	   
-9.90451	   
-8.66742	   
-7.29998	   
-6.61005	   
-6.43831	   
-7.91188	   
-8.60451	   
-9.15627	   
-8.65783	   
-8.76742	   
-9.11188	   
-9.50527	   
-9.40527	   
-9.50527	   
-8.86742	   
-9.06742	   
-7.60501	   
-7.86742	   
-7.66742	   
-8.11188	   
-9.05783	   
-9.45783	   
-10.0542	   
-10.6563	   
-11.0094	   
-11.2094	   
-11.4094	   
-10.3542	   
-8.28309	   
-6.13335	   
-4.93831	   
-5.4683	   
-6.63335	   
-7.26836	   
-7.60501	   
-7.84326	   
-7.50501	   
-6.83335	   
-7.06836	   
-6.79998	   
-5.98355	   
-6.8683	   
-6.83831	   
-6.58355	   
-6.05883	   
-5.73591	   
-6.61005	   
-7.69998	   
-7.99998	   
-7.18355	   
-6.51484	   
-5.86296	   
-6.41484	   
-8.74326	   
-8.58309	   
-7.63335	   
-5.41484	   
-4.86296	   
-5.83591	   
-8.30501	 


Summary of computational transaction
Raw Inputview raw input (R code)
Raw Outputview raw output of R engine
Computing time3 seconds
R Server'Gwilym Jenkins' @ 72.249.127.135

\begin{tabular}{lllllllll}
\hline
Summary of computational transaction \tabularnewline
Raw Input & view raw input (R code)  \tabularnewline
Raw Output & view raw output of R engine  \tabularnewline
Computing time & 3 seconds \tabularnewline
R Server & 'Gwilym Jenkins' @ 72.249.127.135 \tabularnewline
\hline
\end{tabular}
%Source: https://freestatistics.org/blog/index.php?pk=53607&T=0

[TABLE]
[ROW][C]Summary of computational transaction[/C][/ROW]
[ROW][C]Raw Input[/C][C]view raw input (R code) [/C][/ROW]
[ROW][C]Raw Output[/C][C]view raw output of R engine [/C][/ROW]
[ROW][C]Computing time[/C][C]3 seconds[/C][/ROW]
[ROW][C]R Server[/C][C]'Gwilym Jenkins' @ 72.249.127.135[/C][/ROW]
[/TABLE]
Source: https://freestatistics.org/blog/index.php?pk=53607&T=0

Globally Unique Identifier (entire table): ba.freestatistics.org/blog/index.php?pk=53607&T=0

As an alternative you can also use a QR Code:  

The GUIDs for individual cells are displayed in the table below:

Summary of computational transaction
Raw Inputview raw input (R code)
Raw Outputview raw output of R engine
Computing time3 seconds
R Server'Gwilym Jenkins' @ 72.249.127.135


Descriptive Statistics
# observations61
minimum-11.4094
Q1-9.05783
median-7.69998
mean-7.87808524590164
Q3-6.61005
maximum-4.86296

\begin{tabular}{lllllllll}
\hline
Descriptive Statistics \tabularnewline
# observations & 61 \tabularnewline
minimum & -11.4094 \tabularnewline
Q1 & -9.05783 \tabularnewline
median & -7.69998 \tabularnewline
mean & -7.87808524590164 \tabularnewline
Q3 & -6.61005 \tabularnewline
maximum & -4.86296 \tabularnewline
\hline
\end{tabular}
%Source: https://freestatistics.org/blog/index.php?pk=53607&T=1

[TABLE]
[ROW][C]Descriptive Statistics[/C][/ROW]
[ROW][C]# observations[/C][C]61[/C][/ROW]
[ROW][C]minimum[/C][C]-11.4094[/C][/ROW]
[ROW][C]Q1[/C][C]-9.05783[/C][/ROW]
[ROW][C]median[/C][C]-7.69998[/C][/ROW]
[ROW][C]mean[/C][C]-7.87808524590164[/C][/ROW]
[ROW][C]Q3[/C][C]-6.61005[/C][/ROW]
[ROW][C]maximum[/C][C]-4.86296[/C][/ROW]
[/TABLE]
Source: https://freestatistics.org/blog/index.php?pk=53607&T=1

Globally Unique Identifier (entire table): ba.freestatistics.org/blog/index.php?pk=53607&T=1

As an alternative you can also use a QR Code:  

The GUIDs for individual cells are displayed in the table below:

Descriptive Statistics
# observations61
minimum-11.4094
Q1-9.05783
median-7.69998
mean-7.87808524590164
Q3-6.61005
maximum-4.86296


Parameters (Session):
par1 = 0 ; par2 = 36 ;
Parameters (R input):
par1 = 0 ; par2 = 36 ;
R code (references can be found in the software module):
par1 <- as.numeric(par1)
par2 <- as.numeric(par2)
x <- as.ts(x)
library(lattice)
bitmap(file='pic1.png')
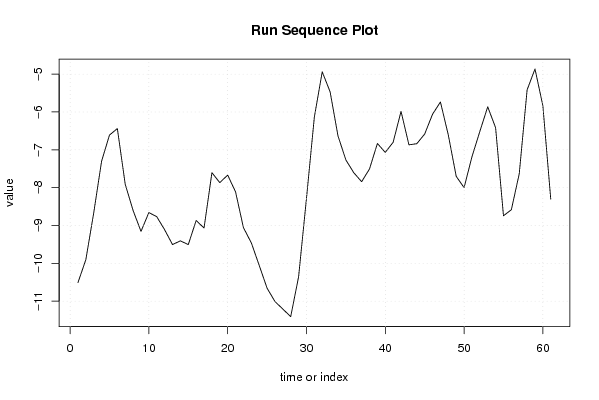
plot(x,type='l',main='Run Sequence Plot',xlab='time or index',ylab='value')
grid()
dev.off()
bitmap(file='pic2.png')
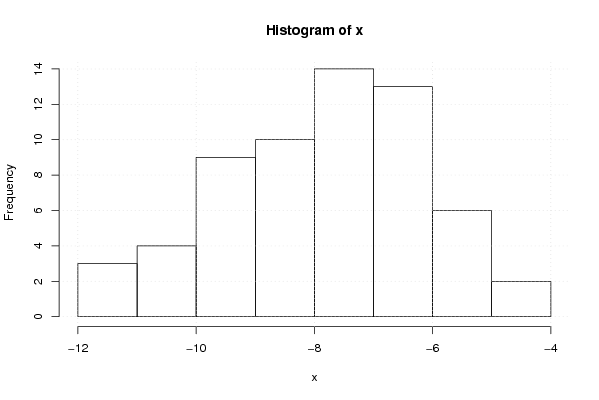
hist(x)
grid()
dev.off()
bitmap(file='pic3.png')
if (par1 > 0)
{
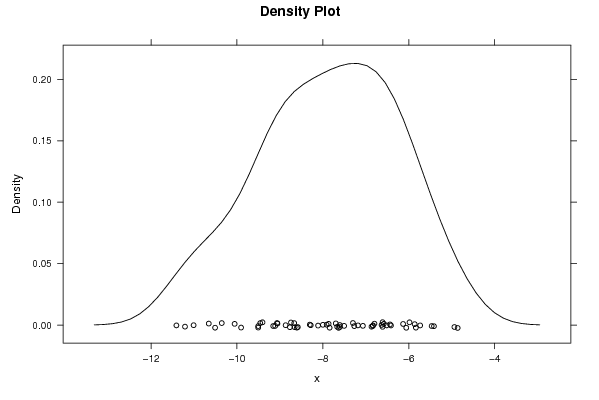
densityplot(~x,col='black',main=paste('Density Plot bw = ',par1),bw=par1)
} else {
densityplot(~x,col='black',main='Density Plot')
}
dev.off()
bitmap(file='pic4.png')
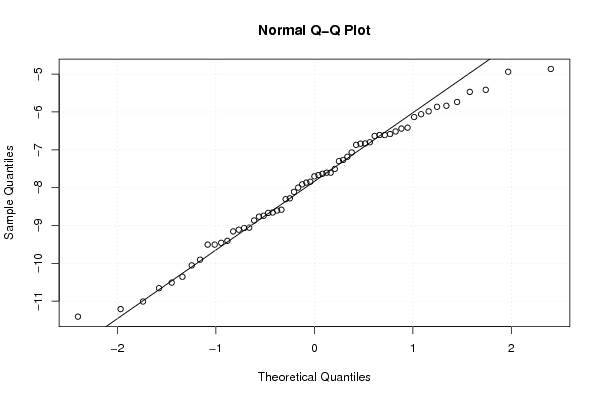
qqnorm(x)
qqline(x)
grid()
dev.off()
if (par2 > 0)
{
bitmap(file='lagplot1.png')
dum <- cbind(lag(x,k=1),x)
dum
dum1 <- dum[2:length(x),]
dum1
z <- as.data.frame(dum1)
z
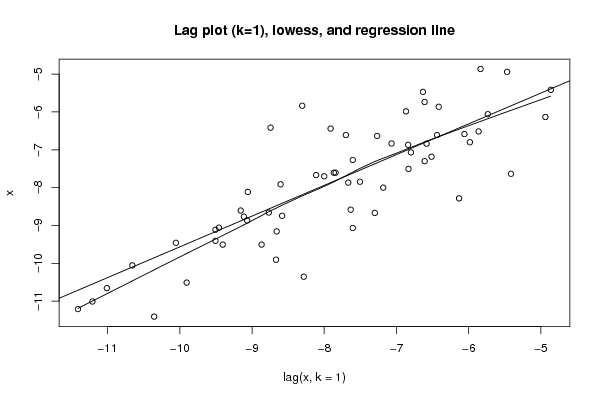
plot(z,main='Lag plot (k=1), lowess, and regression line')
lines(lowess(z))
abline(lm(z))
dev.off()
if (par2 > 1) {
bitmap(file='lagplotpar2.png')
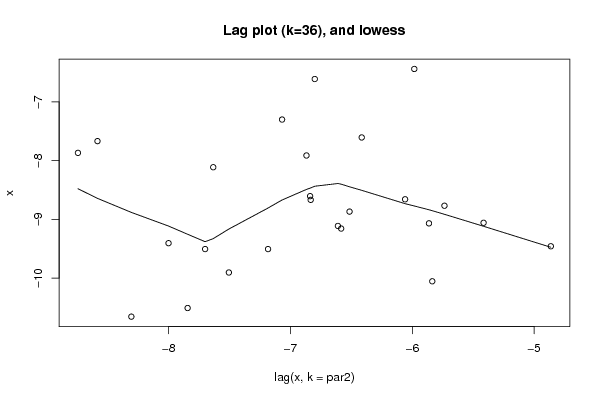
dum <- cbind(lag(x,k=par2),x)
dum
dum1 <- dum[(par2+1):length(x),]
dum1
z <- as.data.frame(dum1)
z
mylagtitle <- 'Lag plot (k='
mylagtitle <- paste(mylagtitle,par2,sep='')
mylagtitle <- paste(mylagtitle,'), and lowess',sep='')
plot(z,main=mylagtitle)
lines(lowess(z))
dev.off()
}
bitmap(file='pic5.png')
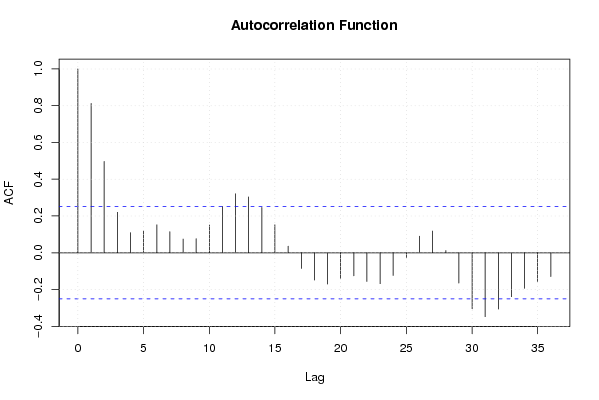
acf(x,lag.max=par2,main='Autocorrelation Function')
grid()
dev.off()
}
summary(x)
load(file='createtable')
a<-table.start()
a<-table.row.start(a)
a<-table.element(a,'Descriptive Statistics',2,TRUE)
a<-table.row.end(a)
a<-table.row.start(a)
a<-table.element(a,'# observations',header=TRUE)
a<-table.element(a,length(x))
a<-table.row.end(a)
a<-table.row.start(a)
a<-table.element(a,'minimum',header=TRUE)
a<-table.element(a,min(x))
a<-table.row.end(a)
a<-table.row.start(a)
a<-table.element(a,'Q1',header=TRUE)
a<-table.element(a,quantile(x,0.25))
a<-table.row.end(a)
a<-table.row.start(a)
a<-table.element(a,'median',header=TRUE)
a<-table.element(a,median(x))
a<-table.row.end(a)
a<-table.row.start(a)
a<-table.element(a,'mean',header=TRUE)
a<-table.element(a,mean(x))
a<-table.row.end(a)
a<-table.row.start(a)
a<-table.element(a,'Q3',header=TRUE)
a<-table.element(a,quantile(x,0.75))
a<-table.row.end(a)
a<-table.row.start(a)
a<-table.element(a,'maximum',header=TRUE)
a<-table.element(a,max(x))
a<-table.row.end(a)
a<-table.end(a)
table.save(a,file='mytable.tab')