Free Statistics

of Irreproducible Research!

Author's title

Author*The author of this computation has been verified*
R Software Modulerwasp_notchedbox1.wasp
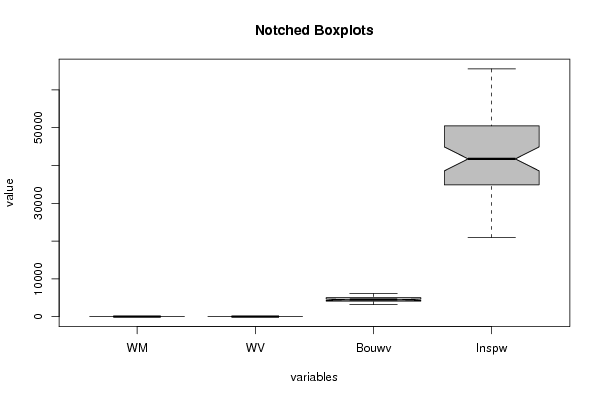
Title produced by softwareNotched Boxplots
Date of computationWed, 04 Nov 2009 07:58:21 -0700
Cite this page as followsStatistical Computations at FreeStatistics.org, Office for Research Development and Education, URL https://freestatistics.org/blog/index.php?v=date/2009/Nov/04/t1257346829vsiwewrzmmlw3p1.htm/, Retrieved Mon, 29 Apr 2024 16:16:48 +0000
Statistical Computations at FreeStatistics.org, Office for Research Development and Education, URL https://freestatistics.org/blog/index.php?pk=53612, Retrieved Mon, 29 Apr 2024 16:16:48 +0000
QR Codes:

Original text written by user:
IsPrivate?No (this computation is public)
User-defined keywords
Estimated Impact176
Family? (F = Feedback message, R = changed R code, M = changed R Module, P = changed Parameters, D = changed Data)
-     [Notched Boxplots] [3/11/2009] [2009-11-02 21:10:41] [b98453cac15ba1066b407e146608df68]
F    D    [Notched Boxplots] [] [2009-11-04 14:58:21] [91df150cd527c563f0151b3a845ecd72] [Current]
-    D      [Notched Boxplots] [notched boxplot] [2009-11-16 18:32:43] [ed603017d2bee8fbd82b6d5ec04e12c3]
-    D      [Notched Boxplots] [WS 6 Review] [2009-11-20 12:01:20] [830e13ac5e5ac1e5b21c6af0c149b21d]
Feedback Forum
2009-11-16 18:38:14 [Mathias Danneel] [reply
In uw compendium had u de mogelijkheid om via de notched boxplot de werkloosheid man en de werkloosheid vrouw met elkaar te vergelijken. Hierbij vindt u een link waarbij dit wel gedaan is: http://www.freestatistics.org/blog/index.php?v=date/2009/Nov/16/t1258396391pfwtpvquzt7l1an.htm/. Aan de hand van de notched boxplot kunnen we controleren of de dataset significant van elkaar verschillen m.b.t. de mediaan. Eveneens biedt het ook een antwoord op spreiding en locatie van de datasets. Indien er outliers zijn kan u deze ook waarnemen.

Post a new message
Dataseries X:
8	11.1	5560	33842
8.1	10.9	3922	39120
7.7	10	3759	33702
7.5	9.2	4138	25094
7.6	9.2	4634	51442
7.8	9.5	3996	45594
7.8	9.6	4308	52518
7.8	9.5	4143	48564
7.5	9.1	4429	41745
7.5	8.9	5219	49585
7.1	9	4929	32747
7.5	10.1	5755	33379
7.5	10.3	5592	35645
7.6	10.2	4163	37034
7.7	9.6	4962	35681
7.7	9.2	5208	20972
7.9	9.3	4755	58552
8.1	9.4	4491	54955
8.2	9.4	5732	65540
8.2	9.2	5731	51570
8.2	9	5040	51145
7.9	9	6102	46641
7.3	9	4904	35704
6.9	9.8	5369	33253
6.7	10	5578	35193
6.7	9.8	4619	41668
6.9	9.3	4731	34865
7	9	5011	21210
7.1	9	5299	56126
7.2	9.1	4146	49231
7.1	9.1	4625	59723
6.9	9.1	4736	48103
7	9.2	4219	47472
6.8	8.8	5116	50497
6.4	8.3	4205	40059
6.7	8.4	4121	34149
6.6	8.1	5103	36860
6.4	7.7	4300	46356
6.3	7.9	4578	36577
6.2	7.9	3809	23872
6.5	8	5526	57276
6.8	7.9	4247	56389
6.8	7.6	3830	57657
6.4	7.1	4394	62300
6.1	6.8	4826	48929
5.8	6.5	4409	51168
6.1	6.9	4569	39636
7.2	8.2	4106	33213
7.3	8.7	4794	38127
6.9	8.3	3914	43291
6.1	7.9	3793	30600
5.8	7.5	4405	21956
6.2	7.8	4022	48033
7.1	8.3	4100	46148
7.7	8.4	4788	50736
7.9	8.2	3163	48114
7.7	7.7	3585	38390
7.4	7.2	3903	44112
7.5	7.3	4178	36287
8	8.1	3863	30333
8.1	8.5	4187	30301


Summary of computational transaction
Raw Inputview raw input (R code)
Raw Outputview raw output of R engine
Computing time1 seconds
R Server'Gwilym Jenkins' @ 72.249.127.135

\begin{tabular}{lllllllll}
\hline
Summary of computational transaction \tabularnewline
Raw Input & view raw input (R code)  \tabularnewline
Raw Output & view raw output of R engine  \tabularnewline
Computing time & 1 seconds \tabularnewline
R Server & 'Gwilym Jenkins' @ 72.249.127.135 \tabularnewline
\hline
\end{tabular}
%Source: https://freestatistics.org/blog/index.php?pk=53612&T=0

[TABLE]
[ROW][C]Summary of computational transaction[/C][/ROW]
[ROW][C]Raw Input[/C][C]view raw input (R code) [/C][/ROW]
[ROW][C]Raw Output[/C][C]view raw output of R engine [/C][/ROW]
[ROW][C]Computing time[/C][C]1 seconds[/C][/ROW]
[ROW][C]R Server[/C][C]'Gwilym Jenkins' @ 72.249.127.135[/C][/ROW]
[/TABLE]
Source: https://freestatistics.org/blog/index.php?pk=53612&T=0

Globally Unique Identifier (entire table): ba.freestatistics.org/blog/index.php?pk=53612&T=0

As an alternative you can also use a QR Code:  

The GUIDs for individual cells are displayed in the table below:

Summary of computational transaction
Raw Inputview raw input (R code)
Raw Outputview raw output of R engine
Computing time1 seconds
R Server'Gwilym Jenkins' @ 72.249.127.135


Boxplot statistics
Variablelower whiskerlower hingemedianupper hingeupper whisker
WM5.86.77.27.78.2
WV6.5899.311.1
Bouwv31634138449150116102
Inspw2097234865417455049765540

\begin{tabular}{lllllllll}
\hline
Boxplot statistics \tabularnewline
Variable & lower whisker & lower hinge & median & upper hinge & upper whisker \tabularnewline
WM & 5.8 & 6.7 & 7.2 & 7.7 & 8.2 \tabularnewline
WV & 6.5 & 8 & 9 & 9.3 & 11.1 \tabularnewline
Bouwv & 3163 & 4138 & 4491 & 5011 & 6102 \tabularnewline
Inspw & 20972 & 34865 & 41745 & 50497 & 65540 \tabularnewline
\hline
\end{tabular}
%Source: https://freestatistics.org/blog/index.php?pk=53612&T=1

[TABLE]
[ROW][C]Boxplot statistics[/C][/ROW]
[ROW][C]Variable[/C][C]lower whisker[/C][C]lower hinge[/C][C]median[/C][C]upper hinge[/C][C]upper whisker[/C][/ROW]
[ROW][C]WM[/C][C]5.8[/C][C]6.7[/C][C]7.2[/C][C]7.7[/C][C]8.2[/C][/ROW]
[ROW][C]WV[/C][C]6.5[/C][C]8[/C][C]9[/C][C]9.3[/C][C]11.1[/C][/ROW]
[ROW][C]Bouwv[/C][C]3163[/C][C]4138[/C][C]4491[/C][C]5011[/C][C]6102[/C][/ROW]
[ROW][C]Inspw[/C][C]20972[/C][C]34865[/C][C]41745[/C][C]50497[/C][C]65540[/C][/ROW]
[/TABLE]
Source: https://freestatistics.org/blog/index.php?pk=53612&T=1

Globally Unique Identifier (entire table): ba.freestatistics.org/blog/index.php?pk=53612&T=1

As an alternative you can also use a QR Code:  

The GUIDs for individual cells are displayed in the table below:

Boxplot statistics
Variablelower whiskerlower hingemedianupper hingeupper whisker
WM5.86.77.27.78.2
WV6.5899.311.1
Bouwv31634138449150116102
Inspw2097234865417455049765540


Boxplot Notches
Variablelower boundmedianupper bound
WM6.997701729706027.27.40229827029398
WV8.7370122486178399.26298775138217
Bouwv4314.3936100333644914667.60638996664
Inspw38582.67343876464174544907.3265612354

\begin{tabular}{lllllllll}
\hline
Boxplot Notches \tabularnewline
Variable & lower bound & median & upper bound \tabularnewline
WM & 6.99770172970602 & 7.2 & 7.40229827029398 \tabularnewline
WV & 8.73701224861783 & 9 & 9.26298775138217 \tabularnewline
Bouwv & 4314.39361003336 & 4491 & 4667.60638996664 \tabularnewline
Inspw & 38582.6734387646 & 41745 & 44907.3265612354 \tabularnewline
\hline
\end{tabular}
%Source: https://freestatistics.org/blog/index.php?pk=53612&T=2

[TABLE]
[ROW][C]Boxplot Notches[/C][/ROW]
[ROW][C]Variable[/C][C]lower bound[/C][C]median[/C][C]upper bound[/C][/ROW]
[ROW][C]WM[/C][C]6.99770172970602[/C][C]7.2[/C][C]7.40229827029398[/C][/ROW]
[ROW][C]WV[/C][C]8.73701224861783[/C][C]9[/C][C]9.26298775138217[/C][/ROW]
[ROW][C]Bouwv[/C][C]4314.39361003336[/C][C]4491[/C][C]4667.60638996664[/C][/ROW]
[ROW][C]Inspw[/C][C]38582.6734387646[/C][C]41745[/C][C]44907.3265612354[/C][/ROW]
[/TABLE]
Source: https://freestatistics.org/blog/index.php?pk=53612&T=2

Globally Unique Identifier (entire table): ba.freestatistics.org/blog/index.php?pk=53612&T=2

As an alternative you can also use a QR Code:  

The GUIDs for individual cells are displayed in the table below:

Boxplot Notches
Variablelower boundmedianupper bound
WM6.997701729706027.27.40229827029398
WV8.7370122486178399.26298775138217
Bouwv4314.3936100333644914667.60638996664
Inspw38582.67343876464174544907.3265612354


Parameters (Session):
par1 = grey ;
Parameters (R input):
par1 = grey ;
R code (references can be found in the software module):
z <- as.data.frame(t(y))
bitmap(file='test1.png')
(r<-boxplot(z ,xlab=xlab,ylab=ylab,main=main,notch=TRUE,col=par1))
dev.off()
load(file='createtable')
a<-table.start()
a<-table.row.start(a)
a<-table.element(a,hyperlink('overview.htm','Boxplot statistics','Boxplot overview'),6,TRUE)
a<-table.row.end(a)
a<-table.row.start(a)
a<-table.element(a,'Variable',1,TRUE)
a<-table.element(a,hyperlink('lower_whisker.htm','lower whisker','definition of lower whisker'),1,TRUE)
a<-table.element(a,hyperlink('lower_hinge.htm','lower hinge','definition of lower hinge'),1,TRUE)
a<-table.element(a,hyperlink('central_tendency.htm','median','definitions about measures of central tendency'),1,TRUE)
a<-table.element(a,hyperlink('upper_hinge.htm','upper hinge','definition of upper hinge'),1,TRUE)
a<-table.element(a,hyperlink('upper_whisker.htm','upper whisker','definition of upper whisker'),1,TRUE)
a<-table.row.end(a)
for (i in 1:length(y[,1]))
{
a<-table.row.start(a)
a<-table.element(a,dimnames(t(x))[[2]][i],1,TRUE)
for (j in 1:5)
{
a<-table.element(a,r$stats[j,i])
}
a<-table.row.end(a)
}
a<-table.end(a)
table.save(a,file='mytable.tab')
a<-table.start()
a<-table.row.start(a)
a<-table.element(a,'Boxplot Notches',4,TRUE)
a<-table.row.end(a)
a<-table.row.start(a)
a<-table.element(a,'Variable',1,TRUE)
a<-table.element(a,'lower bound',1,TRUE)
a<-table.element(a,'median',1,TRUE)
a<-table.element(a,'upper bound',1,TRUE)
a<-table.row.end(a)
for (i in 1:length(y[,1]))
{
a<-table.row.start(a)
a<-table.element(a,dimnames(t(x))[[2]][i],1,TRUE)
a<-table.element(a,r$conf[1,i])
a<-table.element(a,r$stats[3,i])
a<-table.element(a,r$conf[2,i])
a<-table.row.end(a)
}
a<-table.end(a)
table.save(a,file='mytable1.tab')