Free Statistics

of Irreproducible Research!

Author's title

Author*The author of this computation has been verified*
R Software Modulerwasp_correlation.wasp
Title produced by softwarePearson Correlation
Date of computationWed, 04 Nov 2009 11:50:56 -0700
Cite this page as followsStatistical Computations at FreeStatistics.org, Office for Research Development and Education, URL https://freestatistics.org/blog/index.php?v=date/2009/Nov/04/t1257360708q550khl33hishxo.htm/, Retrieved Mon, 29 Apr 2024 16:03:33 +0000
Statistical Computations at FreeStatistics.org, Office for Research Development and Education, URL https://freestatistics.org/blog/index.php?pk=53799, Retrieved Mon, 29 Apr 2024 16:03:33 +0000
QR Codes:

Original text written by user:
IsPrivate?No (this computation is public)
User-defined keywords
Estimated Impact196
Family? (F = Feedback message, R = changed R code, M = changed R Module, P = changed Parameters, D = changed Data)
-     [Bivariate Explorative Data Analysis] [WS 5 - Bivariate ...] [2009-10-28 18:24:20] [b103a1dc147def8132c7f643ad8c8f84]
- RMP     [Pearson Correlation] [controle correlat...] [2009-11-04 18:50:56] [ea241b681aafed79da4b5b99fad98471] [Current]
Feedback Forum

Post a new message
Dataseries X:
-2,529152518
-2,982359944
-6,417831562
-1,888774797
-1,400095753
-3,082359944
-3,288774797
-3,535567371
-2,888774797
-0,350850128
-1,975000789
-2,992736598
-0,475000789
-2,510472407
-4,732170017
-0,805566304
-0,61688726
-1,072547738
-1,719340311
-2,490283547
-1,721793363
1,053111673
-0,131605569
-0,731605569
0,437828916
-1,720284613
-2,849341378
1,374809283
-0,213869761
0,982168438
-0,206510606
-0,93707612
-0,654811929
2,414622556
-1,370094686
0,625943512
1,28311274
-1,085377444
-2,290283547
0,991980645
1,267829983
1,474244836
-1,154811929
0,560470828
0,233867115
2,936320167
0,145188071
1,460470828
2,469338733
1,224999211
-0,790283547
1,433867115
3,922546159
2,48462149
-0,333114319
2,68462149
2,816131306
3,140281968
4,607263402
3,111225203
5,587074541
4,264432629
0,208772151
4,58462149
4,297451195
0,090092041
-1,035002923
-1,018211416
-0,414249615
1,018768951
-0,019155718
-0,454627335
1,698580091
Dataseries Y:
-3,713734268
-4,444217543
-6,064539727
-3,405184094
-2,354378635
-3,844217543
-3,105184094
-3,774700819
-3,405184094
-0,840747915
-2,711875557
-3,822036649
-0,611875557
-3,632197741
-3,859211388
-1,64396975
-1,493164292
-1,567761562
-1,237278287
-2,477922654
-1,681392282
0,47610464
-0,957848263
-1,357848263
0,310057544
-2,808653722
-2,168009355
0,303118287
-1,047687171
0,935460273
0,984654814
-0,047439379
-0,35760047
3,210305337
-1,123647567
0,359499878
0,806835708
-1,889694663
-1,277922654
0,411916254
1,040788612
1,201755163
-0,55760047
0,508446626
-0,006795012
2,237318984
-0,05760047
1,508446626
1,813527172
1,088124443
-0,377922654
1,093204988
3,944010447
3,079574268
1,469413177
4,179574268
2,783043897
4,154171539
5,377963351
3,494815906
6,223688264
4,825299181
2,350701911
5,679574268
5,40150737
1,869165384
0,426662306
-0,034552037
-0,417699482
1,058508706
-0,605927472
-1,126249656
1,304233619


Summary of computational transaction
Raw Inputview raw input (R code)
Raw Outputview raw output of R engine
Computing time1 seconds
R Server'Gwilym Jenkins' @ 72.249.127.135

\begin{tabular}{lllllllll}
\hline
Summary of computational transaction \tabularnewline
Raw Input & view raw input (R code)  \tabularnewline
Raw Output & view raw output of R engine  \tabularnewline
Computing time & 1 seconds \tabularnewline
R Server & 'Gwilym Jenkins' @ 72.249.127.135 \tabularnewline
\hline
\end{tabular}
%Source: https://freestatistics.org/blog/index.php?pk=53799&T=0

[TABLE]
[ROW][C]Summary of computational transaction[/C][/ROW]
[ROW][C]Raw Input[/C][C]view raw input (R code) [/C][/ROW]
[ROW][C]Raw Output[/C][C]view raw output of R engine [/C][/ROW]
[ROW][C]Computing time[/C][C]1 seconds[/C][/ROW]
[ROW][C]R Server[/C][C]'Gwilym Jenkins' @ 72.249.127.135[/C][/ROW]
[/TABLE]
Source: https://freestatistics.org/blog/index.php?pk=53799&T=0

Globally Unique Identifier (entire table): ba.freestatistics.org/blog/index.php?pk=53799&T=0

As an alternative you can also use a QR Code:  

The GUIDs for individual cells are displayed in the table below:

Summary of computational transaction
Raw Inputview raw input (R code)
Raw Outputview raw output of R engine
Computing time1 seconds
R Server'Gwilym Jenkins' @ 72.249.127.135


Pearson Product Moment Correlation - Ungrouped Data
StatisticVariable XVariable Y
Mean-1.36986369854982e-11-3.51548841407286e-18
Biased Variance5.385911945528156.95322149200836
Biased Standard Deviation2.320756761388012.63689618529216
Covariance5.92291844056477
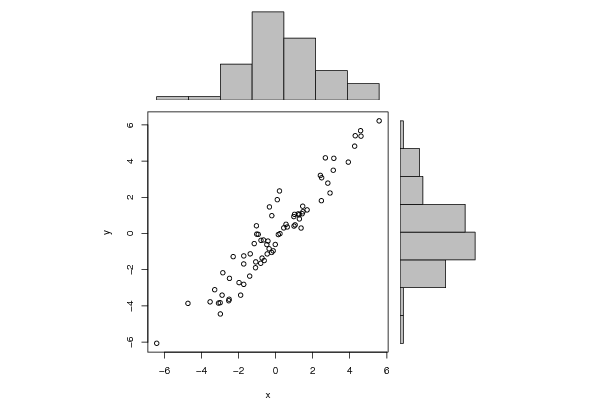
Correlation0.95460286253937
Determination0.91126662516836
T-Test27.0027755749401
p-value (2 sided)0
p-value (1 sided)0
Degrees of Freedom71
Number of Observations73

\begin{tabular}{lllllllll}
\hline
Pearson Product Moment Correlation - Ungrouped Data \tabularnewline
Statistic & Variable X & Variable Y \tabularnewline
Mean & -1.36986369854982e-11 & -3.51548841407286e-18 \tabularnewline
Biased Variance & 5.38591194552815 & 6.95322149200836 \tabularnewline
Biased Standard Deviation & 2.32075676138801 & 2.63689618529216 \tabularnewline
Covariance & 5.92291844056477 \tabularnewline
Correlation & 0.95460286253937 \tabularnewline
Determination & 0.91126662516836 \tabularnewline
T-Test & 27.0027755749401 \tabularnewline
p-value (2 sided) & 0 \tabularnewline
p-value (1 sided) & 0 \tabularnewline
Degrees of Freedom & 71 \tabularnewline
Number of Observations & 73 \tabularnewline
\hline
\end{tabular}
%Source: https://freestatistics.org/blog/index.php?pk=53799&T=1

[TABLE]
[ROW][C]Pearson Product Moment Correlation - Ungrouped Data[/C][/ROW]
[ROW][C]Statistic[/C][C]Variable X[/C][C]Variable Y[/C][/ROW]
[ROW][C]Mean[/C][C]-1.36986369854982e-11[/C][C]-3.51548841407286e-18[/C][/ROW]
[ROW][C]Biased Variance[/C][C]5.38591194552815[/C][C]6.95322149200836[/C][/ROW]
[ROW][C]Biased Standard Deviation[/C][C]2.32075676138801[/C][C]2.63689618529216[/C][/ROW]
[ROW][C]Covariance[/C][C]5.92291844056477[/C][/ROW]
[ROW][C]Correlation[/C][C]0.95460286253937[/C][/ROW]
[ROW][C]Determination[/C][C]0.91126662516836[/C][/ROW]
[ROW][C]T-Test[/C][C]27.0027755749401[/C][/ROW]
[ROW][C]p-value (2 sided)[/C][C]0[/C][/ROW]
[ROW][C]p-value (1 sided)[/C][C]0[/C][/ROW]
[ROW][C]Degrees of Freedom[/C][C]71[/C][/ROW]
[ROW][C]Number of Observations[/C][C]73[/C][/ROW]
[/TABLE]
Source: https://freestatistics.org/blog/index.php?pk=53799&T=1

Globally Unique Identifier (entire table): ba.freestatistics.org/blog/index.php?pk=53799&T=1

As an alternative you can also use a QR Code:  

The GUIDs for individual cells are displayed in the table below:

Pearson Product Moment Correlation - Ungrouped Data
StatisticVariable XVariable Y
Mean-1.36986369854982e-11-3.51548841407286e-18
Biased Variance5.385911945528156.95322149200836
Biased Standard Deviation2.320756761388012.63689618529216
Covariance5.92291844056477
Correlation0.95460286253937
Determination0.91126662516836
T-Test27.0027755749401
p-value (2 sided)0
p-value (1 sided)0
Degrees of Freedom71
Number of Observations73


Parameters (Session):
par1 = 0 ; par2 = 0 ;
Parameters (R input):
R code (references can be found in the software module):
bitmap(file='test1.png')
histx <- hist(x, plot=FALSE)
histy <- hist(y, plot=FALSE)
maxcounts <- max(c(histx$counts, histx$counts))
xrange <- c(min(x),max(x))
yrange <- c(min(y),max(y))
nf <- layout(matrix(c(2,0,1,3),2,2,byrow=TRUE), c(3,1), c(1,3), TRUE)
par(mar=c(4,4,1,1))
plot(x, y, xlim=xrange, ylim=yrange, xlab=xlab, ylab=ylab)
par(mar=c(0,4,1,1))
barplot(histx$counts, axes=FALSE, ylim=c(0, maxcounts), space=0)
par(mar=c(4,0,1,1))
barplot(histy$counts, axes=FALSE, xlim=c(0, maxcounts), space=0, horiz=TRUE)
dev.off()
lx = length(x)
makebiased = (lx-1)/lx
varx = var(x)*makebiased
vary = var(y)*makebiased
corxy <- cor.test(x,y,method='pearson')
cxy <- as.matrix(corxy$estimate)[1,1]
load(file='createtable')
a<-table.start()
a<-table.row.start(a)
a<-table.element(a,'Pearson Product Moment Correlation - Ungrouped Data',3,TRUE)
a<-table.row.end(a)
a<-table.row.start(a)
a<-table.element(a,'Statistic',1,TRUE)
a<-table.element(a,'Variable X',1,TRUE)
a<-table.element(a,'Variable Y',1,TRUE)
a<-table.row.end(a)
a<-table.row.start(a)
a<-table.element(a,hyperlink('arithmetic_mean.htm','Mean',''),header=TRUE)
a<-table.element(a,mean(x))
a<-table.element(a,mean(y))
a<-table.row.end(a)
a<-table.row.start(a)
a<-table.element(a,hyperlink('biased.htm','Biased Variance',''),header=TRUE)
a<-table.element(a,varx)
a<-table.element(a,vary)
a<-table.row.end(a)
a<-table.row.start(a)
a<-table.element(a,hyperlink('biased1.htm','Biased Standard Deviation',''),header=TRUE)
a<-table.element(a,sqrt(varx))
a<-table.element(a,sqrt(vary))
a<-table.row.end(a)
a<-table.row.start(a)
a<-table.element(a,hyperlink('covariance.htm','Covariance',''),header=TRUE)
a<-table.element(a,cov(x,y),2)
a<-table.row.end(a)
a<-table.row.start(a)
a<-table.element(a,hyperlink('pearson_correlation.htm','Correlation',''),header=TRUE)
a<-table.element(a,cxy,2)
a<-table.row.end(a)
a<-table.row.start(a)
a<-table.element(a,hyperlink('coeff_of_determination.htm','Determination',''),header=TRUE)
a<-table.element(a,cxy*cxy,2)
a<-table.row.end(a)
a<-table.row.start(a)
a<-table.element(a,hyperlink('ttest_statistic.htm','T-Test',''),header=TRUE)
a<-table.element(a,as.matrix(corxy$statistic)[1,1],2)
a<-table.row.end(a)
a<-table.row.start(a)
a<-table.element(a,'p-value (2 sided)',header=TRUE)
a<-table.element(a,(p2 <- as.matrix(corxy$p.value)[1,1]),2)
a<-table.row.end(a)
a<-table.row.start(a)
a<-table.element(a,'p-value (1 sided)',header=TRUE)
a<-table.element(a,p2/2,2)
a<-table.row.end(a)
a<-table.row.start(a)
a<-table.element(a,'Degrees of Freedom',header=TRUE)
a<-table.element(a,lx-2,2)
a<-table.row.end(a)
a<-table.row.start(a)
a<-table.element(a,'Number of Observations',header=TRUE)
a<-table.element(a,lx,2)
a<-table.row.end(a)
a<-table.end(a)
table.save(a,file='mytable.tab')