Free Statistics

of Irreproducible Research!

Author's title

Author*The author of this computation has been verified*
R Software Modulerwasp_correlation.wasp
Title produced by softwarePearson Correlation
Date of computationWed, 04 Nov 2009 12:40:54 -0700
Cite this page as followsStatistical Computations at FreeStatistics.org, Office for Research Development and Education, URL https://freestatistics.org/blog/index.php?v=date/2009/Nov/04/t12573637363bpzxe426eb5gsd.htm/, Retrieved Mon, 29 Apr 2024 10:09:07 +0000
Statistical Computations at FreeStatistics.org, Office for Research Development and Education, URL https://freestatistics.org/blog/index.php?pk=53828, Retrieved Mon, 29 Apr 2024 10:09:07 +0000
QR Codes:

Original text written by user:
IsPrivate?No (this computation is public)
User-defined keywords
Estimated Impact159
Family? (F = Feedback message, R = changed R code, M = changed R Module, P = changed Parameters, D = changed Data)
-     [Bivariate Explorative Data Analysis] [SHW] [2009-11-01 18:32:04] [a66d3a79ef9e5308cd94a469bc5ca464]
-    D  [Bivariate Explorative Data Analysis] [SHWWS5] [2009-11-01 19:10:15] [a66d3a79ef9e5308cd94a469bc5ca464]
- RMP       [Pearson Correlation] [correlatie uitgez...] [2009-11-04 19:40:54] [ea241b681aafed79da4b5b99fad98471] [Current]
Feedback Forum

Post a new message
Dataseries X:
-0,317563243
0,793263584
0,245684805
-0,027819099
0,072180901
0,414346267
0,893263584
0,366767488
0,245684805
0,666767488
1,004090411
1,204090411
1,283007729
0,356511632
0,330015536
0,956511632
1,01975968
0,998676998
0,314346267
0,651098219
0,893263584
0,572180901
0,788421142
0,688421142
0,183007729
-0,39648056
-0,307307387
-0,22839007
-0,586224705
-0,612720801
-0,844630311
-0,907878359
-1,57653982
-1,787366647
-1,26029958
-1,297051532
-1,434374455
-0,760870551
-0,229532013
0,075881401
0,539129449
0,512633353
1,143971891
0,822889208
1,569897016
2,375310429
2,960212132
2,460212132
2,307219939
1,522889208
-0,077110792
-0,324118599
-0,713291772
-0,807878359
-2,023547628
-1,881382262
-2,907878359
-3,518134214
-3,733232512
-2,669984464
Dataseries Y:
33,97260143
16,58856422
10,35739026
3,126967938
-1,873032062
-5,949839504
-10,41143578
-12,18101346
-16,64260974
-16,18101346
11,20452701
19,20452701
19,74293073
12,97335305
6,20377538
-2,026646945
-10,64185811
-12,10345439
-15,9498395
-17,33462834
-21,41143578
-19,87303206
4,050912124
10,05091212
11,74293073
6,434197706
0,818234915
-5,643361364
-5,720168806
-8,489746481
-8,56730555
-9,952094388
-12,64486462
-9,260827411
8,279079566
12,6638684
15,27832794
9,508750263
4,815980031
1,123961426
-0,491249737
-1,260827411
-2,953597644
-4,415193923
-6,954349272
-6,646367876
9,970346542
13,97034654
17,43119119
11,58480608
7,584806077
3,123961426
-0,260075783
-2,952094388
-6,105709271
-8,182516713
-12,95209439
-13,79772788
1,818986543
6,20377538


Summary of computational transaction
Raw Inputview raw input (R code)
Raw Outputview raw output of R engine
Computing time1 seconds
R Server'George Udny Yule' @ 72.249.76.132

\begin{tabular}{lllllllll}
\hline
Summary of computational transaction \tabularnewline
Raw Input & view raw input (R code)  \tabularnewline
Raw Output & view raw output of R engine  \tabularnewline
Computing time & 1 seconds \tabularnewline
R Server & 'George Udny Yule' @ 72.249.76.132 \tabularnewline
\hline
\end{tabular}
%Source: https://freestatistics.org/blog/index.php?pk=53828&T=0

[TABLE]
[ROW][C]Summary of computational transaction[/C][/ROW]
[ROW][C]Raw Input[/C][C]view raw input (R code) [/C][/ROW]
[ROW][C]Raw Output[/C][C]view raw output of R engine [/C][/ROW]
[ROW][C]Computing time[/C][C]1 seconds[/C][/ROW]
[ROW][C]R Server[/C][C]'George Udny Yule' @ 72.249.76.132[/C][/ROW]
[/TABLE]
Source: https://freestatistics.org/blog/index.php?pk=53828&T=0

Globally Unique Identifier (entire table): ba.freestatistics.org/blog/index.php?pk=53828&T=0

As an alternative you can also use a QR Code:  

The GUIDs for individual cells are displayed in the table below:

Summary of computational transaction
Raw Inputview raw input (R code)
Raw Outputview raw output of R engine
Computing time1 seconds
R Server'George Udny Yule' @ 72.249.76.132


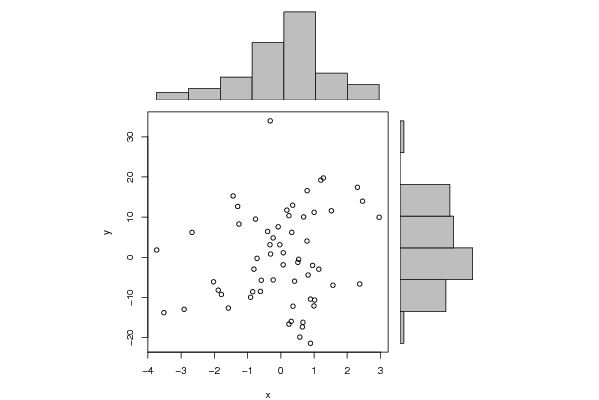
Pearson Product Moment Correlation - Ungrouped Data
StatisticVariable XVariable Y
Mean-1.66666737196642e-11-2.00000074603487e-10
Biased Variance1.84317785524209133.478689348773
Biased Standard Deviation1.3576368642763411.5532977694151
Covariance2.74587700403209
Correlation0.172144143611256
Determination0.0296336061796529
T-Test1.33087839686168
p-value (2 sided)0.188437413274869
p-value (1 sided)0.0942187066374347
Degrees of Freedom58
Number of Observations60

\begin{tabular}{lllllllll}
\hline
Pearson Product Moment Correlation - Ungrouped Data \tabularnewline
Statistic & Variable X & Variable Y \tabularnewline
Mean & -1.66666737196642e-11 & -2.00000074603487e-10 \tabularnewline
Biased Variance & 1.84317785524209 & 133.478689348773 \tabularnewline
Biased Standard Deviation & 1.35763686427634 & 11.5532977694151 \tabularnewline
Covariance & 2.74587700403209 \tabularnewline
Correlation & 0.172144143611256 \tabularnewline
Determination & 0.0296336061796529 \tabularnewline
T-Test & 1.33087839686168 \tabularnewline
p-value (2 sided) & 0.188437413274869 \tabularnewline
p-value (1 sided) & 0.0942187066374347 \tabularnewline
Degrees of Freedom & 58 \tabularnewline
Number of Observations & 60 \tabularnewline
\hline
\end{tabular}
%Source: https://freestatistics.org/blog/index.php?pk=53828&T=1

[TABLE]
[ROW][C]Pearson Product Moment Correlation - Ungrouped Data[/C][/ROW]
[ROW][C]Statistic[/C][C]Variable X[/C][C]Variable Y[/C][/ROW]
[ROW][C]Mean[/C][C]-1.66666737196642e-11[/C][C]-2.00000074603487e-10[/C][/ROW]
[ROW][C]Biased Variance[/C][C]1.84317785524209[/C][C]133.478689348773[/C][/ROW]
[ROW][C]Biased Standard Deviation[/C][C]1.35763686427634[/C][C]11.5532977694151[/C][/ROW]
[ROW][C]Covariance[/C][C]2.74587700403209[/C][/ROW]
[ROW][C]Correlation[/C][C]0.172144143611256[/C][/ROW]
[ROW][C]Determination[/C][C]0.0296336061796529[/C][/ROW]
[ROW][C]T-Test[/C][C]1.33087839686168[/C][/ROW]
[ROW][C]p-value (2 sided)[/C][C]0.188437413274869[/C][/ROW]
[ROW][C]p-value (1 sided)[/C][C]0.0942187066374347[/C][/ROW]
[ROW][C]Degrees of Freedom[/C][C]58[/C][/ROW]
[ROW][C]Number of Observations[/C][C]60[/C][/ROW]
[/TABLE]
Source: https://freestatistics.org/blog/index.php?pk=53828&T=1

Globally Unique Identifier (entire table): ba.freestatistics.org/blog/index.php?pk=53828&T=1

As an alternative you can also use a QR Code:  

The GUIDs for individual cells are displayed in the table below:

Pearson Product Moment Correlation - Ungrouped Data
StatisticVariable XVariable Y
Mean-1.66666737196642e-11-2.00000074603487e-10
Biased Variance1.84317785524209133.478689348773
Biased Standard Deviation1.3576368642763411.5532977694151
Covariance2.74587700403209
Correlation0.172144143611256
Determination0.0296336061796529
T-Test1.33087839686168
p-value (2 sided)0.188437413274869
p-value (1 sided)0.0942187066374347
Degrees of Freedom58
Number of Observations60


Parameters (Session):
par1 = 0 ; par2 = 0 ;
Parameters (R input):
R code (references can be found in the software module):
bitmap(file='test1.png')
histx <- hist(x, plot=FALSE)
histy <- hist(y, plot=FALSE)
maxcounts <- max(c(histx$counts, histx$counts))
xrange <- c(min(x),max(x))
yrange <- c(min(y),max(y))
nf <- layout(matrix(c(2,0,1,3),2,2,byrow=TRUE), c(3,1), c(1,3), TRUE)
par(mar=c(4,4,1,1))
plot(x, y, xlim=xrange, ylim=yrange, xlab=xlab, ylab=ylab)
par(mar=c(0,4,1,1))
barplot(histx$counts, axes=FALSE, ylim=c(0, maxcounts), space=0)
par(mar=c(4,0,1,1))
barplot(histy$counts, axes=FALSE, xlim=c(0, maxcounts), space=0, horiz=TRUE)
dev.off()
lx = length(x)
makebiased = (lx-1)/lx
varx = var(x)*makebiased
vary = var(y)*makebiased
corxy <- cor.test(x,y,method='pearson')
cxy <- as.matrix(corxy$estimate)[1,1]
load(file='createtable')
a<-table.start()
a<-table.row.start(a)
a<-table.element(a,'Pearson Product Moment Correlation - Ungrouped Data',3,TRUE)
a<-table.row.end(a)
a<-table.row.start(a)
a<-table.element(a,'Statistic',1,TRUE)
a<-table.element(a,'Variable X',1,TRUE)
a<-table.element(a,'Variable Y',1,TRUE)
a<-table.row.end(a)
a<-table.row.start(a)
a<-table.element(a,hyperlink('arithmetic_mean.htm','Mean',''),header=TRUE)
a<-table.element(a,mean(x))
a<-table.element(a,mean(y))
a<-table.row.end(a)
a<-table.row.start(a)
a<-table.element(a,hyperlink('biased.htm','Biased Variance',''),header=TRUE)
a<-table.element(a,varx)
a<-table.element(a,vary)
a<-table.row.end(a)
a<-table.row.start(a)
a<-table.element(a,hyperlink('biased1.htm','Biased Standard Deviation',''),header=TRUE)
a<-table.element(a,sqrt(varx))
a<-table.element(a,sqrt(vary))
a<-table.row.end(a)
a<-table.row.start(a)
a<-table.element(a,hyperlink('covariance.htm','Covariance',''),header=TRUE)
a<-table.element(a,cov(x,y),2)
a<-table.row.end(a)
a<-table.row.start(a)
a<-table.element(a,hyperlink('pearson_correlation.htm','Correlation',''),header=TRUE)
a<-table.element(a,cxy,2)
a<-table.row.end(a)
a<-table.row.start(a)
a<-table.element(a,hyperlink('coeff_of_determination.htm','Determination',''),header=TRUE)
a<-table.element(a,cxy*cxy,2)
a<-table.row.end(a)
a<-table.row.start(a)
a<-table.element(a,hyperlink('ttest_statistic.htm','T-Test',''),header=TRUE)
a<-table.element(a,as.matrix(corxy$statistic)[1,1],2)
a<-table.row.end(a)
a<-table.row.start(a)
a<-table.element(a,'p-value (2 sided)',header=TRUE)
a<-table.element(a,(p2 <- as.matrix(corxy$p.value)[1,1]),2)
a<-table.row.end(a)
a<-table.row.start(a)
a<-table.element(a,'p-value (1 sided)',header=TRUE)
a<-table.element(a,p2/2,2)
a<-table.row.end(a)
a<-table.row.start(a)
a<-table.element(a,'Degrees of Freedom',header=TRUE)
a<-table.element(a,lx-2,2)
a<-table.row.end(a)
a<-table.row.start(a)
a<-table.element(a,'Number of Observations',header=TRUE)
a<-table.element(a,lx,2)
a<-table.row.end(a)
a<-table.end(a)
table.save(a,file='mytable.tab')