Free Statistics

of Irreproducible Research!

Author's title

Author*The author of this computation has been verified*
R Software Modulerwasp_correlation.wasp
Title produced by softwarePearson Correlation
Date of computationWed, 04 Nov 2009 13:35:29 -0700
Cite this page as followsStatistical Computations at FreeStatistics.org, Office for Research Development and Education, URL https://freestatistics.org/blog/index.php?v=date/2009/Nov/04/t1257366997v4kipzn7li6ensf.htm/, Retrieved Mon, 29 Apr 2024 10:14:53 +0000
Statistical Computations at FreeStatistics.org, Office for Research Development and Education, URL https://freestatistics.org/blog/index.php?pk=53845, Retrieved Mon, 29 Apr 2024 10:14:53 +0000
QR Codes:

Original text written by user:
IsPrivate?No (this computation is public)
User-defined keywordsSDHW, DSHW
Estimated Impact115
Family? (F = Feedback message, R = changed R code, M = changed R Module, P = changed Parameters, D = changed Data)
-       [Pearson Correlation] [DSHW-WS5-PearsonC...] [2009-11-04 20:35:29] [36295456a56d4c7dcc9b9537ce63463b] [Current]
Feedback Forum

Post a new message
Dataseries X:
103,974
102,114
87,696
76,096
77,024
81,43
83,248
81,43
75,276
72,738
71,732
87,548
90,306
89,436
82,28
77,952
79,73
82,476
82,476
79,808
77,18
75,364
72,64
81,016
81,648
80,028
75,04
71,732
71,732
73,44
73,44
72,522
74,24
68,376
60,336
63,6
59,714
54,46
55,86
55,86
58,176
58,254
54,528
48,824
44,032
40,138
45,37
63,756
69,362
62,85
55,062
50,028
54,372
64,526
67,84
66,24
59,906
53,144
54,612
66,258
71,214
Dataseries Y:
59,892
60,822
53,418
48,708
50,132
53,04
53,664
53,04
48,708
48,114
43,766
51,084
51,678
52,548
52,19
51,576
53,89
56,898
57,768
57,104
56,44
52,622
45,92
43,788
40,824
41,634
42,72
42,976
43,766
45,12
44,32
42,186
43,52
40,348
34,848
38,55
36,792
33,88
33,18
32,48
35,568
38,252
37,204
32,912
29,056
25,864
29,51
43,428
45,346
40,05
31,326
27,984
32,016
42,658
49,12
50,72
47,278
42,632
43,956
52,164
54,282


Summary of computational transaction
Raw Inputview raw input (R code)
Raw Outputview raw output of R engine
Computing time1 seconds
R Server'RServer@AstonUniversity' @ vre.aston.ac.uk

\begin{tabular}{lllllllll}
\hline
Summary of computational transaction \tabularnewline
Raw Input & view raw input (R code)  \tabularnewline
Raw Output & view raw output of R engine  \tabularnewline
Computing time & 1 seconds \tabularnewline
R Server & 'RServer@AstonUniversity' @ vre.aston.ac.uk \tabularnewline
\hline
\end{tabular}
%Source: https://freestatistics.org/blog/index.php?pk=53845&T=0

[TABLE]
[ROW][C]Summary of computational transaction[/C][/ROW]
[ROW][C]Raw Input[/C][C]view raw input (R code) [/C][/ROW]
[ROW][C]Raw Output[/C][C]view raw output of R engine [/C][/ROW]
[ROW][C]Computing time[/C][C]1 seconds[/C][/ROW]
[ROW][C]R Server[/C][C]'RServer@AstonUniversity' @ vre.aston.ac.uk[/C][/ROW]
[/TABLE]
Source: https://freestatistics.org/blog/index.php?pk=53845&T=0

Globally Unique Identifier (entire table): ba.freestatistics.org/blog/index.php?pk=53845&T=0

As an alternative you can also use a QR Code:  

The GUIDs for individual cells are displayed in the table below:

Summary of computational transaction
Raw Inputview raw input (R code)
Raw Outputview raw output of R engine
Computing time1 seconds
R Server'RServer@AstonUniversity' @ vre.aston.ac.uk


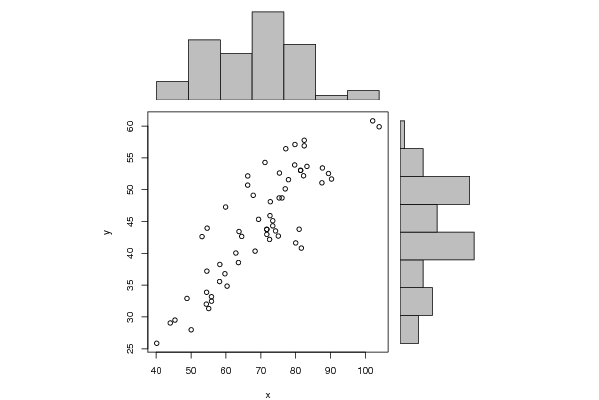
Pearson Product Moment Correlation - Ungrouped Data
StatisticVariable XVariable Y
Mean70.024426229508244.6767213114754
Biased Variance181.39479660521474.4815176436442
Biased Standard Deviation13.46828855516598.6302675302475
Covariance101.018873154098
Correlation0.854844779808507
Determination0.730759597565855
T-Test12.6544465066255
p-value (2 sided)0
p-value (1 sided)0
Degrees of Freedom59
Number of Observations61

\begin{tabular}{lllllllll}
\hline
Pearson Product Moment Correlation - Ungrouped Data \tabularnewline
Statistic & Variable X & Variable Y \tabularnewline
Mean & 70.0244262295082 & 44.6767213114754 \tabularnewline
Biased Variance & 181.394796605214 & 74.4815176436442 \tabularnewline
Biased Standard Deviation & 13.4682885551659 & 8.6302675302475 \tabularnewline
Covariance & 101.018873154098 \tabularnewline
Correlation & 0.854844779808507 \tabularnewline
Determination & 0.730759597565855 \tabularnewline
T-Test & 12.6544465066255 \tabularnewline
p-value (2 sided) & 0 \tabularnewline
p-value (1 sided) & 0 \tabularnewline
Degrees of Freedom & 59 \tabularnewline
Number of Observations & 61 \tabularnewline
\hline
\end{tabular}
%Source: https://freestatistics.org/blog/index.php?pk=53845&T=1

[TABLE]
[ROW][C]Pearson Product Moment Correlation - Ungrouped Data[/C][/ROW]
[ROW][C]Statistic[/C][C]Variable X[/C][C]Variable Y[/C][/ROW]
[ROW][C]Mean[/C][C]70.0244262295082[/C][C]44.6767213114754[/C][/ROW]
[ROW][C]Biased Variance[/C][C]181.394796605214[/C][C]74.4815176436442[/C][/ROW]
[ROW][C]Biased Standard Deviation[/C][C]13.4682885551659[/C][C]8.6302675302475[/C][/ROW]
[ROW][C]Covariance[/C][C]101.018873154098[/C][/ROW]
[ROW][C]Correlation[/C][C]0.854844779808507[/C][/ROW]
[ROW][C]Determination[/C][C]0.730759597565855[/C][/ROW]
[ROW][C]T-Test[/C][C]12.6544465066255[/C][/ROW]
[ROW][C]p-value (2 sided)[/C][C]0[/C][/ROW]
[ROW][C]p-value (1 sided)[/C][C]0[/C][/ROW]
[ROW][C]Degrees of Freedom[/C][C]59[/C][/ROW]
[ROW][C]Number of Observations[/C][C]61[/C][/ROW]
[/TABLE]
Source: https://freestatistics.org/blog/index.php?pk=53845&T=1

Globally Unique Identifier (entire table): ba.freestatistics.org/blog/index.php?pk=53845&T=1

As an alternative you can also use a QR Code:  

The GUIDs for individual cells are displayed in the table below:

Pearson Product Moment Correlation - Ungrouped Data
StatisticVariable XVariable Y
Mean70.024426229508244.6767213114754
Biased Variance181.39479660521474.4815176436442
Biased Standard Deviation13.46828855516598.6302675302475
Covariance101.018873154098
Correlation0.854844779808507
Determination0.730759597565855
T-Test12.6544465066255
p-value (2 sided)0
p-value (1 sided)0
Degrees of Freedom59
Number of Observations61


Parameters (Session):
Parameters (R input):
R code (references can be found in the software module):
bitmap(file='test1.png')
histx <- hist(x, plot=FALSE)
histy <- hist(y, plot=FALSE)
maxcounts <- max(c(histx$counts, histx$counts))
xrange <- c(min(x),max(x))
yrange <- c(min(y),max(y))
nf <- layout(matrix(c(2,0,1,3),2,2,byrow=TRUE), c(3,1), c(1,3), TRUE)
par(mar=c(4,4,1,1))
plot(x, y, xlim=xrange, ylim=yrange, xlab=xlab, ylab=ylab)
par(mar=c(0,4,1,1))
barplot(histx$counts, axes=FALSE, ylim=c(0, maxcounts), space=0)
par(mar=c(4,0,1,1))
barplot(histy$counts, axes=FALSE, xlim=c(0, maxcounts), space=0, horiz=TRUE)
dev.off()
lx = length(x)
makebiased = (lx-1)/lx
varx = var(x)*makebiased
vary = var(y)*makebiased
corxy <- cor.test(x,y,method='pearson')
cxy <- as.matrix(corxy$estimate)[1,1]
load(file='createtable')
a<-table.start()
a<-table.row.start(a)
a<-table.element(a,'Pearson Product Moment Correlation - Ungrouped Data',3,TRUE)
a<-table.row.end(a)
a<-table.row.start(a)
a<-table.element(a,'Statistic',1,TRUE)
a<-table.element(a,'Variable X',1,TRUE)
a<-table.element(a,'Variable Y',1,TRUE)
a<-table.row.end(a)
a<-table.row.start(a)
a<-table.element(a,hyperlink('arithmetic_mean.htm','Mean',''),header=TRUE)
a<-table.element(a,mean(x))
a<-table.element(a,mean(y))
a<-table.row.end(a)
a<-table.row.start(a)
a<-table.element(a,hyperlink('biased.htm','Biased Variance',''),header=TRUE)
a<-table.element(a,varx)
a<-table.element(a,vary)
a<-table.row.end(a)
a<-table.row.start(a)
a<-table.element(a,hyperlink('biased1.htm','Biased Standard Deviation',''),header=TRUE)
a<-table.element(a,sqrt(varx))
a<-table.element(a,sqrt(vary))
a<-table.row.end(a)
a<-table.row.start(a)
a<-table.element(a,hyperlink('covariance.htm','Covariance',''),header=TRUE)
a<-table.element(a,cov(x,y),2)
a<-table.row.end(a)
a<-table.row.start(a)
a<-table.element(a,hyperlink('pearson_correlation.htm','Correlation',''),header=TRUE)
a<-table.element(a,cxy,2)
a<-table.row.end(a)
a<-table.row.start(a)
a<-table.element(a,hyperlink('coeff_of_determination.htm','Determination',''),header=TRUE)
a<-table.element(a,cxy*cxy,2)
a<-table.row.end(a)
a<-table.row.start(a)
a<-table.element(a,hyperlink('ttest_statistic.htm','T-Test',''),header=TRUE)
a<-table.element(a,as.matrix(corxy$statistic)[1,1],2)
a<-table.row.end(a)
a<-table.row.start(a)
a<-table.element(a,'p-value (2 sided)',header=TRUE)
a<-table.element(a,(p2 <- as.matrix(corxy$p.value)[1,1]),2)
a<-table.row.end(a)
a<-table.row.start(a)
a<-table.element(a,'p-value (1 sided)',header=TRUE)
a<-table.element(a,p2/2,2)
a<-table.row.end(a)
a<-table.row.start(a)
a<-table.element(a,'Degrees of Freedom',header=TRUE)
a<-table.element(a,lx-2,2)
a<-table.row.end(a)
a<-table.row.start(a)
a<-table.element(a,'Number of Observations',header=TRUE)
a<-table.element(a,lx,2)
a<-table.row.end(a)
a<-table.end(a)
table.save(a,file='mytable.tab')