Free Statistics

of Irreproducible Research!

Author's title

Author*The author of this computation has been verified*
R Software Modulerwasp_correlation.wasp
Title produced by softwarePearson Correlation
Date of computationFri, 06 Nov 2009 02:46:42 -0700
Cite this page as followsStatistical Computations at FreeStatistics.org, Office for Research Development and Education, URL https://freestatistics.org/blog/index.php?v=date/2009/Nov/06/t12575008411cnenri8sr5usc0.htm/, Retrieved Sun, 28 Apr 2024 11:30:38 +0000
Statistical Computations at FreeStatistics.org, Office for Research Development and Education, URL https://freestatistics.org/blog/index.php?pk=54234, Retrieved Sun, 28 Apr 2024 11:30:38 +0000
QR Codes:

Original text written by user:
IsPrivate?No (this computation is public)
User-defined keywords
Estimated Impact156
Family? (F = Feedback message, R = changed R code, M = changed R Module, P = changed Parameters, D = changed Data)
-     [Bivariate Explorative Data Analysis] [Workshop 5] [2009-11-04 18:34:52] [4fe1472705bb0a32f118ba3ca90ffa8e]
- RMPD    [Pearson Correlation] [SHWWS5review2] [2009-11-06 09:46:42] [db49399df1e4a3dbe31268849cebfd7f] [Current]
Feedback Forum

Post a new message
Dataseries X:
-203.7281445
-196.9726865
-200.1506505
-210.2286145
-227.7644485
-237.2983405
-253.9913085
-241.3963985
-228.0971345
-237.3109325
-224.9140805
-268.2554745
-261.5617705
-255.7862185
-275.3728905
-311.2430865
-341.7372605
-359.0081925
-367.5345825
-435.1730325
-538.9686165
-461.3408165
-496.8153665
-527.5102765
-521.4649985
-531.7308405
-522.8233385
-535.0308405
-504.9279585
-506.8039805
-548.4584365
-603.5787345
-621.9315145
-574.0368705
-575.6959465
-540.1453745
-530.8674105
-544.6785305
-490.7492585
-456.9609105
-496.5877705
-545.7175125
-595.7901205
-583.8247485
-549.3199245
-535.2332525
-538.5218665
-493.5669405
-447.9817405
-290.5399385
-222.1932505
-176.5930465
-193.1584185
-186.7603605
-201.9533285
-243.8499145
-265.3850125
-299.7941905
-315.8387325
-391.1181065
-392.8294925
Dataseries Y:
-168.2281445
-192.0726865
-201.9506505
-185.3286145
-213.8644485
-230.8983405
-216.2913085
-206.3963985
-192.8971345
-205.3109325
-211.4140805
-227.6554745
-206.6617705
-222.6862185
-248.7728905
-274.7430865
-326.1372605
-348.8081925
-338.4345825
-409.9730325
-493.5686165
-437.6408165
-462.6153665
-473.8102765
-429.9649985
-475.4308405
-454.0233385
-432.7308405
-466.4279585
-467.8039805
-484.7584365
-541.9787345
-548.9315145
-533.1368705
-523.8959465
-472.0453745
-447.3674105
-490.4785305
-432.1492585
-379.1609105
-430.2877705
-540.0175125
-537.7901205
-533.7247485
-511.1199245
-524.0332525
-504.8218665
-430.8669405
-381.5817405
-223.7399385
-166.8932505
-86.49304654
-51.05841854
-143.5603605
-117.5533285
-151.8499145
-211.0850125
-272.8941905
-295.3387325
-365.2181065
-351.6294925


Summary of computational transaction
Raw Inputview raw input (R code)
Raw Outputview raw output of R engine
Computing time2 seconds
R Server'Sir Ronald Aylmer Fisher' @ 193.190.124.24

\begin{tabular}{lllllllll}
\hline
Summary of computational transaction \tabularnewline
Raw Input & view raw input (R code)  \tabularnewline
Raw Output & view raw output of R engine  \tabularnewline
Computing time & 2 seconds \tabularnewline
R Server & 'Sir Ronald Aylmer Fisher' @ 193.190.124.24 \tabularnewline
\hline
\end{tabular}
%Source: https://freestatistics.org/blog/index.php?pk=54234&T=0

[TABLE]
[ROW][C]Summary of computational transaction[/C][/ROW]
[ROW][C]Raw Input[/C][C]view raw input (R code) [/C][/ROW]
[ROW][C]Raw Output[/C][C]view raw output of R engine [/C][/ROW]
[ROW][C]Computing time[/C][C]2 seconds[/C][/ROW]
[ROW][C]R Server[/C][C]'Sir Ronald Aylmer Fisher' @ 193.190.124.24[/C][/ROW]
[/TABLE]
Source: https://freestatistics.org/blog/index.php?pk=54234&T=0

Globally Unique Identifier (entire table): ba.freestatistics.org/blog/index.php?pk=54234&T=0

As an alternative you can also use a QR Code:  

The GUIDs for individual cells are displayed in the table below:

Summary of computational transaction
Raw Inputview raw input (R code)
Raw Outputview raw output of R engine
Computing time2 seconds
R Server'Sir Ronald Aylmer Fisher' @ 193.190.124.24


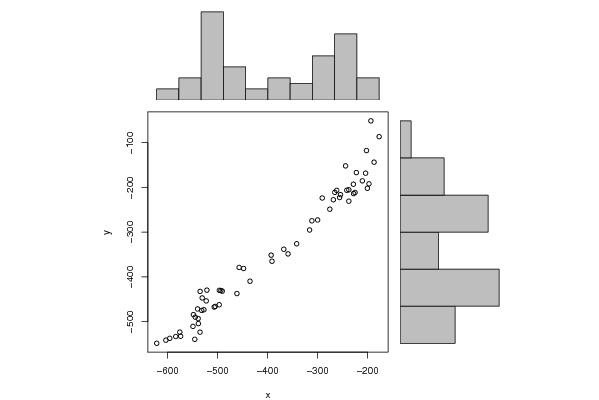
Pearson Product Moment Correlation - Ungrouped Data
StatisticVariable XVariable Y
Mean-392.436113713115-346.032835025902
Biased Variance20712.624277392519993.678997071
Biased Standard Deviation143.918811409046141.399006351074
Covariance20320.6155034097
Correlation0.982187386715506
Determination0.964692062623034
T-Test40.149873806924
p-value (2 sided)0
p-value (1 sided)0
Degrees of Freedom59
Number of Observations61

\begin{tabular}{lllllllll}
\hline
Pearson Product Moment Correlation - Ungrouped Data \tabularnewline
Statistic & Variable X & Variable Y \tabularnewline
Mean & -392.436113713115 & -346.032835025902 \tabularnewline
Biased Variance & 20712.6242773925 & 19993.678997071 \tabularnewline
Biased Standard Deviation & 143.918811409046 & 141.399006351074 \tabularnewline
Covariance & 20320.6155034097 \tabularnewline
Correlation & 0.982187386715506 \tabularnewline
Determination & 0.964692062623034 \tabularnewline
T-Test & 40.149873806924 \tabularnewline
p-value (2 sided) & 0 \tabularnewline
p-value (1 sided) & 0 \tabularnewline
Degrees of Freedom & 59 \tabularnewline
Number of Observations & 61 \tabularnewline
\hline
\end{tabular}
%Source: https://freestatistics.org/blog/index.php?pk=54234&T=1

[TABLE]
[ROW][C]Pearson Product Moment Correlation - Ungrouped Data[/C][/ROW]
[ROW][C]Statistic[/C][C]Variable X[/C][C]Variable Y[/C][/ROW]
[ROW][C]Mean[/C][C]-392.436113713115[/C][C]-346.032835025902[/C][/ROW]
[ROW][C]Biased Variance[/C][C]20712.6242773925[/C][C]19993.678997071[/C][/ROW]
[ROW][C]Biased Standard Deviation[/C][C]143.918811409046[/C][C]141.399006351074[/C][/ROW]
[ROW][C]Covariance[/C][C]20320.6155034097[/C][/ROW]
[ROW][C]Correlation[/C][C]0.982187386715506[/C][/ROW]
[ROW][C]Determination[/C][C]0.964692062623034[/C][/ROW]
[ROW][C]T-Test[/C][C]40.149873806924[/C][/ROW]
[ROW][C]p-value (2 sided)[/C][C]0[/C][/ROW]
[ROW][C]p-value (1 sided)[/C][C]0[/C][/ROW]
[ROW][C]Degrees of Freedom[/C][C]59[/C][/ROW]
[ROW][C]Number of Observations[/C][C]61[/C][/ROW]
[/TABLE]
Source: https://freestatistics.org/blog/index.php?pk=54234&T=1

Globally Unique Identifier (entire table): ba.freestatistics.org/blog/index.php?pk=54234&T=1

As an alternative you can also use a QR Code:  

The GUIDs for individual cells are displayed in the table below:

Pearson Product Moment Correlation - Ungrouped Data
StatisticVariable XVariable Y
Mean-392.436113713115-346.032835025902
Biased Variance20712.624277392519993.678997071
Biased Standard Deviation143.918811409046141.399006351074
Covariance20320.6155034097
Correlation0.982187386715506
Determination0.964692062623034
T-Test40.149873806924
p-value (2 sided)0
p-value (1 sided)0
Degrees of Freedom59
Number of Observations61


Parameters (Session):
Parameters (R input):
R code (references can be found in the software module):
bitmap(file='test1.png')
histx <- hist(x, plot=FALSE)
histy <- hist(y, plot=FALSE)
maxcounts <- max(c(histx$counts, histx$counts))
xrange <- c(min(x),max(x))
yrange <- c(min(y),max(y))
nf <- layout(matrix(c(2,0,1,3),2,2,byrow=TRUE), c(3,1), c(1,3), TRUE)
par(mar=c(4,4,1,1))
plot(x, y, xlim=xrange, ylim=yrange, xlab=xlab, ylab=ylab)
par(mar=c(0,4,1,1))
barplot(histx$counts, axes=FALSE, ylim=c(0, maxcounts), space=0)
par(mar=c(4,0,1,1))
barplot(histy$counts, axes=FALSE, xlim=c(0, maxcounts), space=0, horiz=TRUE)
dev.off()
lx = length(x)
makebiased = (lx-1)/lx
varx = var(x)*makebiased
vary = var(y)*makebiased
corxy <- cor.test(x,y,method='pearson')
cxy <- as.matrix(corxy$estimate)[1,1]
load(file='createtable')
a<-table.start()
a<-table.row.start(a)
a<-table.element(a,'Pearson Product Moment Correlation - Ungrouped Data',3,TRUE)
a<-table.row.end(a)
a<-table.row.start(a)
a<-table.element(a,'Statistic',1,TRUE)
a<-table.element(a,'Variable X',1,TRUE)
a<-table.element(a,'Variable Y',1,TRUE)
a<-table.row.end(a)
a<-table.row.start(a)
a<-table.element(a,hyperlink('arithmetic_mean.htm','Mean',''),header=TRUE)
a<-table.element(a,mean(x))
a<-table.element(a,mean(y))
a<-table.row.end(a)
a<-table.row.start(a)
a<-table.element(a,hyperlink('biased.htm','Biased Variance',''),header=TRUE)
a<-table.element(a,varx)
a<-table.element(a,vary)
a<-table.row.end(a)
a<-table.row.start(a)
a<-table.element(a,hyperlink('biased1.htm','Biased Standard Deviation',''),header=TRUE)
a<-table.element(a,sqrt(varx))
a<-table.element(a,sqrt(vary))
a<-table.row.end(a)
a<-table.row.start(a)
a<-table.element(a,hyperlink('covariance.htm','Covariance',''),header=TRUE)
a<-table.element(a,cov(x,y),2)
a<-table.row.end(a)
a<-table.row.start(a)
a<-table.element(a,hyperlink('pearson_correlation.htm','Correlation',''),header=TRUE)
a<-table.element(a,cxy,2)
a<-table.row.end(a)
a<-table.row.start(a)
a<-table.element(a,hyperlink('coeff_of_determination.htm','Determination',''),header=TRUE)
a<-table.element(a,cxy*cxy,2)
a<-table.row.end(a)
a<-table.row.start(a)
a<-table.element(a,hyperlink('ttest_statistic.htm','T-Test',''),header=TRUE)
a<-table.element(a,as.matrix(corxy$statistic)[1,1],2)
a<-table.row.end(a)
a<-table.row.start(a)
a<-table.element(a,'p-value (2 sided)',header=TRUE)
a<-table.element(a,(p2 <- as.matrix(corxy$p.value)[1,1]),2)
a<-table.row.end(a)
a<-table.row.start(a)
a<-table.element(a,'p-value (1 sided)',header=TRUE)
a<-table.element(a,p2/2,2)
a<-table.row.end(a)
a<-table.row.start(a)
a<-table.element(a,'Degrees of Freedom',header=TRUE)
a<-table.element(a,lx-2,2)
a<-table.row.end(a)
a<-table.row.start(a)
a<-table.element(a,'Number of Observations',header=TRUE)
a<-table.element(a,lx,2)
a<-table.row.end(a)
a<-table.end(a)
table.save(a,file='mytable.tab')