Free Statistics

of Irreproducible Research!

Author's title

Author*Unverified author*
R Software Modulerwasp_notchedbox1.wasp
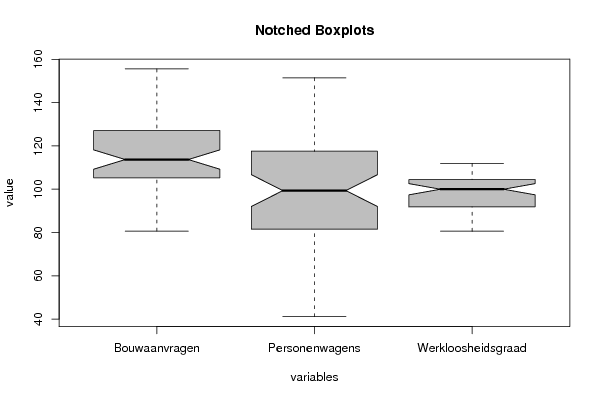
Title produced by softwareNotched Boxplots
Date of computationFri, 06 Nov 2009 03:21:50 -0700
Cite this page as followsStatistical Computations at FreeStatistics.org, Office for Research Development and Education, URL https://freestatistics.org/blog/index.php?v=date/2009/Nov/06/t1257502986edlay7bv21u6ihn.htm/, Retrieved Sun, 28 Apr 2024 09:29:30 +0000
Statistical Computations at FreeStatistics.org, Office for Research Development and Education, URL https://freestatistics.org/blog/index.php?pk=54237, Retrieved Sun, 28 Apr 2024 09:29:30 +0000
QR Codes:

Original text written by user:
IsPrivate?No (this computation is public)
User-defined keywords
Estimated Impact170
Family? (F = Feedback message, R = changed R code, M = changed R Module, P = changed Parameters, D = changed Data)
-     [Notched Boxplots] [3/11/2009] [2009-11-02 21:10:41] [b98453cac15ba1066b407e146608df68]
-    D    [Notched Boxplots] [WS6] [2009-11-06 10:21:50] [9a1fef436e1d399a5ecd6808bfbd8489] [Current]
Feedback Forum

Post a new message
Dataseries X:
100	100	100
95,84395716	70,97269774	97,01492537
105,5073942	60,60486349	92,53731343
118,1540031	130,554824	92,53731343
101,8612953	112,3299096	97,01492537
109,8419174	127,7148626	101,4925373
105,6348802	116,2408919	101,4925373
112,927078	98,34079536	97,01492537
133,0698623	118,7077517	88,05970149
125,6756757	78,87806163	82,08955224
146,736359	82,21402862	83,58208955
142,5803162	86,40154508	89,55223881
106,1448241	86,84487753	94,02985075
126,5170831	81,11228163	92,53731343
132,7893932	46,95812484	83,58208955
121,2391637	140,2686331	80,59701493
114,5079041	129,514529	85,07462687
146,1499235	151,4616803	88,05970149
146,1244263	119,2388728	92,53731343
128,5058644	117,3558072	94,02985075
155,5838858	103,9899921	91,04477612
125,0382458	79,69888508	88,05970149
136,8944416	76,06004741	88,05970149
142,2233554	79,90957774	85,07462687
117,7715451	92,15608814	88,05970149
120,627231	76,29707664	91,04477612
127,7664457	41,11579317	91,04477612
135,1096379	136,6166272	97,01492537
105,7113717	116,5437626	101,4925373
117,9245283	134,5404267	101,4925373
120,754717	113,5062769	102,9850746
107,572667	110,1746993	102,9850746
130,4436512	113,150733	101,4925373
107,2157063	89,62338688	98,50746269
105,0739419	82,02967255	97,01492537
130,1121877	89,64972347	97,01492537
109,6379398	108,7525239	97,01492537
116,7261601	86,97217101	100
97,11881693	55,91256255	104,4776119
140,8975013	138,5567553	108,9552239
108,2865885	132,1701343	111,9402985
97,65425803	131,7663067	111,9402985
112,0346762	140,1720657	111,9402985
123,0494646	113,3614257	108,9552239
112,4171341	117,7903608	105,9701493
116,4966854	88,68843824	102,9850746
104,6914839	78,08357475	104,4776119
122,2335543	90,07110877	105,9701493
99,79602244	98,84119041	107,4626866
96,71086181	68,35220788	105,9701493
112,3151453	50,51795277	101,4925373
102,5497195	111,6978316	102,9850746
104,5385008	105,7413748	102,9850746
122,0805711	121,964709	108,9552239
80,64762876	114,9811254	110,4477612
91,40744518	90,05355105	107,4626866
99,51555329	99,8990431	102,9850746
106,527282	83,52207883	101,4925373
98,49566548	74,49302081	105,9701493
106,7567568	87,94662453	110,4477612


Summary of computational transaction
Raw Inputview raw input (R code)
Raw Outputview raw output of R engine
Computing time2 seconds
R Server'RServer@AstonUniversity' @ vre.aston.ac.uk

\begin{tabular}{lllllllll}
\hline
Summary of computational transaction \tabularnewline
Raw Input & view raw input (R code)  \tabularnewline
Raw Output & view raw output of R engine  \tabularnewline
Computing time & 2 seconds \tabularnewline
R Server & 'RServer@AstonUniversity' @ vre.aston.ac.uk \tabularnewline
\hline
\end{tabular}
%Source: https://freestatistics.org/blog/index.php?pk=54237&T=0

[TABLE]
[ROW][C]Summary of computational transaction[/C][/ROW]
[ROW][C]Raw Input[/C][C]view raw input (R code) [/C][/ROW]
[ROW][C]Raw Output[/C][C]view raw output of R engine [/C][/ROW]
[ROW][C]Computing time[/C][C]2 seconds[/C][/ROW]
[ROW][C]R Server[/C][C]'RServer@AstonUniversity' @ vre.aston.ac.uk[/C][/ROW]
[/TABLE]
Source: https://freestatistics.org/blog/index.php?pk=54237&T=0

Globally Unique Identifier (entire table): ba.freestatistics.org/blog/index.php?pk=54237&T=0

As an alternative you can also use a QR Code:  

The GUIDs for individual cells are displayed in the table below:

Summary of computational transaction
Raw Inputview raw input (R code)
Raw Outputview raw output of R engine
Computing time2 seconds
R Server'RServer@AstonUniversity' @ vre.aston.ac.uk


Boxplot statistics
Variablelower whiskerlower hingemedianupper hingeupper whisker
Bouwaanvragen80.64762876105.29066805113.71749105127.1417644155.5838858
Personenwagens41.1157931781.5709770999.370116755117.573084151.4616803
Werkloosheidsgraad80.5970149391.791044775100104.4776119111.9402985

\begin{tabular}{lllllllll}
\hline
Boxplot statistics \tabularnewline
Variable & lower whisker & lower hinge & median & upper hinge & upper whisker \tabularnewline
Bouwaanvragen & 80.64762876 & 105.29066805 & 113.71749105 & 127.1417644 & 155.5838858 \tabularnewline
Personenwagens & 41.11579317 & 81.57097709 & 99.370116755 & 117.573084 & 151.4616803 \tabularnewline
Werkloosheidsgraad & 80.59701493 & 91.791044775 & 100 & 104.4776119 & 111.9402985 \tabularnewline
\hline
\end{tabular}
%Source: https://freestatistics.org/blog/index.php?pk=54237&T=1

[TABLE]
[ROW][C]Boxplot statistics[/C][/ROW]
[ROW][C]Variable[/C][C]lower whisker[/C][C]lower hinge[/C][C]median[/C][C]upper hinge[/C][C]upper whisker[/C][/ROW]
[ROW][C]Bouwaanvragen[/C][C]80.64762876[/C][C]105.29066805[/C][C]113.71749105[/C][C]127.1417644[/C][C]155.5838858[/C][/ROW]
[ROW][C]Personenwagens[/C][C]41.11579317[/C][C]81.57097709[/C][C]99.370116755[/C][C]117.573084[/C][C]151.4616803[/C][/ROW]
[ROW][C]Werkloosheidsgraad[/C][C]80.59701493[/C][C]91.791044775[/C][C]100[/C][C]104.4776119[/C][C]111.9402985[/C][/ROW]
[/TABLE]
Source: https://freestatistics.org/blog/index.php?pk=54237&T=1

Globally Unique Identifier (entire table): ba.freestatistics.org/blog/index.php?pk=54237&T=1

As an alternative you can also use a QR Code:  

The GUIDs for individual cells are displayed in the table below:

Boxplot statistics
Variablelower whiskerlower hingemedianupper hingeupper whisker
Bouwaanvragen80.64762876105.29066805113.71749105127.1417644155.5838858
Personenwagens41.1157931781.5709770999.370116755117.573084151.4616803
Werkloosheidsgraad80.5970149391.791044775100104.4776119111.9402985


Boxplot Notches
Variablelower boundmedianupper bound
Bouwaanvragen109.260367284311113.71749105118.174614815689
Personenwagens92.026510569150799.370116755106.713722940849
Werkloosheidsgraad97.4122305383615100102.587769461638

\begin{tabular}{lllllllll}
\hline
Boxplot Notches \tabularnewline
Variable & lower bound & median & upper bound \tabularnewline
Bouwaanvragen & 109.260367284311 & 113.71749105 & 118.174614815689 \tabularnewline
Personenwagens & 92.0265105691507 & 99.370116755 & 106.713722940849 \tabularnewline
Werkloosheidsgraad & 97.4122305383615 & 100 & 102.587769461638 \tabularnewline
\hline
\end{tabular}
%Source: https://freestatistics.org/blog/index.php?pk=54237&T=2

[TABLE]
[ROW][C]Boxplot Notches[/C][/ROW]
[ROW][C]Variable[/C][C]lower bound[/C][C]median[/C][C]upper bound[/C][/ROW]
[ROW][C]Bouwaanvragen[/C][C]109.260367284311[/C][C]113.71749105[/C][C]118.174614815689[/C][/ROW]
[ROW][C]Personenwagens[/C][C]92.0265105691507[/C][C]99.370116755[/C][C]106.713722940849[/C][/ROW]
[ROW][C]Werkloosheidsgraad[/C][C]97.4122305383615[/C][C]100[/C][C]102.587769461638[/C][/ROW]
[/TABLE]
Source: https://freestatistics.org/blog/index.php?pk=54237&T=2

Globally Unique Identifier (entire table): ba.freestatistics.org/blog/index.php?pk=54237&T=2

As an alternative you can also use a QR Code:  

The GUIDs for individual cells are displayed in the table below:

Boxplot Notches
Variablelower boundmedianupper bound
Bouwaanvragen109.260367284311113.71749105118.174614815689
Personenwagens92.026510569150799.370116755106.713722940849
Werkloosheidsgraad97.4122305383615100102.587769461638


Parameters (Session):
par1 = grey ;
Parameters (R input):
par1 = grey ;
R code (references can be found in the software module):
z <- as.data.frame(t(y))
bitmap(file='test1.png')
(r<-boxplot(z ,xlab=xlab,ylab=ylab,main=main,notch=TRUE,col=par1))
dev.off()
load(file='createtable')
a<-table.start()
a<-table.row.start(a)
a<-table.element(a,hyperlink('overview.htm','Boxplot statistics','Boxplot overview'),6,TRUE)
a<-table.row.end(a)
a<-table.row.start(a)
a<-table.element(a,'Variable',1,TRUE)
a<-table.element(a,hyperlink('lower_whisker.htm','lower whisker','definition of lower whisker'),1,TRUE)
a<-table.element(a,hyperlink('lower_hinge.htm','lower hinge','definition of lower hinge'),1,TRUE)
a<-table.element(a,hyperlink('central_tendency.htm','median','definitions about measures of central tendency'),1,TRUE)
a<-table.element(a,hyperlink('upper_hinge.htm','upper hinge','definition of upper hinge'),1,TRUE)
a<-table.element(a,hyperlink('upper_whisker.htm','upper whisker','definition of upper whisker'),1,TRUE)
a<-table.row.end(a)
for (i in 1:length(y[,1]))
{
a<-table.row.start(a)
a<-table.element(a,dimnames(t(x))[[2]][i],1,TRUE)
for (j in 1:5)
{
a<-table.element(a,r$stats[j,i])
}
a<-table.row.end(a)
}
a<-table.end(a)
table.save(a,file='mytable.tab')
a<-table.start()
a<-table.row.start(a)
a<-table.element(a,'Boxplot Notches',4,TRUE)
a<-table.row.end(a)
a<-table.row.start(a)
a<-table.element(a,'Variable',1,TRUE)
a<-table.element(a,'lower bound',1,TRUE)
a<-table.element(a,'median',1,TRUE)
a<-table.element(a,'upper bound',1,TRUE)
a<-table.row.end(a)
for (i in 1:length(y[,1]))
{
a<-table.row.start(a)
a<-table.element(a,dimnames(t(x))[[2]][i],1,TRUE)
a<-table.element(a,r$conf[1,i])
a<-table.element(a,r$stats[3,i])
a<-table.element(a,r$conf[2,i])
a<-table.row.end(a)
}
a<-table.end(a)
table.save(a,file='mytable1.tab')