Free Statistics
of Irreproducible Research!
Description of Statistical Computation | |||||||||||||||||||||||||||||||||||||||||||||||||||||||||||||||||||||||||||||||||||||||||||||||||||
|---|---|---|---|---|---|---|---|---|---|---|---|---|---|---|---|---|---|---|---|---|---|---|---|---|---|---|---|---|---|---|---|---|---|---|---|---|---|---|---|---|---|---|---|---|---|---|---|---|---|---|---|---|---|---|---|---|---|---|---|---|---|---|---|---|---|---|---|---|---|---|---|---|---|---|---|---|---|---|---|---|---|---|---|---|---|---|---|---|---|---|---|---|---|---|---|---|---|---|---|
| Author's title | |||||||||||||||||||||||||||||||||||||||||||||||||||||||||||||||||||||||||||||||||||||||||||||||||||
| Author | *The author of this computation has been verified* | ||||||||||||||||||||||||||||||||||||||||||||||||||||||||||||||||||||||||||||||||||||||||||||||||||
| R Software Module | rwasp_correlation.wasp | ||||||||||||||||||||||||||||||||||||||||||||||||||||||||||||||||||||||||||||||||||||||||||||||||||
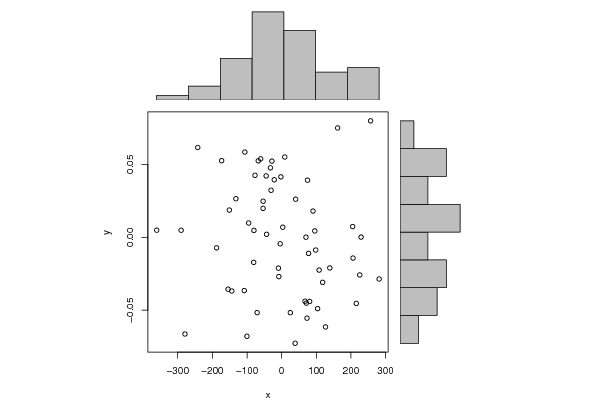
| Title produced by software | Pearson Correlation | ||||||||||||||||||||||||||||||||||||||||||||||||||||||||||||||||||||||||||||||||||||||||||||||||||
| Date of computation | Fri, 06 Nov 2009 03:37:05 -0700 | ||||||||||||||||||||||||||||||||||||||||||||||||||||||||||||||||||||||||||||||||||||||||||||||||||
| Cite this page as follows | Statistical Computations at FreeStatistics.org, Office for Research Development and Education, URL https://freestatistics.org/blog/index.php?v=date/2009/Nov/06/t1257503887g8o7s2s0uyhc9fp.htm/, Retrieved Sat, 27 Apr 2024 19:40:04 +0000 | ||||||||||||||||||||||||||||||||||||||||||||||||||||||||||||||||||||||||||||||||||||||||||||||||||
| Statistical Computations at FreeStatistics.org, Office for Research Development and Education, URL https://freestatistics.org/blog/index.php?pk=54245, Retrieved Sat, 27 Apr 2024 19:40:04 +0000 | |||||||||||||||||||||||||||||||||||||||||||||||||||||||||||||||||||||||||||||||||||||||||||||||||||
| QR Codes: | |||||||||||||||||||||||||||||||||||||||||||||||||||||||||||||||||||||||||||||||||||||||||||||||||||
|
| |||||||||||||||||||||||||||||||||||||||||||||||||||||||||||||||||||||||||||||||||||||||||||||||||||
| Original text written by user: | |||||||||||||||||||||||||||||||||||||||||||||||||||||||||||||||||||||||||||||||||||||||||||||||||||
| IsPrivate? | No (this computation is public) | ||||||||||||||||||||||||||||||||||||||||||||||||||||||||||||||||||||||||||||||||||||||||||||||||||
| User-defined keywords | |||||||||||||||||||||||||||||||||||||||||||||||||||||||||||||||||||||||||||||||||||||||||||||||||||
| Estimated Impact | 169 | ||||||||||||||||||||||||||||||||||||||||||||||||||||||||||||||||||||||||||||||||||||||||||||||||||
Tree of Dependent Computations | |||||||||||||||||||||||||||||||||||||||||||||||||||||||||||||||||||||||||||||||||||||||||||||||||||
| Family? (F = Feedback message, R = changed R code, M = changed R Module, P = changed Parameters, D = changed Data) | |||||||||||||||||||||||||||||||||||||||||||||||||||||||||||||||||||||||||||||||||||||||||||||||||||
| - [Bivariate Explorative Data Analysis] [WS 4 module 2] [2009-10-26 21:23:44] [830e13ac5e5ac1e5b21c6af0c149b21d] - RMPD [Partial Correlation] [WS 5 ] [2009-10-30 20:36:39] [023d83ebdf42a2acf423907b4076e8a1] - RMPD [Bivariate Explorative Data Analysis] [WS 5 Residus biva] [2009-11-01 20:49:44] [830e13ac5e5ac1e5b21c6af0c149b21d] - RMP [Pearson Correlation] [SHWWS5Review4] [2009-11-06 10:37:05] [db49399df1e4a3dbe31268849cebfd7f] [Current] | |||||||||||||||||||||||||||||||||||||||||||||||||||||||||||||||||||||||||||||||||||||||||||||||||||
| Feedback Forum | |||||||||||||||||||||||||||||||||||||||||||||||||||||||||||||||||||||||||||||||||||||||||||||||||||
Post a new message | |||||||||||||||||||||||||||||||||||||||||||||||||||||||||||||||||||||||||||||||||||||||||||||||||||
Dataset | |||||||||||||||||||||||||||||||||||||||||||||||||||||||||||||||||||||||||||||||||||||||||||||||||||
| Dataseries X: | |||||||||||||||||||||||||||||||||||||||||||||||||||||||||||||||||||||||||||||||||||||||||||||||||||
-43,46299021 -80,75309516 -70,74336158 38,9668564 103,8074054 -154,6120618 80,77812389 -8,071755014 98,25849525 -30,58100421 -44,78092348 40,3791734 -132,19098 -76,88100421 -106,2410204 -60,55099614 -2,200632843 -67,52066514 -28,0902534 -21,31993855 204,9200453 -150,9996641 90,49044089 3,190198694 -95,23997084 -53,65976094 -80,03964792 206,0103925 95,62085262 70,15086069 -4,308751793 -9,298856744 138,9711352 77,72149848 281,4313935 108,1314743 118,3119264 -143,9872663 73,21297587 215,4333311 67,37396079 -107,8253934 -100,1751915 -279,1043923 25,05610826 71,32658458 126,5560275 225,3961728 229,2960114 -32,31452952 256,6652767 74,69536553 8,935672307 161,5151556 -242,1946587 -173,2347233 -53,46489282 -290,1749493 -360,6546748 -187,924909 | |||||||||||||||||||||||||||||||||||||||||||||||||||||||||||||||||||||||||||||||||||||||||||||||||||
| Dataseries Y: | |||||||||||||||||||||||||||||||||||||||||||||||||||||||||||||||||||||||||||||||||||||||||||||||||||
0,002022723 -0,017208098 -0,051656261 -0,072675401 -0,04888664 -0,035594314 -0,043990322 -0,026968066 -0,008756337 0,032209121 0,042033292 0,026096897 0,026430772 0,042472121 0,058426687 0,053742338 0,041398106 0,052385238 0,052190308 0,039393774 0,00733234 0,018657154 0,017944976 0,006882464 0,009761905 0,019803549 0,004696588 -0,014269327 0,004359046 5,42631E-05 -0,004455318 -0,02117114 -0,021005357 -0,011061589 -0,028604411 -0,02249124 -0,030906084 -0,036827378 -0,055456866 -0,045366315 -0,043827384 -0,036552019 -0,067865593 -0,066311103 -0,051684645 -0,045133838 -0,061448816 -0,025835909 0,00011375 0,047607207 0,079794997 0,039112385 0,055018633 0,074915741 0,061521734 0,052521997 0,024700439 0,004811919 0,0048453 -0,007247995 | |||||||||||||||||||||||||||||||||||||||||||||||||||||||||||||||||||||||||||||||||||||||||||||||||||
Tables (Output of Computation) | |||||||||||||||||||||||||||||||||||||||||||||||||||||||||||||||||||||||||||||||||||||||||||||||||||
| |||||||||||||||||||||||||||||||||||||||||||||||||||||||||||||||||||||||||||||||||||||||||||||||||||
Figures (Output of Computation) | |||||||||||||||||||||||||||||||||||||||||||||||||||||||||||||||||||||||||||||||||||||||||||||||||||
Input Parameters & R Code | |||||||||||||||||||||||||||||||||||||||||||||||||||||||||||||||||||||||||||||||||||||||||||||||||||
| Parameters (Session): | |||||||||||||||||||||||||||||||||||||||||||||||||||||||||||||||||||||||||||||||||||||||||||||||||||
| Parameters (R input): | |||||||||||||||||||||||||||||||||||||||||||||||||||||||||||||||||||||||||||||||||||||||||||||||||||
| R code (references can be found in the software module): | |||||||||||||||||||||||||||||||||||||||||||||||||||||||||||||||||||||||||||||||||||||||||||||||||||
bitmap(file='test1.png') | |||||||||||||||||||||||||||||||||||||||||||||||||||||||||||||||||||||||||||||||||||||||||||||||||||