Free Statistics

of Irreproducible Research!

Author's title

Author*The author of this computation has been verified*
R Software Modulerwasp_tukeylambda.wasp
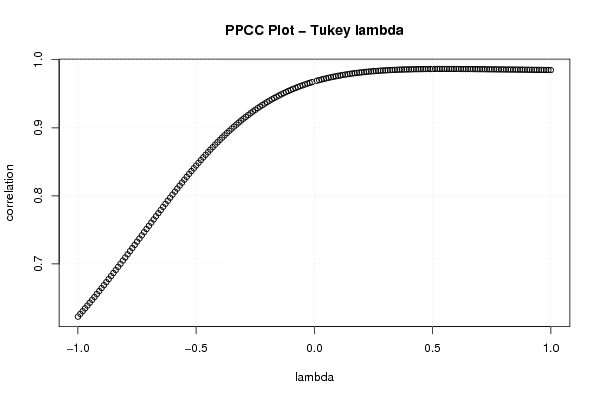
Title produced by softwareTukey lambda PPCC Plot
Date of computationFri, 06 Nov 2009 03:59:56 -0700
Cite this page as followsStatistical Computations at FreeStatistics.org, Office for Research Development and Education, URL https://freestatistics.org/blog/index.php?v=date/2009/Nov/06/t1257505232epz9sfrk3txi7bg.htm/, Retrieved Sat, 27 Apr 2024 18:24:20 +0000
Statistical Computations at FreeStatistics.org, Office for Research Development and Education, URL https://freestatistics.org/blog/index.php?pk=54252, Retrieved Sat, 27 Apr 2024 18:24:20 +0000
QR Codes:

Original text written by user:
IsPrivate?No (this computation is public)
User-defined keywordsWS6turkeylambda
Estimated Impact187
Family? (F = Feedback message, R = changed R code, M = changed R Module, P = changed Parameters, D = changed Data)
-     [Tukey lambda PPCC Plot] [3/11/2009] [2009-11-02 22:14:51] [b98453cac15ba1066b407e146608df68]
-    D    [Tukey lambda PPCC Plot] [] [2009-11-06 10:59:56] [d41d8cd98f00b204e9800998ecf8427e] [Current]
Feedback Forum

Post a new message
Dataseries X:
14271
14013
15912
14290
14744
14721
13918
13263
15660
15629
15113
14526
15132
14908
16167
14122
13985
14236
13921
12394
15454
16146
15107
14593
14695
14513
17071
15179
15460
17173
15938
15003
18216
17847
18029
17281
16706
16750
18912
17763
16736
18061
16713
16769
19514
19251
19951
19052
19555
19083
22534
18854
19801
20346
18169
19087
20842
21602
22360
20334
21215
20530
23152
20134
21193
21628
20823
20493
22106
24178
24958
21620


Summary of computational transaction
Raw Inputview raw input (R code)
Raw Outputview raw output of R engine
Computing time1 seconds
R Server'RServer@AstonUniversity' @ vre.aston.ac.uk

\begin{tabular}{lllllllll}
\hline
Summary of computational transaction \tabularnewline
Raw Input & view raw input (R code)  \tabularnewline
Raw Output & view raw output of R engine  \tabularnewline
Computing time & 1 seconds \tabularnewline
R Server & 'RServer@AstonUniversity' @ vre.aston.ac.uk \tabularnewline
\hline
\end{tabular}
%Source: https://freestatistics.org/blog/index.php?pk=54252&T=0

[TABLE]
[ROW][C]Summary of computational transaction[/C][/ROW]
[ROW][C]Raw Input[/C][C]view raw input (R code) [/C][/ROW]
[ROW][C]Raw Output[/C][C]view raw output of R engine [/C][/ROW]
[ROW][C]Computing time[/C][C]1 seconds[/C][/ROW]
[ROW][C]R Server[/C][C]'RServer@AstonUniversity' @ vre.aston.ac.uk[/C][/ROW]
[/TABLE]
Source: https://freestatistics.org/blog/index.php?pk=54252&T=0

Globally Unique Identifier (entire table): ba.freestatistics.org/blog/index.php?pk=54252&T=0

As an alternative you can also use a QR Code:  

The GUIDs for individual cells are displayed in the table below:

Summary of computational transaction
Raw Inputview raw input (R code)
Raw Outputview raw output of R engine
Computing time1 seconds
R Server'RServer@AstonUniversity' @ vre.aston.ac.uk


Tukey Lambda - Key Values
Distribution (lambda)Correlation
Approx. Cauchy (lambda=-1)0.622662178637484
Exact Logistic (lambda=0)0.968075266238247
Approx. Normal (lambda=0.14)0.978697149057397
U-shaped (lambda=0.5)0.986385159483784
Exactly Uniform (lambda=1)0.984859162619284

\begin{tabular}{lllllllll}
\hline
Tukey Lambda - Key Values \tabularnewline
Distribution (lambda) & Correlation \tabularnewline
Approx. Cauchy (lambda=-1) & 0.622662178637484 \tabularnewline
Exact Logistic (lambda=0) & 0.968075266238247 \tabularnewline
Approx. Normal (lambda=0.14) & 0.978697149057397 \tabularnewline
U-shaped (lambda=0.5) & 0.986385159483784 \tabularnewline
Exactly Uniform (lambda=1) & 0.984859162619284 \tabularnewline
\hline
\end{tabular}
%Source: https://freestatistics.org/blog/index.php?pk=54252&T=1

[TABLE]
[ROW][C]Tukey Lambda - Key Values[/C][/ROW]
[ROW][C]Distribution (lambda)[/C][C]Correlation[/C][/ROW]
[ROW][C]Approx. Cauchy (lambda=-1)[/C][C]0.622662178637484[/C][/ROW]
[ROW][C]Exact Logistic (lambda=0)[/C][C]0.968075266238247[/C][/ROW]
[ROW][C]Approx. Normal (lambda=0.14)[/C][C]0.978697149057397[/C][/ROW]
[ROW][C]U-shaped (lambda=0.5)[/C][C]0.986385159483784[/C][/ROW]
[ROW][C]Exactly Uniform (lambda=1)[/C][C]0.984859162619284[/C][/ROW]
[/TABLE]
Source: https://freestatistics.org/blog/index.php?pk=54252&T=1

Globally Unique Identifier (entire table): ba.freestatistics.org/blog/index.php?pk=54252&T=1

As an alternative you can also use a QR Code:  

The GUIDs for individual cells are displayed in the table below:

Tukey Lambda - Key Values
Distribution (lambda)Correlation
Approx. Cauchy (lambda=-1)0.622662178637484
Exact Logistic (lambda=0)0.968075266238247
Approx. Normal (lambda=0.14)0.978697149057397
U-shaped (lambda=0.5)0.986385159483784
Exactly Uniform (lambda=1)0.984859162619284


Parameters (Session):
Parameters (R input):
R code (references can be found in the software module):
gp <- function(lambda, p)
{
(p^lambda-(1-p)^lambda)/lambda
}
sortx <- sort(x)
c <- array(NA,dim=c(201))
for (i in 1:201)
{
if (i != 101) c[i] <- cor(gp(ppoints(x), lambda=(i-101)/100),sortx)
}
bitmap(file='test1.png')
plot((-100:100)/100,c[1:201],xlab='lambda',ylab='correlation',main='PPCC Plot - Tukey lambda')
grid()
dev.off()
load(file='createtable')
a<-table.start()
a<-table.row.start(a)
a<-table.element(a,'Tukey Lambda - Key Values',2,TRUE)
a<-table.row.end(a)
a<-table.row.start(a)
a<-table.element(a,'Distribution (lambda)',1,TRUE)
a<-table.element(a,'Correlation',1,TRUE)
a<-table.row.end(a)
a<-table.row.start(a)
a<-table.element(a,'Approx. Cauchy (lambda=-1)',header=TRUE)
a<-table.element(a,c[1])
a<-table.row.end(a)
a<-table.row.start(a)
a<-table.element(a,'Exact Logistic (lambda=0)',header=TRUE)
a<-table.element(a,(c[100]+c[102])/2)
a<-table.row.end(a)
a<-table.row.start(a)
a<-table.element(a,'Approx. Normal (lambda=0.14)',header=TRUE)
a<-table.element(a,c[115])
a<-table.row.end(a)
a<-table.row.start(a)
a<-table.element(a,'U-shaped (lambda=0.5)',header=TRUE)
a<-table.element(a,c[151])
a<-table.row.end(a)
a<-table.row.start(a)
a<-table.element(a,'Exactly Uniform (lambda=1)',header=TRUE)
a<-table.element(a,c[201])
a<-table.row.end(a)
a<-table.end(a)
table.save(a,file='mytable.tab')