Free Statistics

of Irreproducible Research!

Author's title

Author*The author of this computation has been verified*
R Software Modulerwasp_edabi.wasp
Title produced by softwareBivariate Explorative Data Analysis
Date of computationFri, 06 Nov 2009 09:29:07 -0700
Cite this page as followsStatistical Computations at FreeStatistics.org, Office for Research Development and Education, URL https://freestatistics.org/blog/index.php?v=date/2009/Nov/06/t1257525062xuqftklhd2euar2.htm/, Retrieved Sun, 28 Apr 2024 09:36:12 +0000
Statistical Computations at FreeStatistics.org, Office for Research Development and Education, URL https://freestatistics.org/blog/index.php?pk=54335, Retrieved Sun, 28 Apr 2024 09:36:12 +0000
QR Codes:

Original text written by user:
IsPrivate?No (this computation is public)
User-defined keywords
Estimated Impact209
Family? (F = Feedback message, R = changed R code, M = changed R Module, P = changed Parameters, D = changed Data)
-     [Bivariate Explorative Data Analysis] [WS5 part 4] [2009-11-06 16:14:36] [f15cf5036ae52d4243ad71d4fb151dbe]
-    D    [Bivariate Explorative Data Analysis] [WS5 part 4(3)] [2009-11-06 16:29:07] [1aecede37375310a889a187dca5e5c0a] [Current]
Feedback Forum

Post a new message
Dataseries X:
-339.5428
231.5128
649.0756
372.7704
499.498
190.3124
-204.2952
-58.446
-73.306
-103.7212
-313.2792
-328.2604
-372.388
106.1776
192.5616
20.5596
183.5608
311.8448
217.2364
179.6844
-75.24
-201.8432
21.4584
656.0952
1235.1644
1478.1512
1561.93
1962.1792
1963.5532
1473.4416
1756.182
2408.0664
2387.464
2404.3548
2106.4712
2249.6928
2403.2508
1315.738
1593.168
666.4204
481.8032
-52.9108
166.172
-189.466
-1252.1688
-2097.2812
-1187.7464
-1084.0484
-2103.8896
-1951.7896
-1555.906
-1808.1908
-2468.4252
-3046.7096
-2417.5764
-2251.7968
-2454.9808
-2246.4072
-1809.4024
-1390.6432
Dataseries Y:
2711.376192
2803.918808
2876.120416
2936.501544
3035.21988
3060.805664
3073.896528
3015.85704
3051.88184
3116.243768
3211.669488
3231.520856
3249.86412
3318.555936
3448.726576
3621.542656
3767.585688
3872.476328
3849.989104
3755.511384
3524.5878
3656.044248
3816.704824
3924.607472
4093.057784
4154.292032
4245.41
4398.483712
4457.189952
4311.504176
4545.75292
4651.442704
4575.86384
4517.268128
4156.975632
4250.910208
4389.611688
4059.48328
4070.99768
3798.795944
3675.272552
3628.629912
3811.80052
3755.13684
3458.384632
2986.592168
3001.164296
2916.579776
2152.244744
1969.020544
1817.48464
1860.053912
1765.643128
1624.698144
1819.042296
2006.573552
1984.072912
2025.327608
2247.855336
2397.747448


Summary of computational transaction
Raw Inputview raw input (R code)
Raw Outputview raw output of R engine
Computing time4 seconds
R Server'RServer@AstonUniversity' @ vre.aston.ac.uk

\begin{tabular}{lllllllll}
\hline
Summary of computational transaction \tabularnewline
Raw Input & view raw input (R code)  \tabularnewline
Raw Output & view raw output of R engine  \tabularnewline
Computing time & 4 seconds \tabularnewline
R Server & 'RServer@AstonUniversity' @ vre.aston.ac.uk \tabularnewline
\hline
\end{tabular}
%Source: https://freestatistics.org/blog/index.php?pk=54335&T=0

[TABLE]
[ROW][C]Summary of computational transaction[/C][/ROW]
[ROW][C]Raw Input[/C][C]view raw input (R code) [/C][/ROW]
[ROW][C]Raw Output[/C][C]view raw output of R engine [/C][/ROW]
[ROW][C]Computing time[/C][C]4 seconds[/C][/ROW]
[ROW][C]R Server[/C][C]'RServer@AstonUniversity' @ vre.aston.ac.uk[/C][/ROW]
[/TABLE]
Source: https://freestatistics.org/blog/index.php?pk=54335&T=0

Globally Unique Identifier (entire table): ba.freestatistics.org/blog/index.php?pk=54335&T=0

As an alternative you can also use a QR Code:  

The GUIDs for individual cells are displayed in the table below:

Summary of computational transaction
Raw Inputview raw input (R code)
Raw Outputview raw output of R engine
Computing time4 seconds
R Server'RServer@AstonUniversity' @ vre.aston.ac.uk


Model: Y[t] = c + b X[t] + e[t]
c3325.14008440347
b0.537815923936143

\begin{tabular}{lllllllll}
\hline
Model: Y[t] = c + b X[t] + e[t] \tabularnewline
c & 3325.14008440347 \tabularnewline
b & 0.537815923936143 \tabularnewline
\hline
\end{tabular}
%Source: https://freestatistics.org/blog/index.php?pk=54335&T=1

[TABLE]
[ROW][C]Model: Y[t] = c + b X[t] + e[t][/C][/ROW]
[ROW][C]c[/C][C]3325.14008440347[/C][/ROW]
[ROW][C]b[/C][C]0.537815923936143[/C][/ROW]
[/TABLE]
Source: https://freestatistics.org/blog/index.php?pk=54335&T=1

Globally Unique Identifier (entire table): ba.freestatistics.org/blog/index.php?pk=54335&T=1

As an alternative you can also use a QR Code:  

The GUIDs for individual cells are displayed in the table below:

Model: Y[t] = c + b X[t] + e[t]
c3325.14008440347
b0.537815923936143


Descriptive Statistics about e[t]
# observations60
minimum-798.102861921873
Q1-211.423763827375
median19.0381024990817
mean9.64806938045607e-15
Q3241.586974639732
maximum806.680867692544

\begin{tabular}{lllllllll}
\hline
Descriptive Statistics about e[t] \tabularnewline
# observations & 60 \tabularnewline
minimum & -798.102861921873 \tabularnewline
Q1 & -211.423763827375 \tabularnewline
median & 19.0381024990817 \tabularnewline
mean & 9.64806938045607e-15 \tabularnewline
Q3 & 241.586974639732 \tabularnewline
maximum & 806.680867692544 \tabularnewline
\hline
\end{tabular}
%Source: https://freestatistics.org/blog/index.php?pk=54335&T=2

[TABLE]
[ROW][C]Descriptive Statistics about e[t][/C][/ROW]
[ROW][C]# observations[/C][C]60[/C][/ROW]
[ROW][C]minimum[/C][C]-798.102861921873[/C][/ROW]
[ROW][C]Q1[/C][C]-211.423763827375[/C][/ROW]
[ROW][C]median[/C][C]19.0381024990817[/C][/ROW]
[ROW][C]mean[/C][C]9.64806938045607e-15[/C][/ROW]
[ROW][C]Q3[/C][C]241.586974639732[/C][/ROW]
[ROW][C]maximum[/C][C]806.680867692544[/C][/ROW]
[/TABLE]
Source: https://freestatistics.org/blog/index.php?pk=54335&T=2

Globally Unique Identifier (entire table): ba.freestatistics.org/blog/index.php?pk=54335&T=2

As an alternative you can also use a QR Code:  

The GUIDs for individual cells are displayed in the table below:

Descriptive Statistics about e[t]
# observations60
minimum-798.102861921873
Q1-211.423763827375
median19.0381024990817
mean9.64806938045607e-15
Q3241.586974639732
maximum806.680867692544


Parameters (Session):
par1 = 0 ; par2 = 36 ;
Parameters (R input):
par1 = 0 ; par2 = 36 ;
R code (references can be found in the software module):
par1 <- as.numeric(par1)
par2 <- as.numeric(par2)
x <- as.ts(x)
y <- as.ts(y)
mylm <- lm(y~x)
cbind(mylm$resid)
library(lattice)
bitmap(file='pic1.png')
plot(y,type='l',main='Run Sequence Plot of Y[t]',xlab='time or index',ylab='value')
grid()
dev.off()
bitmap(file='pic1a.png')
plot(x,type='l',main='Run Sequence Plot of X[t]',xlab='time or index',ylab='value')
grid()
dev.off()
bitmap(file='pic1b.png')
plot(x,y,main='Scatter Plot',xlab='X[t]',ylab='Y[t]')
grid()
dev.off()
bitmap(file='pic1c.png')
plot(mylm$resid,type='l',main='Run Sequence Plot of e[t]',xlab='time or index',ylab='value')
grid()
dev.off()
bitmap(file='pic2.png')
hist(mylm$resid,main='Histogram of e[t]')
dev.off()
bitmap(file='pic3.png')
if (par1 > 0)
{
densityplot(~mylm$resid,col='black',main=paste('Density Plot of e[t] bw = ',par1),bw=par1)
} else {
densityplot(~mylm$resid,col='black',main='Density Plot of e[t]')
}
dev.off()
bitmap(file='pic4.png')
qqnorm(mylm$resid,main='QQ plot of e[t]')
qqline(mylm$resid)
grid()
dev.off()
if (par2 > 0)
{
bitmap(file='pic5.png')
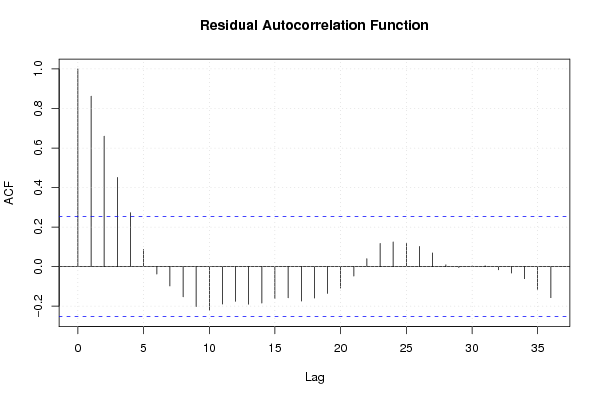
acf(mylm$resid,lag.max=par2,main='Residual Autocorrelation Function')
grid()
dev.off()
}
summary(x)
load(file='createtable')
a<-table.start()
a<-table.row.start(a)
a<-table.element(a,'Model: Y[t] = c + b X[t] + e[t]',2,TRUE)
a<-table.row.end(a)
a<-table.row.start(a)
a<-table.element(a,'c',1,TRUE)
a<-table.element(a,mylm$coeff[[1]])
a<-table.row.end(a)
a<-table.row.start(a)
a<-table.element(a,'b',1,TRUE)
a<-table.element(a,mylm$coeff[[2]])
a<-table.row.end(a)
a<-table.end(a)
table.save(a,file='mytable.tab')
a<-table.start()
a<-table.row.start(a)
a<-table.element(a,'Descriptive Statistics about e[t]',2,TRUE)
a<-table.row.end(a)
a<-table.row.start(a)
a<-table.element(a,'# observations',header=TRUE)
a<-table.element(a,length(mylm$resid))
a<-table.row.end(a)
a<-table.row.start(a)
a<-table.element(a,'minimum',header=TRUE)
a<-table.element(a,min(mylm$resid))
a<-table.row.end(a)
a<-table.row.start(a)
a<-table.element(a,'Q1',header=TRUE)
a<-table.element(a,quantile(mylm$resid,0.25))
a<-table.row.end(a)
a<-table.row.start(a)
a<-table.element(a,'median',header=TRUE)
a<-table.element(a,median(mylm$resid))
a<-table.row.end(a)
a<-table.row.start(a)
a<-table.element(a,'mean',header=TRUE)
a<-table.element(a,mean(mylm$resid))
a<-table.row.end(a)
a<-table.row.start(a)
a<-table.element(a,'Q3',header=TRUE)
a<-table.element(a,quantile(mylm$resid,0.75))
a<-table.row.end(a)
a<-table.row.start(a)
a<-table.element(a,'maximum',header=TRUE)
a<-table.element(a,max(mylm$resid))
a<-table.row.end(a)
a<-table.end(a)
table.save(a,file='mytable.tab')