Free Statistics

of Irreproducible Research!

Author's title

Author*The author of this computation has been verified*
R Software Modulerwasp_notchedbox1.wasp
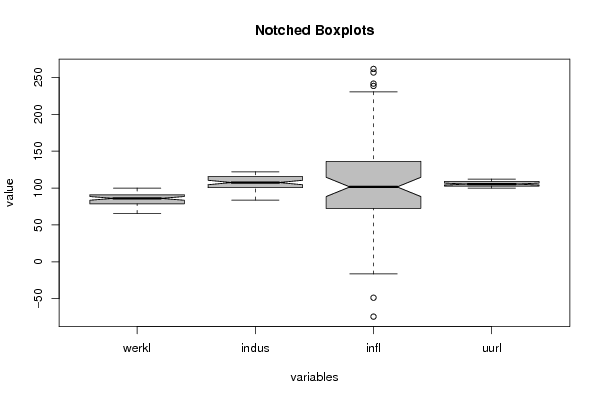
Title produced by softwareNotched Boxplots
Date of computationFri, 06 Nov 2009 10:14:07 -0700
Cite this page as followsStatistical Computations at FreeStatistics.org, Office for Research Development and Education, URL https://freestatistics.org/blog/index.php?v=date/2009/Nov/06/t1257527756rurh3pil76pg2tv.htm/, Retrieved Sat, 27 Apr 2024 22:15:18 +0000
Statistical Computations at FreeStatistics.org, Office for Research Development and Education, URL https://freestatistics.org/blog/index.php?pk=54340, Retrieved Sat, 27 Apr 2024 22:15:18 +0000
QR Codes:

Original text written by user:
IsPrivate?No (this computation is public)
User-defined keywords
Estimated Impact148
Family? (F = Feedback message, R = changed R code, M = changed R Module, P = changed Parameters, D = changed Data)
-     [Notched Boxplots] [3/11/2009] [2009-11-02 21:10:41] [b98453cac15ba1066b407e146608df68]
-    D    [Notched Boxplots] [ws 6] [2009-11-06 17:14:07] [f7d3e79b917995ba1c8c80042fc22ef9] [Current]
Feedback Forum

Post a new message
Dataseries X:
100	100	100	100
100	114,242116	89,82300885	100,1383126
93,5483871	115,8697864	126,5486726	100,2766252
88,17204301	108,0366226	112,8318584	100,461042
89,24731183	100,3051882	100,4424779	100,5532503
91,39784946	98,1688708	100	100,7837713
92,47311828	97,5584944	113,7168142	100,9220839
91,39784946	105,4933876	135,840708	101,1065007
88,17204301	104,8830112	122,1238938	101,6136468
87,09677419	105,4933876	111,0619469	101,8441678
84,94623656	114,0386572	126,9911504	101,890272
92,47311828	88,40284842	138,9380531	102,2591056
93,5483871	96,64292981	137,6106195	102,351314
93,5483871	113,733469	139,8230088	102,4435224
91,39784946	110,681587	109,2920354	102,5818349
90,32258065	111,190234	113,7168142	102,7662517
91,39784946	103,1536114	127,8761062	102,8584601
93,5483871	102,2380468	116,3716814	102,9967727
93,5483871	102,4415056	105,3097345	103,2733979
92,47311828	115,4628688	74,77876106	103,780544
91,39784946	107,9348932	86,72566372	103,9649608
89,24731183	113,5300102	96,90265487	104,1493776
86,02150538	116,8870804	82,74336283	104,3337944
88,17204301	90,13224822	70,79646018	104,4260028
87,09677419	101,2207528	72,12389381	104,6565237
87,09677419	117,0905392	53,98230088	104,7948363
86,02150538	120,0406918	53,53982301	105,0253573
84,94623656	113,3265514	65,92920354	105,1636699
84,94623656	109,155646	72,56637168	105,3019825
86,02150538	107,121058	73,45132743	105,3480867
86,02150538	107,121058	78,31858407	105,4863993
84,94623656	119,9389624	80,53097345	105,5786077
86,02150538	112,1057986	78,76106195	105,6247118
82,79569892	114,3438454	56,63716814	105,7169202
77,41935484	119,5320448	57,07964602	105,8552328
80,64516129	94,60834181	60,61946903	105,9935454
78,49462366	105,2899288	49,55752212	106,0396496
75,2688172	118,311292	66,81415929	106,131858
75,2688172	122,0752798	99,11504425	106,4084832
75,2688172	116,276704	130,0884956	106,5006916
77,41935484	106,5106816	136,7256637	106,8234209
78,49462366	111,698881	153,0973451	106,9156293
76,34408602	114,5473042	161,0619469	107,4227755
73,11827957	116,3784334	194,2477876	108,3909636
68,8172043	117,7009156	183,6283186	108,8059013
65,59139785	116,6836216	230,5309735	109,2208391
69,89247312	120,4476094	256,6371681	109,3130475
82,79569892	96,54120041	261,5044248	109,4974643
84,94623656	105,595117	238,4955752	109,8201936
80,64516129	117,0905392	241,5929204	110,142923
74,19354839	115,6663276	208,8495575	110,2351314
70,96774194	105,7985758	138,9380531	110,6500692
74,19354839	95,93082401	116,3716814	110,7422775
82,79569892	94,09969481	102,6548673	110,8805901
86,02150538	94,81180061	85,39823009	110,9727985
86,02150538	106,5106816	27,43362832	111,1572153
82,79569892	95,62563581	26,54867257	111,2955279
78,49462366	99,7965412	-16,37168142	111,6643615
79,56989247	104,4760936	-48,67256637	111,9870908
87,09677419	83,82502543	-74,33628319	112,1254034


Summary of computational transaction
Raw Inputview raw input (R code)
Raw Outputview raw output of R engine
Computing time1 seconds
R Server'Sir Ronald Aylmer Fisher' @ 193.190.124.24
R Framework error message
Warning: there are blank lines in the 'Data X' field.
Please, use NA for missing data - blank lines are simply
 deleted and are NOT treated as missing values.

\begin{tabular}{lllllllll}
\hline
Summary of computational transaction \tabularnewline
Raw Input & view raw input (R code)  \tabularnewline
Raw Output & view raw output of R engine  \tabularnewline
Computing time & 1 seconds \tabularnewline
R Server & 'Sir Ronald Aylmer Fisher' @ 193.190.124.24 \tabularnewline
R Framework error message & 
Warning: there are blank lines in the 'Data X' field.
Please, use NA for missing data - blank lines are simply
 deleted and are NOT treated as missing values.
\tabularnewline \hline \end{tabular} %Source: https://freestatistics.org/blog/index.php?pk=54340&T=0

[TABLE]
[ROW][C]Summary of computational transaction[/C][/ROW]
[ROW][C]Raw Input[/C][C]view raw input (R code) [/C][/ROW]
[ROW][C]Raw Output[/C][C]view raw output of R engine [/C][/ROW]
[ROW][C]Computing time[/C][C]1 seconds[/C][/ROW]
[ROW][C]R Server[/C][C]'Sir Ronald Aylmer Fisher' @ 193.190.124.24[/C][/ROW]
[ROW][C]R Framework error message[/C][C]
Warning: there are blank lines in the 'Data X' field.
Please, use NA for missing data - blank lines are simply
 deleted and are NOT treated as missing values.
[/C][/ROW] [/TABLE] Source: https://freestatistics.org/blog/index.php?pk=54340&T=0

Globally Unique Identifier (entire table): ba.freestatistics.org/blog/index.php?pk=54340&T=0

As an alternative you can also use a QR Code:  

The GUIDs for individual cells are displayed in the table below:

Summary of computational transaction
Raw Inputview raw input (R code)
Raw Outputview raw output of R engine
Computing time1 seconds
R Server'Sir Ronald Aylmer Fisher' @ 193.190.124.24
R Framework error message
Warning: there are blank lines in the 'Data X' field.
Please, use NA for missing data - blank lines are simply
 deleted and are NOT treated as missing values.


Boxplot statistics
Variablelower whiskerlower hingemedianupper hingeupper whisker
werkl65.5913978578.4946236686.0215053890.860215055100
indus83.82502543100.7629705107.5279756115.5645982122.0752798
infl-16.3716814272.345132745101.5486726136.28318585230.5309735
uurl100102.6740433105.417243109.0133702112.1254034

\begin{tabular}{lllllllll}
\hline
Boxplot statistics \tabularnewline
Variable & lower whisker & lower hinge & median & upper hinge & upper whisker \tabularnewline
werkl & 65.59139785 & 78.49462366 & 86.02150538 & 90.860215055 & 100 \tabularnewline
indus & 83.82502543 & 100.7629705 & 107.5279756 & 115.5645982 & 122.0752798 \tabularnewline
infl & -16.37168142 & 72.345132745 & 101.5486726 & 136.28318585 & 230.5309735 \tabularnewline
uurl & 100 & 102.6740433 & 105.417243 & 109.0133702 & 112.1254034 \tabularnewline
\hline
\end{tabular}
%Source: https://freestatistics.org/blog/index.php?pk=54340&T=1

[TABLE]
[ROW][C]Boxplot statistics[/C][/ROW]
[ROW][C]Variable[/C][C]lower whisker[/C][C]lower hinge[/C][C]median[/C][C]upper hinge[/C][C]upper whisker[/C][/ROW]
[ROW][C]werkl[/C][C]65.59139785[/C][C]78.49462366[/C][C]86.02150538[/C][C]90.860215055[/C][C]100[/C][/ROW]
[ROW][C]indus[/C][C]83.82502543[/C][C]100.7629705[/C][C]107.5279756[/C][C]115.5645982[/C][C]122.0752798[/C][/ROW]
[ROW][C]infl[/C][C]-16.37168142[/C][C]72.345132745[/C][C]101.5486726[/C][C]136.28318585[/C][C]230.5309735[/C][/ROW]
[ROW][C]uurl[/C][C]100[/C][C]102.6740433[/C][C]105.417243[/C][C]109.0133702[/C][C]112.1254034[/C][/ROW]
[/TABLE]
Source: https://freestatistics.org/blog/index.php?pk=54340&T=1

Globally Unique Identifier (entire table): ba.freestatistics.org/blog/index.php?pk=54340&T=1

As an alternative you can also use a QR Code:  

The GUIDs for individual cells are displayed in the table below:

Boxplot statistics
Variablelower whiskerlower hingemedianupper hingeupper whisker
werkl65.5913978578.4946236686.0215053890.860215055100
indus83.82502543100.7629705107.5279756115.5645982122.0752798
infl-16.3716814272.345132745101.5486726136.28318585230.5309735
uurl100102.6740433105.417243109.0133702112.1254034


Boxplot Notches
Variablelower boundmedianupper bound
werkl83.499207624287786.0215053888.5438031357123
indus104.508782167513107.5279756110.547169032487
infl88.5067724837982101.5486726114.590572716202
uurl104.124165337814105.417243106.710320662186

\begin{tabular}{lllllllll}
\hline
Boxplot Notches \tabularnewline
Variable & lower bound & median & upper bound \tabularnewline
werkl & 83.4992076242877 & 86.02150538 & 88.5438031357123 \tabularnewline
indus & 104.508782167513 & 107.5279756 & 110.547169032487 \tabularnewline
infl & 88.5067724837982 & 101.5486726 & 114.590572716202 \tabularnewline
uurl & 104.124165337814 & 105.417243 & 106.710320662186 \tabularnewline
\hline
\end{tabular}
%Source: https://freestatistics.org/blog/index.php?pk=54340&T=2

[TABLE]
[ROW][C]Boxplot Notches[/C][/ROW]
[ROW][C]Variable[/C][C]lower bound[/C][C]median[/C][C]upper bound[/C][/ROW]
[ROW][C]werkl[/C][C]83.4992076242877[/C][C]86.02150538[/C][C]88.5438031357123[/C][/ROW]
[ROW][C]indus[/C][C]104.508782167513[/C][C]107.5279756[/C][C]110.547169032487[/C][/ROW]
[ROW][C]infl[/C][C]88.5067724837982[/C][C]101.5486726[/C][C]114.590572716202[/C][/ROW]
[ROW][C]uurl[/C][C]104.124165337814[/C][C]105.417243[/C][C]106.710320662186[/C][/ROW]
[/TABLE]
Source: https://freestatistics.org/blog/index.php?pk=54340&T=2

Globally Unique Identifier (entire table): ba.freestatistics.org/blog/index.php?pk=54340&T=2

As an alternative you can also use a QR Code:  

The GUIDs for individual cells are displayed in the table below:

Boxplot Notches
Variablelower boundmedianupper bound
werkl83.499207624287786.0215053888.5438031357123
indus104.508782167513107.5279756110.547169032487
infl88.5067724837982101.5486726114.590572716202
uurl104.124165337814105.417243106.710320662186


Parameters (Session):
par1 = grey ;
Parameters (R input):
par1 = grey ;
R code (references can be found in the software module):
z <- as.data.frame(t(y))
bitmap(file='test1.png')
(r<-boxplot(z ,xlab=xlab,ylab=ylab,main=main,notch=TRUE,col=par1))
dev.off()
load(file='createtable')
a<-table.start()
a<-table.row.start(a)
a<-table.element(a,hyperlink('overview.htm','Boxplot statistics','Boxplot overview'),6,TRUE)
a<-table.row.end(a)
a<-table.row.start(a)
a<-table.element(a,'Variable',1,TRUE)
a<-table.element(a,hyperlink('lower_whisker.htm','lower whisker','definition of lower whisker'),1,TRUE)
a<-table.element(a,hyperlink('lower_hinge.htm','lower hinge','definition of lower hinge'),1,TRUE)
a<-table.element(a,hyperlink('central_tendency.htm','median','definitions about measures of central tendency'),1,TRUE)
a<-table.element(a,hyperlink('upper_hinge.htm','upper hinge','definition of upper hinge'),1,TRUE)
a<-table.element(a,hyperlink('upper_whisker.htm','upper whisker','definition of upper whisker'),1,TRUE)
a<-table.row.end(a)
for (i in 1:length(y[,1]))
{
a<-table.row.start(a)
a<-table.element(a,dimnames(t(x))[[2]][i],1,TRUE)
for (j in 1:5)
{
a<-table.element(a,r$stats[j,i])
}
a<-table.row.end(a)
}
a<-table.end(a)
table.save(a,file='mytable.tab')
a<-table.start()
a<-table.row.start(a)
a<-table.element(a,'Boxplot Notches',4,TRUE)
a<-table.row.end(a)
a<-table.row.start(a)
a<-table.element(a,'Variable',1,TRUE)
a<-table.element(a,'lower bound',1,TRUE)
a<-table.element(a,'median',1,TRUE)
a<-table.element(a,'upper bound',1,TRUE)
a<-table.row.end(a)
for (i in 1:length(y[,1]))
{
a<-table.row.start(a)
a<-table.element(a,dimnames(t(x))[[2]][i],1,TRUE)
a<-table.element(a,r$conf[1,i])
a<-table.element(a,r$stats[3,i])
a<-table.element(a,r$conf[2,i])
a<-table.row.end(a)
}
a<-table.end(a)
table.save(a,file='mytable1.tab')