Free Statistics
of Irreproducible Research!
Description of Statistical Computation | |||||||||||||||||||||
|---|---|---|---|---|---|---|---|---|---|---|---|---|---|---|---|---|---|---|---|---|---|
| Author's title | |||||||||||||||||||||
| Author | *The author of this computation has been verified* | ||||||||||||||||||||
| R Software Module | rwasp_backtobackhist.wasp | ||||||||||||||||||||
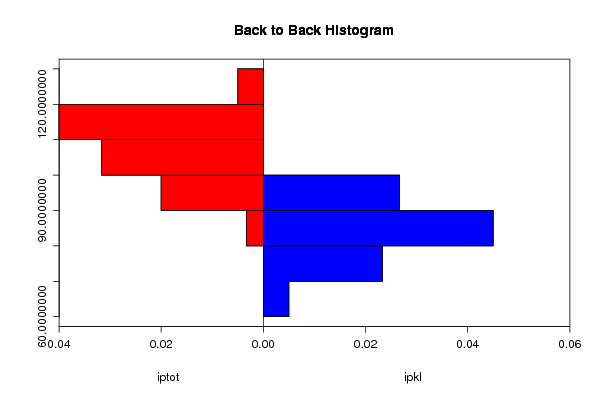
| Title produced by software | Back to Back Histogram | ||||||||||||||||||||
| Date of computation | Fri, 06 Nov 2009 10:55:20 -0700 | ||||||||||||||||||||
| Cite this page as follows | Statistical Computations at FreeStatistics.org, Office for Research Development and Education, URL https://freestatistics.org/blog/index.php?v=date/2009/Nov/06/t12575303412dw8ld2v4s9owwj.htm/, Retrieved Sat, 27 Apr 2024 22:31:47 +0000 | ||||||||||||||||||||
| Statistical Computations at FreeStatistics.org, Office for Research Development and Education, URL https://freestatistics.org/blog/index.php?pk=54342, Retrieved Sat, 27 Apr 2024 22:31:47 +0000 | |||||||||||||||||||||
| QR Codes: | |||||||||||||||||||||
|
| |||||||||||||||||||||
| Original text written by user: | |||||||||||||||||||||
| IsPrivate? | No (this computation is public) | ||||||||||||||||||||
| User-defined keywords | |||||||||||||||||||||
| Estimated Impact | 222 | ||||||||||||||||||||
Tree of Dependent Computations | |||||||||||||||||||||
| Family? (F = Feedback message, R = changed R code, M = changed R Module, P = changed Parameters, D = changed Data) | |||||||||||||||||||||
| - [Back to Back Histogram] [3/11/2009] [2009-11-02 21:58:53] [b98453cac15ba1066b407e146608df68] - PD [Back to Back Histogram] [ws 6] [2009-11-06 17:55:20] [f7d3e79b917995ba1c8c80042fc22ef9] [Current] | |||||||||||||||||||||
| Feedback Forum | |||||||||||||||||||||
Post a new message | |||||||||||||||||||||
Dataset | |||||||||||||||||||||
| Dataseries X: | |||||||||||||||||||||
100 114,242116 115,8697864 108,0366226 100,3051882 98,1688708 97,5584944 105,4933876 104,8830112 105,4933876 114,0386572 88,40284842 96,64292981 113,733469 110,681587 111,190234 103,1536114 102,2380468 102,4415056 115,4628688 107,9348932 113,5300102 116,8870804 90,13224822 101,2207528 117,0905392 120,0406918 113,3265514 109,155646 107,121058 107,121058 119,9389624 112,1057986 114,3438454 119,5320448 94,60834181 105,2899288 118,311292 122,0752798 116,276704 106,5106816 111,698881 114,5473042 116,3784334 117,7009156 116,6836216 120,4476094 96,54120041 105,595117 117,0905392 115,6663276 105,7985758 95,93082401 94,09969481 94,81180061 106,5106816 95,62563581 99,7965412 104,4760936 83,82502543 | |||||||||||||||||||||
| Dataseries Y: | |||||||||||||||||||||
100 100 93,5483871 88,17204301 89,24731183 91,39784946 92,47311828 91,39784946 88,17204301 87,09677419 84,94623656 92,47311828 93,5483871 93,5483871 91,39784946 90,32258065 91,39784946 93,5483871 93,5483871 92,47311828 91,39784946 89,24731183 86,02150538 88,17204301 87,09677419 87,09677419 86,02150538 84,94623656 84,94623656 86,02150538 86,02150538 84,94623656 86,02150538 82,79569892 77,41935484 80,64516129 78,49462366 75,2688172 75,2688172 75,2688172 77,41935484 78,49462366 76,34408602 73,11827957 68,8172043 65,59139785 69,89247312 82,79569892 84,94623656 80,64516129 74,19354839 70,96774194 74,19354839 82,79569892 86,02150538 86,02150538 82,79569892 78,49462366 79,56989247 87,09677419 | |||||||||||||||||||||
Tables (Output of Computation) | |||||||||||||||||||||
| |||||||||||||||||||||
Figures (Output of Computation) | |||||||||||||||||||||
Input Parameters & R Code | |||||||||||||||||||||
| Parameters (Session): | |||||||||||||||||||||
| par1 = red ; par2 = blue ; par3 = TRUE ; par4 = iptot ; par5 = ipkl ; | |||||||||||||||||||||
| Parameters (R input): | |||||||||||||||||||||
| par1 = red ; par2 = blue ; par3 = TRUE ; par4 = iptot ; par5 = ipkl ; | |||||||||||||||||||||
| R code (references can be found in the software module): | |||||||||||||||||||||
if (par3 == 'TRUE') par3 <- TRUE | |||||||||||||||||||||