Free Statistics
of Irreproducible Research!
Description of Statistical Computation | |||||||||||||||||||||||||||||||||||||||||||||||||||||||||||||||||||||||||||||||||||||||||||||
|---|---|---|---|---|---|---|---|---|---|---|---|---|---|---|---|---|---|---|---|---|---|---|---|---|---|---|---|---|---|---|---|---|---|---|---|---|---|---|---|---|---|---|---|---|---|---|---|---|---|---|---|---|---|---|---|---|---|---|---|---|---|---|---|---|---|---|---|---|---|---|---|---|---|---|---|---|---|---|---|---|---|---|---|---|---|---|---|---|---|---|---|---|---|
| Author's title | |||||||||||||||||||||||||||||||||||||||||||||||||||||||||||||||||||||||||||||||||||||||||||||
| Author | *The author of this computation has been verified* | ||||||||||||||||||||||||||||||||||||||||||||||||||||||||||||||||||||||||||||||||||||||||||||
| R Software Module | rwasp_pairs.wasp | ||||||||||||||||||||||||||||||||||||||||||||||||||||||||||||||||||||||||||||||||||||||||||||
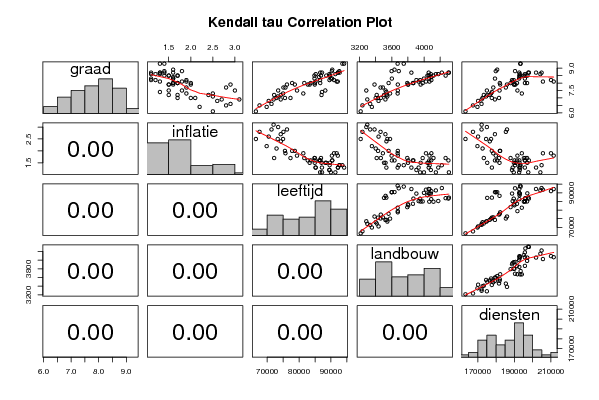
| Title produced by software | Kendall tau Correlation Matrix | ||||||||||||||||||||||||||||||||||||||||||||||||||||||||||||||||||||||||||||||||||||||||||||
| Date of computation | Sun, 08 Nov 2009 05:21:45 -0700 | ||||||||||||||||||||||||||||||||||||||||||||||||||||||||||||||||||||||||||||||||||||||||||||
| Cite this page as follows | Statistical Computations at FreeStatistics.org, Office for Research Development and Education, URL https://freestatistics.org/blog/index.php?v=date/2009/Nov/08/t1257683943azu0nyqzea48mmq.htm/, Retrieved Sat, 04 May 2024 11:48:57 +0000 | ||||||||||||||||||||||||||||||||||||||||||||||||||||||||||||||||||||||||||||||||||||||||||||
| Statistical Computations at FreeStatistics.org, Office for Research Development and Education, URL https://freestatistics.org/blog/index.php?pk=54530, Retrieved Sat, 04 May 2024 11:48:57 +0000 | |||||||||||||||||||||||||||||||||||||||||||||||||||||||||||||||||||||||||||||||||||||||||||||
| QR Codes: | |||||||||||||||||||||||||||||||||||||||||||||||||||||||||||||||||||||||||||||||||||||||||||||
|
| |||||||||||||||||||||||||||||||||||||||||||||||||||||||||||||||||||||||||||||||||||||||||||||
| Original text written by user: | |||||||||||||||||||||||||||||||||||||||||||||||||||||||||||||||||||||||||||||||||||||||||||||
| IsPrivate? | No (this computation is public) | ||||||||||||||||||||||||||||||||||||||||||||||||||||||||||||||||||||||||||||||||||||||||||||
| User-defined keywords | |||||||||||||||||||||||||||||||||||||||||||||||||||||||||||||||||||||||||||||||||||||||||||||
| Estimated Impact | 172 | ||||||||||||||||||||||||||||||||||||||||||||||||||||||||||||||||||||||||||||||||||||||||||||
Tree of Dependent Computations | |||||||||||||||||||||||||||||||||||||||||||||||||||||||||||||||||||||||||||||||||||||||||||||
| Family? (F = Feedback message, R = changed R code, M = changed R Module, P = changed Parameters, D = changed Data) | |||||||||||||||||||||||||||||||||||||||||||||||||||||||||||||||||||||||||||||||||||||||||||||
| - [Kendall tau Correlation Matrix] [3/11/2009] [2009-11-02 21:25:00] [b98453cac15ba1066b407e146608df68] - D [Kendall tau Correlation Matrix] [] [2009-11-08 12:21:45] [7dd0431c761b876151627bfbf92230c8] [Current] | |||||||||||||||||||||||||||||||||||||||||||||||||||||||||||||||||||||||||||||||||||||||||||||
| Feedback Forum | |||||||||||||||||||||||||||||||||||||||||||||||||||||||||||||||||||||||||||||||||||||||||||||
Post a new message | |||||||||||||||||||||||||||||||||||||||||||||||||||||||||||||||||||||||||||||||||||||||||||||
Dataset | |||||||||||||||||||||||||||||||||||||||||||||||||||||||||||||||||||||||||||||||||||||||||||||
| Dataseries X: | |||||||||||||||||||||||||||||||||||||||||||||||||||||||||||||||||||||||||||||||||||||||||||||
8.9 1.6 90398 3633 180600 8.8 1.8 90269 3597 179835 8.3 1.6 90390 3600 179390 7.5 1.5 88219 3522 181871 7.2 1.5 87032 3503 175153 7.4 1.3 87175 3532 177709 8.8 1.4 92603 3686 190370 9.3 1.4 93571 3748 193423 9.3 1.3 94118 3672 193211 8.7 1.3 92159 3843 192691 8.2 1.2 89528 3905 188728 8.3 1.1 89955 3999 192632 8.5 1.4 89587 4070 192977 8.6 1.2 89488 4084 192941 8.5 1.5 88521 4042 192822 8.2 1.1 86587 3951 189644 8.1 1.3 85159 3933 189056 7.9 1.5 84915 3958 190574 8.6 1.1 91378 4147 204210 8.7 1.4 92729 4221 204888 8.7 1.3 92194 4058 201858 8.5 1.5 89664 4057 197077 8.4 1.6 86285 4089 192734 8.5 1.7 86858 4268 196020 8.7 1.1 87184 4309 197603 8.7 1.6 86629 4303 197965 8.6 1.3 85220 4177 195756 8.5 1.7 84816 4117 195182 8.3 1.6 84831 4065 195728 8 1.7 84957 3983 196950 8.2 1.9 90951 4091 210029 8.1 1.8 92134 4067 211516 8.1 1.9 91790 4024 205624 8 1.6 86625 3868 195776 7.9 1.5 83324 3800 189706 7.9 1.6 82719 3804 190040 8 1.6 83614 3862 191434 8 1.7 81640 3792 187925 7.9 2 78665 3674 182239 8 2 77828 3560 182031 7.7 1.9 75728 3489 178459 7.2 1.7 72187 3412 173278 7.5 1.8 79357 3674 191660 7.3 1.9 81329 3672 194075 7 1.7 77304 3463 181591 7 2 75576 3429 177660 7 2.1 72932 3400 172607 7.2 2.4 74291 3533 176520 7.3 2.5 74988 3578 177271 7.1 2.5 73302 3544 174540 6.8 2.6 70483 3435 170148 6.4 2.2 69848 3352 169799 6.1 2.5 66466 3213 163249 6.5 2.8 67610 3235 167363 7.7 2.8 75091 3460 185332 7.9 2.9 76207 3385 185969 7.5 3 73454 3283 174955 6.9 3.1 72008 3295 172088 6.6 2.9 71362 3331 172037 6.9 2.7 74250 3520 179351 | |||||||||||||||||||||||||||||||||||||||||||||||||||||||||||||||||||||||||||||||||||||||||||||
Tables (Output of Computation) | |||||||||||||||||||||||||||||||||||||||||||||||||||||||||||||||||||||||||||||||||||||||||||||
| |||||||||||||||||||||||||||||||||||||||||||||||||||||||||||||||||||||||||||||||||||||||||||||
Figures (Output of Computation) | |||||||||||||||||||||||||||||||||||||||||||||||||||||||||||||||||||||||||||||||||||||||||||||
Input Parameters & R Code | |||||||||||||||||||||||||||||||||||||||||||||||||||||||||||||||||||||||||||||||||||||||||||||
| Parameters (Session): | |||||||||||||||||||||||||||||||||||||||||||||||||||||||||||||||||||||||||||||||||||||||||||||
| Parameters (R input): | |||||||||||||||||||||||||||||||||||||||||||||||||||||||||||||||||||||||||||||||||||||||||||||
| R code (references can be found in the software module): | |||||||||||||||||||||||||||||||||||||||||||||||||||||||||||||||||||||||||||||||||||||||||||||
panel.tau <- function(x, y, digits=2, prefix='', cex.cor) | |||||||||||||||||||||||||||||||||||||||||||||||||||||||||||||||||||||||||||||||||||||||||||||