Free Statistics

of Irreproducible Research!

Author's title

Author*The author of this computation has been verified*
R Software Modulerwasp_pairs.wasp
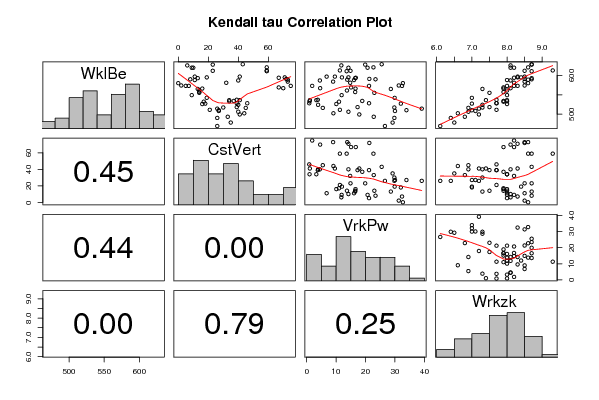
Title produced by softwareKendall tau Correlation Matrix
Date of computationWed, 11 Nov 2009 08:58:25 -0700
Cite this page as followsStatistical Computations at FreeStatistics.org, Office for Research Development and Education, URL https://freestatistics.org/blog/index.php?v=date/2009/Nov/11/t1257955268jzsqnwrz4m1soxf.htm/, Retrieved Tue, 07 May 2024 07:26:43 +0000
Statistical Computations at FreeStatistics.org, Office for Research Development and Education, URL https://freestatistics.org/blog/index.php?pk=55725, Retrieved Tue, 07 May 2024 07:26:43 +0000
QR Codes:

Original text written by user:
IsPrivate?No (this computation is public)
User-defined keywordswerkloosheid, werkzoekenden, nieuwe personenwagens, consumentenvertrouwen
Estimated Impact170
Family? (F = Feedback message, R = changed R code, M = changed R Module, P = changed Parameters, D = changed Data)
-     [Kendall tau Correlation Matrix] [3/11/2009] [2009-11-02 21:25:00] [b98453cac15ba1066b407e146608df68]
-    D    [Kendall tau Correlation Matrix] [Kendall tau Corre...] [2009-11-11 15:58:25] [27b6e36591879260e4dc6bb7e89a38fd] [Current]
-    D      [Kendall tau Correlation Matrix] [] [2009-11-13 16:36:04] [69400782d28359bd00f6a8e8fb9347a1]
Feedback Forum

Post a new message
Dataseries X:
613	59	11.3	9.3
611	59	13.6	8.7
594	67	16.7	8.2
595	71	14.2	8.3
591	72	21.3	8.5
589	73	13.8	8.6
584	73	9	8.5
573	75	1.9	8.2
567	70	4.6	8.1
569	67	15.1	7.9
621	59	22.7	8.6
629	43	25.5	8.7
628	23	19.9	8.7
612	23	14.9	8.5
595	19	12	8.4
597	11	6.8	8.5
593	13	16.5	8.7
590	8	23.4	8.7
580	0	32.7	8.6
574	2	31.3	8.5
573	7	32.4	8.3
573	5	21.2	8
620	9	20.7	8.2
626	6	11.8	8.1
620	10	14.2	8.1
588	11	16.1	8
566	16	16.6	7.9
557	14	16.5	7.9
561	14	13.7	8
549	9	11.9	8
532	17	11	7.9
526	16	10.1	8
511	21	11.3	7.7
499	41	17.9	7.2
555	14	23	7.5
565	13	28.6	7.3
542	19	29.9	7
527	18	32	7
510	27	33.9	7
514	26	39.1	7.2
517	30	29.8	7.3
508	27	30	7.1
493	33	22.8	6.8
490	26	29.8	6.4
469	26	26.6	6.1
478	35	29.2	6.5
528	39	21.2	7.7
534	37	18.9	7.9
518	39	17.3	7.5
506	40	14.2	6.9
502	44	9.1	6.6
516	45	5.5	6.9
528	46	0.9	7.7
533	34	1	8
536	34	3.3	8
537	39	3.8	7.7
524	40	3.9	7.3
536	41	1.1	7.4
587	40	4.5	8.1
597	41	9.6	8.3
581	32	14.8	8.2


Summary of computational transaction
Raw Inputview raw input (R code)
Raw Outputview raw output of R engine
Computing time2 seconds
R Server'Sir Ronald Aylmer Fisher' @ 193.190.124.24
R Framework error message
The field 'Names of X columns' contains a hard return which cannot be interpreted.
Please, resubmit your request without hard returns in the 'Names of X columns'.

\begin{tabular}{lllllllll}
\hline
Summary of computational transaction \tabularnewline
Raw Input & view raw input (R code)  \tabularnewline
Raw Output & view raw output of R engine  \tabularnewline
Computing time & 2 seconds \tabularnewline
R Server & 'Sir Ronald Aylmer Fisher' @ 193.190.124.24 \tabularnewline
R Framework error message & 
The field 'Names of X columns' contains a hard return which cannot be interpreted.
Please, resubmit your request without hard returns in the 'Names of X columns'.
\tabularnewline \hline \end{tabular} %Source: https://freestatistics.org/blog/index.php?pk=55725&T=0

[TABLE]
[ROW][C]Summary of computational transaction[/C][/ROW]
[ROW][C]Raw Input[/C][C]view raw input (R code) [/C][/ROW]
[ROW][C]Raw Output[/C][C]view raw output of R engine [/C][/ROW]
[ROW][C]Computing time[/C][C]2 seconds[/C][/ROW]
[ROW][C]R Server[/C][C]'Sir Ronald Aylmer Fisher' @ 193.190.124.24[/C][/ROW]
[ROW][C]R Framework error message[/C][C]
The field 'Names of X columns' contains a hard return which cannot be interpreted.
Please, resubmit your request without hard returns in the 'Names of X columns'.
[/C][/ROW] [/TABLE] Source: https://freestatistics.org/blog/index.php?pk=55725&T=0

Globally Unique Identifier (entire table): ba.freestatistics.org/blog/index.php?pk=55725&T=0

As an alternative you can also use a QR Code:  

The GUIDs for individual cells are displayed in the table below:

Summary of computational transaction
Raw Inputview raw input (R code)
Raw Outputview raw output of R engine
Computing time2 seconds
R Server'Sir Ronald Aylmer Fisher' @ 193.190.124.24
R Framework error message
The field 'Names of X columns' contains a hard return which cannot be interpreted.
Please, resubmit your request without hard returns in the 'Names of X columns'.


Kendall tau rank correlations for all pairs of data series
pairtaup-value
tau( WklBe , CstVert )-0.06622617408773420.454860357781993
tau( WklBe , VrkPw )-0.06858710820531760.436504170352588
tau( WklBe , Wrkzk )0.7294255819729434.44089209850063e-16
tau( CstVert , VrkPw )-0.2554525623981050.00393383858660101
tau( CstVert , Wrkzk )-0.02367825958315090.793151546334118
tau( VrkPw , Wrkzk )-0.103694631930690.248298198161714

\begin{tabular}{lllllllll}
\hline
Kendall tau rank correlations for all pairs of data series \tabularnewline
pair & tau & p-value \tabularnewline
tau( WklBe , CstVert ) & -0.0662261740877342 & 0.454860357781993 \tabularnewline
tau( WklBe , VrkPw ) & -0.0685871082053176 & 0.436504170352588 \tabularnewline
tau( WklBe , Wrkzk
 ) & 0.729425581972943 & 4.44089209850063e-16 \tabularnewline
tau( CstVert , VrkPw ) & -0.255452562398105 & 0.00393383858660101 \tabularnewline
tau( CstVert , Wrkzk
 ) & -0.0236782595831509 & 0.793151546334118 \tabularnewline
tau( VrkPw , Wrkzk
 ) & -0.10369463193069 & 0.248298198161714 \tabularnewline
\hline
\end{tabular}
%Source: https://freestatistics.org/blog/index.php?pk=55725&T=1

[TABLE]
[ROW][C]Kendall tau rank correlations for all pairs of data series[/C][/ROW]
[ROW][C]pair[/C][C]tau[/C][C]p-value[/C][/ROW]
[ROW][C]tau( WklBe , CstVert )[/C][C]-0.0662261740877342[/C][C]0.454860357781993[/C][/ROW]
[ROW][C]tau( WklBe , VrkPw )[/C][C]-0.0685871082053176[/C][C]0.436504170352588[/C][/ROW]
[ROW][C]tau( WklBe , Wrkzk
 )[/C][C]0.729425581972943[/C][C]4.44089209850063e-16[/C][/ROW]
[ROW][C]tau( CstVert , VrkPw )[/C][C]-0.255452562398105[/C][C]0.00393383858660101[/C][/ROW]
[ROW][C]tau( CstVert , Wrkzk
 )[/C][C]-0.0236782595831509[/C][C]0.793151546334118[/C][/ROW]
[ROW][C]tau( VrkPw , Wrkzk
 )[/C][C]-0.10369463193069[/C][C]0.248298198161714[/C][/ROW]
[/TABLE]
Source: https://freestatistics.org/blog/index.php?pk=55725&T=1

Globally Unique Identifier (entire table): ba.freestatistics.org/blog/index.php?pk=55725&T=1

As an alternative you can also use a QR Code:  

The GUIDs for individual cells are displayed in the table below:

Kendall tau rank correlations for all pairs of data series
pairtaup-value
tau( WklBe , CstVert )-0.06622617408773420.454860357781993
tau( WklBe , VrkPw )-0.06858710820531760.436504170352588
tau( WklBe , Wrkzk )0.7294255819729434.44089209850063e-16
tau( CstVert , VrkPw )-0.2554525623981050.00393383858660101
tau( CstVert , Wrkzk )-0.02367825958315090.793151546334118
tau( VrkPw , Wrkzk )-0.103694631930690.248298198161714


Parameters (Session):
Parameters (R input):
R code (references can be found in the software module):
panel.tau <- function(x, y, digits=2, prefix='', cex.cor)
{
usr <- par('usr'); on.exit(par(usr))
par(usr = c(0, 1, 0, 1))
rr <- cor.test(x, y, method='kendall')
r <- round(rr$p.value,2)
txt <- format(c(r, 0.123456789), digits=digits)[1]
txt <- paste(prefix, txt, sep='')
if(missing(cex.cor)) cex <- 0.5/strwidth(txt)
text(0.5, 0.5, txt, cex = cex)
}
panel.hist <- function(x, ...)
{
usr <- par('usr'); on.exit(par(usr))
par(usr = c(usr[1:2], 0, 1.5) )
h <- hist(x, plot = FALSE)
breaks <- h$breaks; nB <- length(breaks)
y <- h$counts; y <- y/max(y)
rect(breaks[-nB], 0, breaks[-1], y, col='grey', ...)
}
bitmap(file='test1.png')
pairs(t(y),diag.panel=panel.hist, upper.panel=panel.smooth, lower.panel=panel.tau, main=main)
dev.off()
load(file='createtable')
a<-table.start()
a<-table.row.start(a)
a<-table.element(a,'Kendall tau rank correlations for all pairs of data series',3,TRUE)
a<-table.row.end(a)
a<-table.row.start(a)
a<-table.element(a,'pair',1,TRUE)
a<-table.element(a,'tau',1,TRUE)
a<-table.element(a,'p-value',1,TRUE)
a<-table.row.end(a)
n <- length(y[,1])
n
cor.test(y[1,],y[2,],method='kendall')
for (i in 1:(n-1))
{
for (j in (i+1):n)
{
a<-table.row.start(a)
dum <- paste('tau(',dimnames(t(x))[[2]][i])
dum <- paste(dum,',')
dum <- paste(dum,dimnames(t(x))[[2]][j])
dum <- paste(dum,')')
a<-table.element(a,dum,header=TRUE)
r <- cor.test(y[i,],y[j,],method='kendall')
a<-table.element(a,r$estimate)
a<-table.element(a,r$p.value)
a<-table.row.end(a)
}
}
a<-table.end(a)
table.save(a,file='mytable.tab')