Free Statistics

of Irreproducible Research!

Author's title

Author*The author of this computation has been verified*
R Software Modulerwasp_edabi.wasp
Title produced by softwareBivariate Explorative Data Analysis
Date of computationThu, 12 Nov 2009 08:11:36 -0700
Cite this page as followsStatistical Computations at FreeStatistics.org, Office for Research Development and Education, URL https://freestatistics.org/blog/index.php?v=date/2009/Nov/12/t1258038768ut6y35kiwd7nkrh.htm/, Retrieved Sat, 04 May 2024 21:56:31 +0000
Statistical Computations at FreeStatistics.org, Office for Research Development and Education, URL https://freestatistics.org/blog/index.php?pk=56105, Retrieved Sat, 04 May 2024 21:56:31 +0000
QR Codes:

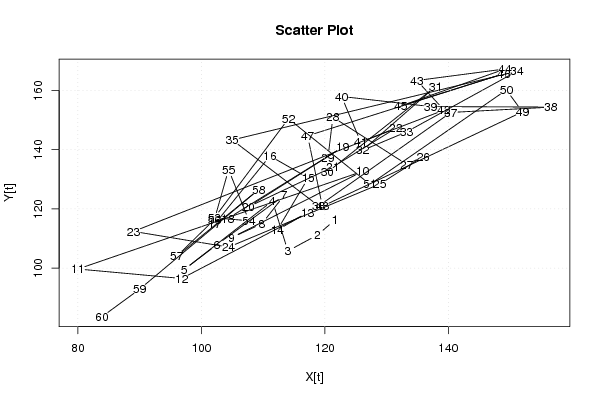
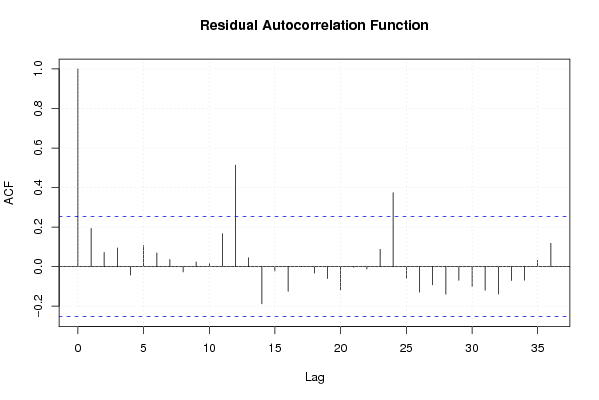
Original text written by user:Als we de waarde van b bekijken: 1,00.. kunnen we vanuit de theorie besluiten dat wanneer X(t) met 1% stijgt gaat ook Y(t) met 1% stijgen, wat de vorige vermoedens weer bevestigd. Wanneer we kijken naar de grafiek over e(t) kunnen we zien dat er een duidelijke fluctuatie is, die kan duiden op saisonaliteit. De histogram van de voorspellingsfout toont een verdeling waaruit we kunnen afleiden dat de gemiddelde van e(t) gelegen is rond de 0,wat een goed teken is. We vinden in de grafiek van e(t) wel een patroon terug, wat weer verwijst naar die saisonaliteit.
IsPrivate?No (this computation is public)
User-defined keywords
Estimated Impact202
Family? (F = Feedback message, R = changed R code, M = changed R Module, P = changed Parameters, D = changed Data)
-       [Bivariate Explorative Data Analysis] [Bivariate Explora...] [2009-11-12 15:11:36] [bef26de542bed2eafc60fe4615b06e47] [Current]
Feedback Forum

Post a new message
Dataseries X:
121.6
118.8
114.0
111.5
97.2
102.5
113.4
109.8
104.9
126.1
80.0
96.8
117.2
112.3
117.3
111.1
102.2
104.3
122.9
107.6
121.3
131.5
89.0
104.4
128.9
135.9
133.3
121.3
120.5
120.4
137.9
126.1
133.2
151.1
105.0
119.0
140.4
156.6
137.1
122.7
125.8
139.3
134.9
149.2
132.3
149.0
117.2
119.6
152.0
149.4
127.3
114.1
102.1
107.7
104.4
102.1
96.0
109.3
90.0
83.9
Dataseries Y:
116.2
111.2
105.8
122.7
99.5
107.9
124.6
115.0
110.3
132.7
99.7
96.5
118.7
112.9
130.5
137.9
115.0
116.8
140.9
120.7
134.2
147.3
112.4
107.1
128.4
137.7
135.0
151.0
137.4
132.4
161.3
139.8
146.0
166.5
143.3
121.0
152.6
154.4
154.6
158.0
142.6
153.4
163.4
167.3
154.8
165.7
144.7
120.9
152.8
160.2
128.3
150.5
117.0
116.0
133.3
116.4
104.0
126.6
92.9
83.6


Summary of computational transaction
Raw Inputview raw input (R code)
Raw Outputview raw output of R engine
Computing time4 seconds
R Server'Sir Ronald Aylmer Fisher' @ 193.190.124.24

\begin{tabular}{lllllllll}
\hline
Summary of computational transaction \tabularnewline
Raw Input & view raw input (R code)  \tabularnewline
Raw Output & view raw output of R engine  \tabularnewline
Computing time & 4 seconds \tabularnewline
R Server & 'Sir Ronald Aylmer Fisher' @ 193.190.124.24 \tabularnewline
\hline
\end{tabular}
%Source: https://freestatistics.org/blog/index.php?pk=56105&T=0

[TABLE]
[ROW][C]Summary of computational transaction[/C][/ROW]
[ROW][C]Raw Input[/C][C]view raw input (R code) [/C][/ROW]
[ROW][C]Raw Output[/C][C]view raw output of R engine [/C][/ROW]
[ROW][C]Computing time[/C][C]4 seconds[/C][/ROW]
[ROW][C]R Server[/C][C]'Sir Ronald Aylmer Fisher' @ 193.190.124.24[/C][/ROW]
[/TABLE]
Source: https://freestatistics.org/blog/index.php?pk=56105&T=0

Globally Unique Identifier (entire table): ba.freestatistics.org/blog/index.php?pk=56105&T=0

As an alternative you can also use a QR Code:  

The GUIDs for individual cells are displayed in the table below:

Summary of computational transaction
Raw Inputview raw input (R code)
Raw Outputview raw output of R engine
Computing time4 seconds
R Server'Sir Ronald Aylmer Fisher' @ 193.190.124.24


Model: Y[t] = c + b X[t] + e[t]
c11.1468674352683
b1.00684004008074

\begin{tabular}{lllllllll}
\hline
Model: Y[t] = c + b X[t] + e[t] \tabularnewline
c & 11.1468674352683 \tabularnewline
b & 1.00684004008074 \tabularnewline
\hline
\end{tabular}
%Source: https://freestatistics.org/blog/index.php?pk=56105&T=1

[TABLE]
[ROW][C]Model: Y[t] = c + b X[t] + e[t][/C][/ROW]
[ROW][C]c[/C][C]11.1468674352683[/C][/ROW]
[ROW][C]b[/C][C]1.00684004008074[/C][/ROW]
[/TABLE]
Source: https://freestatistics.org/blog/index.php?pk=56105&T=1

Globally Unique Identifier (entire table): ba.freestatistics.org/blog/index.php?pk=56105&T=1

As an alternative you can also use a QR Code:  

The GUIDs for individual cells are displayed in the table below:

Model: Y[t] = c + b X[t] + e[t]
c11.1468674352683
b1.00684004008074


Descriptive Statistics about e[t]
# observations60
minimum-20.1266320044728
Q1-9.62399754955638
median0.690877805143701
mean1.34701277909599e-16
Q35.40797790534554
maximum26.4349283562539

\begin{tabular}{lllllllll}
\hline
Descriptive Statistics about e[t] \tabularnewline
# observations & 60 \tabularnewline
minimum & -20.1266320044728 \tabularnewline
Q1 & -9.62399754955638 \tabularnewline
median & 0.690877805143701 \tabularnewline
mean & 1.34701277909599e-16 \tabularnewline
Q3 & 5.40797790534554 \tabularnewline
maximum & 26.4349283562539 \tabularnewline
\hline
\end{tabular}
%Source: https://freestatistics.org/blog/index.php?pk=56105&T=2

[TABLE]
[ROW][C]Descriptive Statistics about e[t][/C][/ROW]
[ROW][C]# observations[/C][C]60[/C][/ROW]
[ROW][C]minimum[/C][C]-20.1266320044728[/C][/ROW]
[ROW][C]Q1[/C][C]-9.62399754955638[/C][/ROW]
[ROW][C]median[/C][C]0.690877805143701[/C][/ROW]
[ROW][C]mean[/C][C]1.34701277909599e-16[/C][/ROW]
[ROW][C]Q3[/C][C]5.40797790534554[/C][/ROW]
[ROW][C]maximum[/C][C]26.4349283562539[/C][/ROW]
[/TABLE]
Source: https://freestatistics.org/blog/index.php?pk=56105&T=2

Globally Unique Identifier (entire table): ba.freestatistics.org/blog/index.php?pk=56105&T=2

As an alternative you can also use a QR Code:  

The GUIDs for individual cells are displayed in the table below:

Descriptive Statistics about e[t]
# observations60
minimum-20.1266320044728
Q1-9.62399754955638
median0.690877805143701
mean1.34701277909599e-16
Q35.40797790534554
maximum26.4349283562539


Parameters (Session):
par1 = 0 ;
Parameters (R input):
par1 = 0 ; par2 = 36 ;
R code (references can be found in the software module):
par1 <- as.numeric(par1)
par2 <- as.numeric(par2)
x <- as.ts(x)
y <- as.ts(y)
mylm <- lm(y~x)
cbind(mylm$resid)
library(lattice)
bitmap(file='pic1.png')
plot(y,type='l',main='Run Sequence Plot of Y[t]',xlab='time or index',ylab='value')
grid()
dev.off()
bitmap(file='pic1a.png')
plot(x,type='l',main='Run Sequence Plot of X[t]',xlab='time or index',ylab='value')
grid()
dev.off()
bitmap(file='pic1b.png')
plot(x,y,main='Scatter Plot',xlab='X[t]',ylab='Y[t]')
grid()
dev.off()
bitmap(file='pic1c.png')
plot(mylm$resid,type='l',main='Run Sequence Plot of e[t]',xlab='time or index',ylab='value')
grid()
dev.off()
bitmap(file='pic2.png')
hist(mylm$resid,main='Histogram of e[t]')
dev.off()
bitmap(file='pic3.png')
if (par1 > 0)
{
densityplot(~mylm$resid,col='black',main=paste('Density Plot of e[t] bw = ',par1),bw=par1)
} else {
densityplot(~mylm$resid,col='black',main='Density Plot of e[t]')
}
dev.off()
bitmap(file='pic4.png')
qqnorm(mylm$resid,main='QQ plot of e[t]')
qqline(mylm$resid)
grid()
dev.off()
if (par2 > 0)
{
bitmap(file='pic5.png')
acf(mylm$resid,lag.max=par2,main='Residual Autocorrelation Function')
grid()
dev.off()
}
summary(x)
load(file='createtable')
a<-table.start()
a<-table.row.start(a)
a<-table.element(a,'Model: Y[t] = c + b X[t] + e[t]',2,TRUE)
a<-table.row.end(a)
a<-table.row.start(a)
a<-table.element(a,'c',1,TRUE)
a<-table.element(a,mylm$coeff[[1]])
a<-table.row.end(a)
a<-table.row.start(a)
a<-table.element(a,'b',1,TRUE)
a<-table.element(a,mylm$coeff[[2]])
a<-table.row.end(a)
a<-table.end(a)
table.save(a,file='mytable.tab')
a<-table.start()
a<-table.row.start(a)
a<-table.element(a,'Descriptive Statistics about e[t]',2,TRUE)
a<-table.row.end(a)
a<-table.row.start(a)
a<-table.element(a,'# observations',header=TRUE)
a<-table.element(a,length(mylm$resid))
a<-table.row.end(a)
a<-table.row.start(a)
a<-table.element(a,'minimum',header=TRUE)
a<-table.element(a,min(mylm$resid))
a<-table.row.end(a)
a<-table.row.start(a)
a<-table.element(a,'Q1',header=TRUE)
a<-table.element(a,quantile(mylm$resid,0.25))
a<-table.row.end(a)
a<-table.row.start(a)
a<-table.element(a,'median',header=TRUE)
a<-table.element(a,median(mylm$resid))
a<-table.row.end(a)
a<-table.row.start(a)
a<-table.element(a,'mean',header=TRUE)
a<-table.element(a,mean(mylm$resid))
a<-table.row.end(a)
a<-table.row.start(a)
a<-table.element(a,'Q3',header=TRUE)
a<-table.element(a,quantile(mylm$resid,0.75))
a<-table.row.end(a)
a<-table.row.start(a)
a<-table.element(a,'maximum',header=TRUE)
a<-table.element(a,max(mylm$resid))
a<-table.row.end(a)
a<-table.end(a)
table.save(a,file='mytable.tab')