Free Statistics

of Irreproducible Research!

Author's title

Author*The author of this computation has been verified*
R Software Modulerwasp_multipleregression.wasp
Title produced by softwareMultiple Regression
Date of computationSat, 14 Nov 2009 06:01:08 -0700
Cite this page as followsStatistical Computations at FreeStatistics.org, Office for Research Development and Education, URL https://freestatistics.org/blog/index.php?v=date/2009/Nov/14/t1258203886uim51hukqon4dy6.htm/, Retrieved Sun, 28 Apr 2024 04:18:00 +0000
Statistical Computations at FreeStatistics.org, Office for Research Development and Education, URL https://freestatistics.org/blog/index.php?pk=57221, Retrieved Sun, 28 Apr 2024 04:18:00 +0000
QR Codes:

Original text written by user:
IsPrivate?No (this computation is public)
User-defined keywords
Estimated Impact290
Family? (F = Feedback message, R = changed R code, M = changed R Module, P = changed Parameters, D = changed Data)
-     [Multiple Regression] [Q1 The Seatbeltlaw] [2007-11-14 19:27:43] [8cd6641b921d30ebe00b648d1481bba0]
- RMPD  [Multiple Regression] [Seatbelt] [2009-11-12 13:54:52] [b98453cac15ba1066b407e146608df68]
-    D      [Multiple Regression] [WS 7 1] [2009-11-14 13:01:08] [2e4ef2c1b76db9b31c0a03b96e94ad77] [Current]
Feedback Forum

Post a new message
Dataseries X:
103,63	100,30
103,64	98,50
103,66	95,10
103,77	93,10
103,88	92,20
103,91	89,00
103,91	86,40
103,92	84,50
104,05	82,70
104,23	80,80
104,30	81,80
104,31	81,80
104,31	82,90
104,34	83,80
104,55	86,20
104,65	86,10
104,73	86,20
104,75	88,80
104,75	89,60
104,76	87,80
104,94	88,30
105,29	88,60
105,38	91,00
105,43	91,50
105,43	95,40
105,42	98,70
105,52	99,90
105,69	98,60
105,72	100,30
105,74	100,20
105,74	100,40
105,74	101,40
105,95	103,00
106,17	109,10
106,34	111,40
106,37	114,10
106,37	121,80
106,36	127,60
106,44	129,90
106,29	128,00
106,23	123,50
106,23	124,00
106,23	127,40
106,23	127,60
106,34	128,40
106,44	131,40
106,44	135,10
106,48	134,00
106,50	144,50
106,57	147,30
106,40	150,90
106,37	148,70
106,25	141,40
106,21	138,90
106,21	139,80
106,24	145,60
106,19	147,90
106,08	148,50
106,13	151,10
106,09	157,50


Summary of computational transaction
Raw Inputview raw input (R code)
Raw Outputview raw output of R engine
Computing time3 seconds
R Server'Gwilym Jenkins' @ 72.249.127.135

\begin{tabular}{lllllllll}
\hline
Summary of computational transaction \tabularnewline
Raw Input & view raw input (R code)  \tabularnewline
Raw Output & view raw output of R engine  \tabularnewline
Computing time & 3 seconds \tabularnewline
R Server & 'Gwilym Jenkins' @ 72.249.127.135 \tabularnewline
\hline
\end{tabular}
%Source: https://freestatistics.org/blog/index.php?pk=57221&T=0

[TABLE]
[ROW][C]Summary of computational transaction[/C][/ROW]
[ROW][C]Raw Input[/C][C]view raw input (R code) [/C][/ROW]
[ROW][C]Raw Output[/C][C]view raw output of R engine [/C][/ROW]
[ROW][C]Computing time[/C][C]3 seconds[/C][/ROW]
[ROW][C]R Server[/C][C]'Gwilym Jenkins' @ 72.249.127.135[/C][/ROW]
[/TABLE]
Source: https://freestatistics.org/blog/index.php?pk=57221&T=0

Globally Unique Identifier (entire table): ba.freestatistics.org/blog/index.php?pk=57221&T=0

As an alternative you can also use a QR Code:  

The GUIDs for individual cells are displayed in the table below:

Summary of computational transaction
Raw Inputview raw input (R code)
Raw Outputview raw output of R engine
Computing time3 seconds
R Server'Gwilym Jenkins' @ 72.249.127.135


Multiple Linear Regression - Estimated Regression Equation
Y[t] = + 101.845973199319 + 0.0324017875946746X[t] + e[t]

\begin{tabular}{lllllllll}
\hline
Multiple Linear Regression - Estimated Regression Equation \tabularnewline
Y[t] =  +  101.845973199319 +  0.0324017875946746X[t]  + e[t] \tabularnewline
\hline
\end{tabular}
%Source: https://freestatistics.org/blog/index.php?pk=57221&T=1

[TABLE]
[ROW][C]Multiple Linear Regression - Estimated Regression Equation[/C][/ROW]
[ROW][C]Y[t] =  +  101.845973199319 +  0.0324017875946746X[t]  + e[t][/C][/ROW]
[/TABLE]
Source: https://freestatistics.org/blog/index.php?pk=57221&T=1

Globally Unique Identifier (entire table): ba.freestatistics.org/blog/index.php?pk=57221&T=1

As an alternative you can also use a QR Code:  

The GUIDs for individual cells are displayed in the table below:

Multiple Linear Regression - Estimated Regression Equation
Y[t] = + 101.845973199319 + 0.0324017875946746X[t] + e[t]


Multiple Linear Regression - Ordinary Least Squares
VariableParameterS.D.T-STATH0: parameter = 02-tail p-value1-tail p-value
(Intercept)101.8459731993190.360874282.220100
X0.03240178759467460.00318410.176900

\begin{tabular}{lllllllll}
\hline
Multiple Linear Regression - Ordinary Least Squares \tabularnewline
Variable & Parameter & S.D. & T-STATH0: parameter = 0 & 2-tail p-value & 1-tail p-value \tabularnewline
(Intercept) & 101.845973199319 & 0.360874 & 282.2201 & 0 & 0 \tabularnewline
X & 0.0324017875946746 & 0.003184 & 10.1769 & 0 & 0 \tabularnewline
\hline
\end{tabular}
%Source: https://freestatistics.org/blog/index.php?pk=57221&T=2

[TABLE]
[ROW][C]Multiple Linear Regression - Ordinary Least Squares[/C][/ROW]
[ROW][C]Variable[/C][C]Parameter[/C][C]S.D.[/C][C]T-STATH0: parameter = 0[/C][C]2-tail p-value[/C][C]1-tail p-value[/C][/ROW]
[ROW][C](Intercept)[/C][C]101.845973199319[/C][C]0.360874[/C][C]282.2201[/C][C]0[/C][C]0[/C][/ROW]
[ROW][C]X[/C][C]0.0324017875946746[/C][C]0.003184[/C][C]10.1769[/C][C]0[/C][C]0[/C][/ROW]
[/TABLE]
Source: https://freestatistics.org/blog/index.php?pk=57221&T=2

Globally Unique Identifier (entire table): ba.freestatistics.org/blog/index.php?pk=57221&T=2

As an alternative you can also use a QR Code:  

The GUIDs for individual cells are displayed in the table below:

Multiple Linear Regression - Ordinary Least Squares
VariableParameterS.D.T-STATH0: parameter = 02-tail p-value1-tail p-value
(Intercept)101.8459731993190.360874282.220100
X0.03240178759467460.00318410.176900


Multiple Linear Regression - Regression Statistics
Multiple R0.800637011015123
R-squared0.64101962340723
Adjusted R-squared0.634830306569423
F-TEST (value)103.568720135908
F-TEST (DF numerator)1
F-TEST (DF denominator)58
p-value1.62092561595273e-14
Multiple Linear Regression - Residual Statistics
Residual Standard Deviation0.58459632829669
Sum Squared Residuals19.8216662893624

\begin{tabular}{lllllllll}
\hline
Multiple Linear Regression - Regression Statistics \tabularnewline
Multiple R & 0.800637011015123 \tabularnewline
R-squared & 0.64101962340723 \tabularnewline
Adjusted R-squared & 0.634830306569423 \tabularnewline
F-TEST (value) & 103.568720135908 \tabularnewline
F-TEST (DF numerator) & 1 \tabularnewline
F-TEST (DF denominator) & 58 \tabularnewline
p-value & 1.62092561595273e-14 \tabularnewline
Multiple Linear Regression - Residual Statistics \tabularnewline
Residual Standard Deviation & 0.58459632829669 \tabularnewline
Sum Squared Residuals & 19.8216662893624 \tabularnewline
\hline
\end{tabular}
%Source: https://freestatistics.org/blog/index.php?pk=57221&T=3

[TABLE]
[ROW][C]Multiple Linear Regression - Regression Statistics[/C][/ROW]
[ROW][C]Multiple R[/C][C]0.800637011015123[/C][/ROW]
[ROW][C]R-squared[/C][C]0.64101962340723[/C][/ROW]
[ROW][C]Adjusted R-squared[/C][C]0.634830306569423[/C][/ROW]
[ROW][C]F-TEST (value)[/C][C]103.568720135908[/C][/ROW]
[ROW][C]F-TEST (DF numerator)[/C][C]1[/C][/ROW]
[ROW][C]F-TEST (DF denominator)[/C][C]58[/C][/ROW]
[ROW][C]p-value[/C][C]1.62092561595273e-14[/C][/ROW]
[ROW][C]Multiple Linear Regression - Residual Statistics[/C][/ROW]
[ROW][C]Residual Standard Deviation[/C][C]0.58459632829669[/C][/ROW]
[ROW][C]Sum Squared Residuals[/C][C]19.8216662893624[/C][/ROW]
[/TABLE]
Source: https://freestatistics.org/blog/index.php?pk=57221&T=3

Globally Unique Identifier (entire table): ba.freestatistics.org/blog/index.php?pk=57221&T=3

As an alternative you can also use a QR Code:  

The GUIDs for individual cells are displayed in the table below:

Multiple Linear Regression - Regression Statistics
Multiple R0.800637011015123
R-squared0.64101962340723
Adjusted R-squared0.634830306569423
F-TEST (value)103.568720135908
F-TEST (DF numerator)1
F-TEST (DF denominator)58
p-value1.62092561595273e-14
Multiple Linear Regression - Residual Statistics
Residual Standard Deviation0.58459632829669
Sum Squared Residuals19.8216662893624


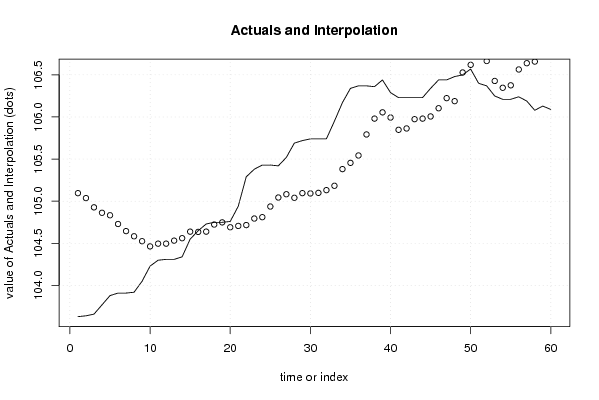
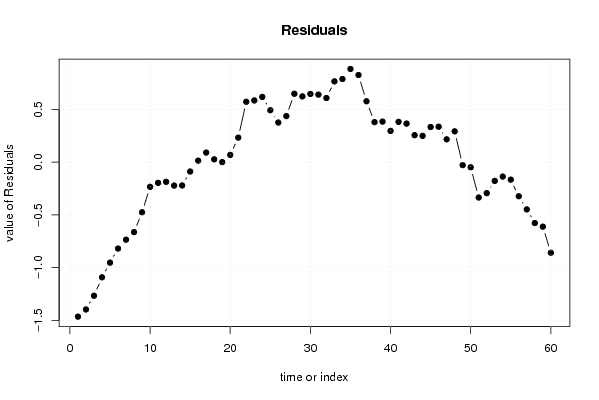
Multiple Linear Regression - Actuals, Interpolation, and Residuals
Time or IndexActualsInterpolationForecastResidualsPrediction Error
1103.63105.095872495065-1.46587249506480
2103.64105.037549277394-1.39754927739437
3103.66104.927383199572-1.26738319957248
4103.77104.862579624383-1.09257962438313
5103.88104.833418015548-0.953418015547927
6103.91104.729732295245-0.819732295244966
7103.91104.645487647499-0.735487647498813
8103.92104.583924251069-0.663924251068925
9104.05104.525601033399-0.475601033398516
10104.23104.464037636969-0.234037636968627
11104.3104.496439424563-0.196439424563308
12104.31104.496439424563-0.186439424563303
13104.31104.532081390917-0.222081390917445
14104.34104.561242999753-0.221242999752651
15104.55104.639007289980-0.0890072899798771
16104.65104.6357671112200.0142328887795992
17104.73104.6390072899800.0909927100201297
18104.75104.7232519377260.026748062273972
19104.75104.7491733678020.000826632198232341
20104.76104.6908501501310.0691498498686516
21104.94104.7070510439290.232948956071307
22105.29104.7167715802070.573228419792913
23105.38104.7945358704340.585464129565683
24105.43104.8107367642320.619263235768357
25105.43104.9371037358510.492896264149126
26105.42105.0440296349130.375970365086694
27105.52105.0829117800270.437088219973079
28105.69105.0407894561540.649210543846158
29105.72105.0958724950650.624127504935212
30105.74105.0926323163050.647367683694675
31105.74105.0991126738240.64088732617574
32105.74105.1315144614190.608485538581066
33105.95105.1833573215700.766642678429594
34106.17105.3810082258980.788991774102078
35106.34105.4555323373660.884467662634328
36106.37105.5430171638710.826982836128708
37106.37105.7925109283500.577489071649713
38106.36105.9804412963990.379558703600595
39106.44106.0549654078670.385034592132841
40106.29105.9934020114370.296597988562731
41106.23105.8475939672610.382406032738765
42106.23105.8637948610590.366205138941428
43106.23105.9739609388800.256039061119534
44106.23105.9804412963990.249558703600599
45106.34106.0063627264750.333637273524858
46106.44106.1035680892590.336431910740829
47106.44106.2234547033590.216545296640533
48106.48106.1878127370050.292187262994681
49106.5106.528031506749-0.0280315067494068
50106.57106.618756512014-0.0487565120145032
51106.4106.735402947355-0.335402947355319
52106.37106.664119014647-0.294119014647036
53106.25106.427585965206-0.177585965205916
54106.21106.346581496219-0.136581496219235
55106.21106.375743105054-0.165743105054443
56106.24106.563673473104-0.323673473103554
57106.19106.638197584571-0.448197584571303
58106.08106.657638657128-0.577638657128107
59106.13106.741883304874-0.611883304874264
60106.09106.949254745480-0.859254745480174

\begin{tabular}{lllllllll}
\hline
Multiple Linear Regression - Actuals, Interpolation, and Residuals \tabularnewline
Time or Index & Actuals & InterpolationForecast & ResidualsPrediction Error \tabularnewline
1 & 103.63 & 105.095872495065 & -1.46587249506480 \tabularnewline
2 & 103.64 & 105.037549277394 & -1.39754927739437 \tabularnewline
3 & 103.66 & 104.927383199572 & -1.26738319957248 \tabularnewline
4 & 103.77 & 104.862579624383 & -1.09257962438313 \tabularnewline
5 & 103.88 & 104.833418015548 & -0.953418015547927 \tabularnewline
6 & 103.91 & 104.729732295245 & -0.819732295244966 \tabularnewline
7 & 103.91 & 104.645487647499 & -0.735487647498813 \tabularnewline
8 & 103.92 & 104.583924251069 & -0.663924251068925 \tabularnewline
9 & 104.05 & 104.525601033399 & -0.475601033398516 \tabularnewline
10 & 104.23 & 104.464037636969 & -0.234037636968627 \tabularnewline
11 & 104.3 & 104.496439424563 & -0.196439424563308 \tabularnewline
12 & 104.31 & 104.496439424563 & -0.186439424563303 \tabularnewline
13 & 104.31 & 104.532081390917 & -0.222081390917445 \tabularnewline
14 & 104.34 & 104.561242999753 & -0.221242999752651 \tabularnewline
15 & 104.55 & 104.639007289980 & -0.0890072899798771 \tabularnewline
16 & 104.65 & 104.635767111220 & 0.0142328887795992 \tabularnewline
17 & 104.73 & 104.639007289980 & 0.0909927100201297 \tabularnewline
18 & 104.75 & 104.723251937726 & 0.026748062273972 \tabularnewline
19 & 104.75 & 104.749173367802 & 0.000826632198232341 \tabularnewline
20 & 104.76 & 104.690850150131 & 0.0691498498686516 \tabularnewline
21 & 104.94 & 104.707051043929 & 0.232948956071307 \tabularnewline
22 & 105.29 & 104.716771580207 & 0.573228419792913 \tabularnewline
23 & 105.38 & 104.794535870434 & 0.585464129565683 \tabularnewline
24 & 105.43 & 104.810736764232 & 0.619263235768357 \tabularnewline
25 & 105.43 & 104.937103735851 & 0.492896264149126 \tabularnewline
26 & 105.42 & 105.044029634913 & 0.375970365086694 \tabularnewline
27 & 105.52 & 105.082911780027 & 0.437088219973079 \tabularnewline
28 & 105.69 & 105.040789456154 & 0.649210543846158 \tabularnewline
29 & 105.72 & 105.095872495065 & 0.624127504935212 \tabularnewline
30 & 105.74 & 105.092632316305 & 0.647367683694675 \tabularnewline
31 & 105.74 & 105.099112673824 & 0.64088732617574 \tabularnewline
32 & 105.74 & 105.131514461419 & 0.608485538581066 \tabularnewline
33 & 105.95 & 105.183357321570 & 0.766642678429594 \tabularnewline
34 & 106.17 & 105.381008225898 & 0.788991774102078 \tabularnewline
35 & 106.34 & 105.455532337366 & 0.884467662634328 \tabularnewline
36 & 106.37 & 105.543017163871 & 0.826982836128708 \tabularnewline
37 & 106.37 & 105.792510928350 & 0.577489071649713 \tabularnewline
38 & 106.36 & 105.980441296399 & 0.379558703600595 \tabularnewline
39 & 106.44 & 106.054965407867 & 0.385034592132841 \tabularnewline
40 & 106.29 & 105.993402011437 & 0.296597988562731 \tabularnewline
41 & 106.23 & 105.847593967261 & 0.382406032738765 \tabularnewline
42 & 106.23 & 105.863794861059 & 0.366205138941428 \tabularnewline
43 & 106.23 & 105.973960938880 & 0.256039061119534 \tabularnewline
44 & 106.23 & 105.980441296399 & 0.249558703600599 \tabularnewline
45 & 106.34 & 106.006362726475 & 0.333637273524858 \tabularnewline
46 & 106.44 & 106.103568089259 & 0.336431910740829 \tabularnewline
47 & 106.44 & 106.223454703359 & 0.216545296640533 \tabularnewline
48 & 106.48 & 106.187812737005 & 0.292187262994681 \tabularnewline
49 & 106.5 & 106.528031506749 & -0.0280315067494068 \tabularnewline
50 & 106.57 & 106.618756512014 & -0.0487565120145032 \tabularnewline
51 & 106.4 & 106.735402947355 & -0.335402947355319 \tabularnewline
52 & 106.37 & 106.664119014647 & -0.294119014647036 \tabularnewline
53 & 106.25 & 106.427585965206 & -0.177585965205916 \tabularnewline
54 & 106.21 & 106.346581496219 & -0.136581496219235 \tabularnewline
55 & 106.21 & 106.375743105054 & -0.165743105054443 \tabularnewline
56 & 106.24 & 106.563673473104 & -0.323673473103554 \tabularnewline
57 & 106.19 & 106.638197584571 & -0.448197584571303 \tabularnewline
58 & 106.08 & 106.657638657128 & -0.577638657128107 \tabularnewline
59 & 106.13 & 106.741883304874 & -0.611883304874264 \tabularnewline
60 & 106.09 & 106.949254745480 & -0.859254745480174 \tabularnewline
\hline
\end{tabular}
%Source: https://freestatistics.org/blog/index.php?pk=57221&T=4

[TABLE]
[ROW][C]Multiple Linear Regression - Actuals, Interpolation, and Residuals[/C][/ROW]
[ROW][C]Time or Index[/C][C]Actuals[/C][C]InterpolationForecast[/C][C]ResidualsPrediction Error[/C][/ROW]
[ROW][C]1[/C][C]103.63[/C][C]105.095872495065[/C][C]-1.46587249506480[/C][/ROW]
[ROW][C]2[/C][C]103.64[/C][C]105.037549277394[/C][C]-1.39754927739437[/C][/ROW]
[ROW][C]3[/C][C]103.66[/C][C]104.927383199572[/C][C]-1.26738319957248[/C][/ROW]
[ROW][C]4[/C][C]103.77[/C][C]104.862579624383[/C][C]-1.09257962438313[/C][/ROW]
[ROW][C]5[/C][C]103.88[/C][C]104.833418015548[/C][C]-0.953418015547927[/C][/ROW]
[ROW][C]6[/C][C]103.91[/C][C]104.729732295245[/C][C]-0.819732295244966[/C][/ROW]
[ROW][C]7[/C][C]103.91[/C][C]104.645487647499[/C][C]-0.735487647498813[/C][/ROW]
[ROW][C]8[/C][C]103.92[/C][C]104.583924251069[/C][C]-0.663924251068925[/C][/ROW]
[ROW][C]9[/C][C]104.05[/C][C]104.525601033399[/C][C]-0.475601033398516[/C][/ROW]
[ROW][C]10[/C][C]104.23[/C][C]104.464037636969[/C][C]-0.234037636968627[/C][/ROW]
[ROW][C]11[/C][C]104.3[/C][C]104.496439424563[/C][C]-0.196439424563308[/C][/ROW]
[ROW][C]12[/C][C]104.31[/C][C]104.496439424563[/C][C]-0.186439424563303[/C][/ROW]
[ROW][C]13[/C][C]104.31[/C][C]104.532081390917[/C][C]-0.222081390917445[/C][/ROW]
[ROW][C]14[/C][C]104.34[/C][C]104.561242999753[/C][C]-0.221242999752651[/C][/ROW]
[ROW][C]15[/C][C]104.55[/C][C]104.639007289980[/C][C]-0.0890072899798771[/C][/ROW]
[ROW][C]16[/C][C]104.65[/C][C]104.635767111220[/C][C]0.0142328887795992[/C][/ROW]
[ROW][C]17[/C][C]104.73[/C][C]104.639007289980[/C][C]0.0909927100201297[/C][/ROW]
[ROW][C]18[/C][C]104.75[/C][C]104.723251937726[/C][C]0.026748062273972[/C][/ROW]
[ROW][C]19[/C][C]104.75[/C][C]104.749173367802[/C][C]0.000826632198232341[/C][/ROW]
[ROW][C]20[/C][C]104.76[/C][C]104.690850150131[/C][C]0.0691498498686516[/C][/ROW]
[ROW][C]21[/C][C]104.94[/C][C]104.707051043929[/C][C]0.232948956071307[/C][/ROW]
[ROW][C]22[/C][C]105.29[/C][C]104.716771580207[/C][C]0.573228419792913[/C][/ROW]
[ROW][C]23[/C][C]105.38[/C][C]104.794535870434[/C][C]0.585464129565683[/C][/ROW]
[ROW][C]24[/C][C]105.43[/C][C]104.810736764232[/C][C]0.619263235768357[/C][/ROW]
[ROW][C]25[/C][C]105.43[/C][C]104.937103735851[/C][C]0.492896264149126[/C][/ROW]
[ROW][C]26[/C][C]105.42[/C][C]105.044029634913[/C][C]0.375970365086694[/C][/ROW]
[ROW][C]27[/C][C]105.52[/C][C]105.082911780027[/C][C]0.437088219973079[/C][/ROW]
[ROW][C]28[/C][C]105.69[/C][C]105.040789456154[/C][C]0.649210543846158[/C][/ROW]
[ROW][C]29[/C][C]105.72[/C][C]105.095872495065[/C][C]0.624127504935212[/C][/ROW]
[ROW][C]30[/C][C]105.74[/C][C]105.092632316305[/C][C]0.647367683694675[/C][/ROW]
[ROW][C]31[/C][C]105.74[/C][C]105.099112673824[/C][C]0.64088732617574[/C][/ROW]
[ROW][C]32[/C][C]105.74[/C][C]105.131514461419[/C][C]0.608485538581066[/C][/ROW]
[ROW][C]33[/C][C]105.95[/C][C]105.183357321570[/C][C]0.766642678429594[/C][/ROW]
[ROW][C]34[/C][C]106.17[/C][C]105.381008225898[/C][C]0.788991774102078[/C][/ROW]
[ROW][C]35[/C][C]106.34[/C][C]105.455532337366[/C][C]0.884467662634328[/C][/ROW]
[ROW][C]36[/C][C]106.37[/C][C]105.543017163871[/C][C]0.826982836128708[/C][/ROW]
[ROW][C]37[/C][C]106.37[/C][C]105.792510928350[/C][C]0.577489071649713[/C][/ROW]
[ROW][C]38[/C][C]106.36[/C][C]105.980441296399[/C][C]0.379558703600595[/C][/ROW]
[ROW][C]39[/C][C]106.44[/C][C]106.054965407867[/C][C]0.385034592132841[/C][/ROW]
[ROW][C]40[/C][C]106.29[/C][C]105.993402011437[/C][C]0.296597988562731[/C][/ROW]
[ROW][C]41[/C][C]106.23[/C][C]105.847593967261[/C][C]0.382406032738765[/C][/ROW]
[ROW][C]42[/C][C]106.23[/C][C]105.863794861059[/C][C]0.366205138941428[/C][/ROW]
[ROW][C]43[/C][C]106.23[/C][C]105.973960938880[/C][C]0.256039061119534[/C][/ROW]
[ROW][C]44[/C][C]106.23[/C][C]105.980441296399[/C][C]0.249558703600599[/C][/ROW]
[ROW][C]45[/C][C]106.34[/C][C]106.006362726475[/C][C]0.333637273524858[/C][/ROW]
[ROW][C]46[/C][C]106.44[/C][C]106.103568089259[/C][C]0.336431910740829[/C][/ROW]
[ROW][C]47[/C][C]106.44[/C][C]106.223454703359[/C][C]0.216545296640533[/C][/ROW]
[ROW][C]48[/C][C]106.48[/C][C]106.187812737005[/C][C]0.292187262994681[/C][/ROW]
[ROW][C]49[/C][C]106.5[/C][C]106.528031506749[/C][C]-0.0280315067494068[/C][/ROW]
[ROW][C]50[/C][C]106.57[/C][C]106.618756512014[/C][C]-0.0487565120145032[/C][/ROW]
[ROW][C]51[/C][C]106.4[/C][C]106.735402947355[/C][C]-0.335402947355319[/C][/ROW]
[ROW][C]52[/C][C]106.37[/C][C]106.664119014647[/C][C]-0.294119014647036[/C][/ROW]
[ROW][C]53[/C][C]106.25[/C][C]106.427585965206[/C][C]-0.177585965205916[/C][/ROW]
[ROW][C]54[/C][C]106.21[/C][C]106.346581496219[/C][C]-0.136581496219235[/C][/ROW]
[ROW][C]55[/C][C]106.21[/C][C]106.375743105054[/C][C]-0.165743105054443[/C][/ROW]
[ROW][C]56[/C][C]106.24[/C][C]106.563673473104[/C][C]-0.323673473103554[/C][/ROW]
[ROW][C]57[/C][C]106.19[/C][C]106.638197584571[/C][C]-0.448197584571303[/C][/ROW]
[ROW][C]58[/C][C]106.08[/C][C]106.657638657128[/C][C]-0.577638657128107[/C][/ROW]
[ROW][C]59[/C][C]106.13[/C][C]106.741883304874[/C][C]-0.611883304874264[/C][/ROW]
[ROW][C]60[/C][C]106.09[/C][C]106.949254745480[/C][C]-0.859254745480174[/C][/ROW]
[/TABLE]
Source: https://freestatistics.org/blog/index.php?pk=57221&T=4

Globally Unique Identifier (entire table): ba.freestatistics.org/blog/index.php?pk=57221&T=4

As an alternative you can also use a QR Code:  

The GUIDs for individual cells are displayed in the table below:

Multiple Linear Regression - Actuals, Interpolation, and Residuals
Time or IndexActualsInterpolationForecastResidualsPrediction Error
1103.63105.095872495065-1.46587249506480
2103.64105.037549277394-1.39754927739437
3103.66104.927383199572-1.26738319957248
4103.77104.862579624383-1.09257962438313
5103.88104.833418015548-0.953418015547927
6103.91104.729732295245-0.819732295244966
7103.91104.645487647499-0.735487647498813
8103.92104.583924251069-0.663924251068925
9104.05104.525601033399-0.475601033398516
10104.23104.464037636969-0.234037636968627
11104.3104.496439424563-0.196439424563308
12104.31104.496439424563-0.186439424563303
13104.31104.532081390917-0.222081390917445
14104.34104.561242999753-0.221242999752651
15104.55104.639007289980-0.0890072899798771
16104.65104.6357671112200.0142328887795992
17104.73104.6390072899800.0909927100201297
18104.75104.7232519377260.026748062273972
19104.75104.7491733678020.000826632198232341
20104.76104.6908501501310.0691498498686516
21104.94104.7070510439290.232948956071307
22105.29104.7167715802070.573228419792913
23105.38104.7945358704340.585464129565683
24105.43104.8107367642320.619263235768357
25105.43104.9371037358510.492896264149126
26105.42105.0440296349130.375970365086694
27105.52105.0829117800270.437088219973079
28105.69105.0407894561540.649210543846158
29105.72105.0958724950650.624127504935212
30105.74105.0926323163050.647367683694675
31105.74105.0991126738240.64088732617574
32105.74105.1315144614190.608485538581066
33105.95105.1833573215700.766642678429594
34106.17105.3810082258980.788991774102078
35106.34105.4555323373660.884467662634328
36106.37105.5430171638710.826982836128708
37106.37105.7925109283500.577489071649713
38106.36105.9804412963990.379558703600595
39106.44106.0549654078670.385034592132841
40106.29105.9934020114370.296597988562731
41106.23105.8475939672610.382406032738765
42106.23105.8637948610590.366205138941428
43106.23105.9739609388800.256039061119534
44106.23105.9804412963990.249558703600599
45106.34106.0063627264750.333637273524858
46106.44106.1035680892590.336431910740829
47106.44106.2234547033590.216545296640533
48106.48106.1878127370050.292187262994681
49106.5106.528031506749-0.0280315067494068
50106.57106.618756512014-0.0487565120145032
51106.4106.735402947355-0.335402947355319
52106.37106.664119014647-0.294119014647036
53106.25106.427585965206-0.177585965205916
54106.21106.346581496219-0.136581496219235
55106.21106.375743105054-0.165743105054443
56106.24106.563673473104-0.323673473103554
57106.19106.638197584571-0.448197584571303
58106.08106.657638657128-0.577638657128107
59106.13106.741883304874-0.611883304874264
60106.09106.949254745480-0.859254745480174


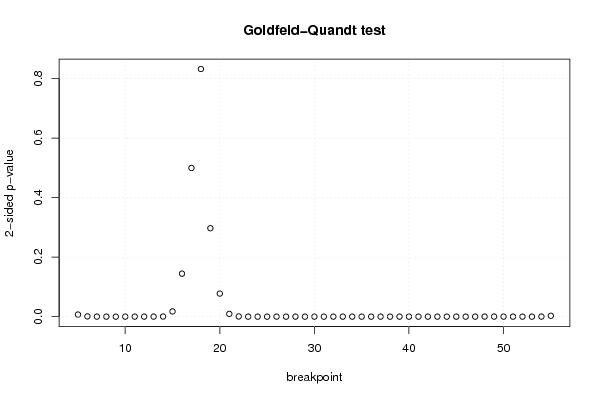
Goldfeld-Quandt test for Heteroskedasticity
p-valuesAlternative Hypothesis
breakpoint indexgreater2-sidedless
50.003531900852786270.007063801705572540.996468099147214
60.0004759627313783160.0009519254627566330.999524037268622
79.76489486426595e-050.0001952978972853190.999902351051357
82.54017830116207e-055.08035660232414e-050.999974598216988
95.45945213473123e-061.09189042694625e-050.999994540547865
101.30048312140784e-052.60096624281569e-050.999986995168786
114.60562124556479e-059.21124249112957e-050.999953943787544
125.60890404279288e-050.0001121780808558580.999943910959572
137.94211420511616e-050.0001588422841023230.99992057885795
140.0001932006481126910.0003864012962253810.999806799351887
150.008790907888307820.01758181577661560.991209092111692
160.07227006369894940.1445401273978990.92772993630105
170.2498707839200060.4997415678400120.750129216079994
180.5837189292599090.8325621414801810.416281070740091
190.8513619261181070.2972761477637850.148638073881893
200.9612341873880.07753162522399870.0387658126119994
210.9953436611584180.009312677683164220.00465633884158211
220.9996900009799590.0006199980400826170.000309999020041309
230.99998112086153.77582770001261e-051.88791385000630e-05
240.9999979779691654.0440616693207e-062.02203083466035e-06
250.9999997767910374.46417926142944e-072.23208963071472e-07
260.999999976304814.73903783442113e-082.36951891721056e-08
270.9999999959418188.11636350331531e-094.05818175165766e-09
280.9999999981850243.62995130718905e-091.81497565359452e-09
290.999999998981682.03664028809581e-091.01832014404791e-09
300.9999999994516291.09674264922134e-095.48371324610669e-10
310.9999999998326653.34670152761284e-101.67335076380642e-10
320.9999999999903681.92645708574254e-119.6322854287127e-12
330.9999999999982633.47488330103234e-121.73744165051617e-12
340.9999999999968866.22712989073223e-123.11356494536612e-12
350.9999999999857382.85249216238025e-111.42624608119012e-11
360.9999999999297371.4052575431908e-107.026287715954e-11
370.9999999996884926.23016730731018e-103.11508365365509e-10
380.9999999988426342.31473134142511e-091.15736567071256e-09
390.9999999968159786.36804440198637e-093.18402220099319e-09
400.9999999870842532.58314938390459e-081.29157469195230e-08
410.999999955494348.90113211704709e-084.45056605852354e-08
420.9999998654819722.69036056203165e-071.34518028101583e-07
430.9999996470304137.05939174139923e-073.52969587069961e-07
440.9999992868822361.42623552745598e-067.13117763727992e-07
450.9999976733195224.65336095611723e-062.32668047805862e-06
460.99999068475041.86304991985127e-059.31524959925635e-06
470.9999669558543876.6088291226802e-053.3044145613401e-05
480.9999025231255260.0001949537489472899.74768744736445e-05
490.9998752261486060.0002495477027885230.000124773851394262
500.999976303341494.73933170194155e-052.36966585097078e-05
510.9999868819378342.62361243313835e-051.31180621656918e-05
520.9999988112992832.37740143354248e-061.18870071677124e-06
530.9999889648546052.20702907890516e-051.10351453945258e-05
540.9998668517656070.0002662964687861530.000133148234393076
550.9985760334794150.002847933041170740.00142396652058537

\begin{tabular}{lllllllll}
\hline
Goldfeld-Quandt test for Heteroskedasticity \tabularnewline
p-values & Alternative Hypothesis \tabularnewline
breakpoint index & greater & 2-sided & less \tabularnewline
5 & 0.00353190085278627 & 0.00706380170557254 & 0.996468099147214 \tabularnewline
6 & 0.000475962731378316 & 0.000951925462756633 & 0.999524037268622 \tabularnewline
7 & 9.76489486426595e-05 & 0.000195297897285319 & 0.999902351051357 \tabularnewline
8 & 2.54017830116207e-05 & 5.08035660232414e-05 & 0.999974598216988 \tabularnewline
9 & 5.45945213473123e-06 & 1.09189042694625e-05 & 0.999994540547865 \tabularnewline
10 & 1.30048312140784e-05 & 2.60096624281569e-05 & 0.999986995168786 \tabularnewline
11 & 4.60562124556479e-05 & 9.21124249112957e-05 & 0.999953943787544 \tabularnewline
12 & 5.60890404279288e-05 & 0.000112178080855858 & 0.999943910959572 \tabularnewline
13 & 7.94211420511616e-05 & 0.000158842284102323 & 0.99992057885795 \tabularnewline
14 & 0.000193200648112691 & 0.000386401296225381 & 0.999806799351887 \tabularnewline
15 & 0.00879090788830782 & 0.0175818157766156 & 0.991209092111692 \tabularnewline
16 & 0.0722700636989494 & 0.144540127397899 & 0.92772993630105 \tabularnewline
17 & 0.249870783920006 & 0.499741567840012 & 0.750129216079994 \tabularnewline
18 & 0.583718929259909 & 0.832562141480181 & 0.416281070740091 \tabularnewline
19 & 0.851361926118107 & 0.297276147763785 & 0.148638073881893 \tabularnewline
20 & 0.961234187388 & 0.0775316252239987 & 0.0387658126119994 \tabularnewline
21 & 0.995343661158418 & 0.00931267768316422 & 0.00465633884158211 \tabularnewline
22 & 0.999690000979959 & 0.000619998040082617 & 0.000309999020041309 \tabularnewline
23 & 0.9999811208615 & 3.77582770001261e-05 & 1.88791385000630e-05 \tabularnewline
24 & 0.999997977969165 & 4.0440616693207e-06 & 2.02203083466035e-06 \tabularnewline
25 & 0.999999776791037 & 4.46417926142944e-07 & 2.23208963071472e-07 \tabularnewline
26 & 0.99999997630481 & 4.73903783442113e-08 & 2.36951891721056e-08 \tabularnewline
27 & 0.999999995941818 & 8.11636350331531e-09 & 4.05818175165766e-09 \tabularnewline
28 & 0.999999998185024 & 3.62995130718905e-09 & 1.81497565359452e-09 \tabularnewline
29 & 0.99999999898168 & 2.03664028809581e-09 & 1.01832014404791e-09 \tabularnewline
30 & 0.999999999451629 & 1.09674264922134e-09 & 5.48371324610669e-10 \tabularnewline
31 & 0.999999999832665 & 3.34670152761284e-10 & 1.67335076380642e-10 \tabularnewline
32 & 0.999999999990368 & 1.92645708574254e-11 & 9.6322854287127e-12 \tabularnewline
33 & 0.999999999998263 & 3.47488330103234e-12 & 1.73744165051617e-12 \tabularnewline
34 & 0.999999999996886 & 6.22712989073223e-12 & 3.11356494536612e-12 \tabularnewline
35 & 0.999999999985738 & 2.85249216238025e-11 & 1.42624608119012e-11 \tabularnewline
36 & 0.999999999929737 & 1.4052575431908e-10 & 7.026287715954e-11 \tabularnewline
37 & 0.999999999688492 & 6.23016730731018e-10 & 3.11508365365509e-10 \tabularnewline
38 & 0.999999998842634 & 2.31473134142511e-09 & 1.15736567071256e-09 \tabularnewline
39 & 0.999999996815978 & 6.36804440198637e-09 & 3.18402220099319e-09 \tabularnewline
40 & 0.999999987084253 & 2.58314938390459e-08 & 1.29157469195230e-08 \tabularnewline
41 & 0.99999995549434 & 8.90113211704709e-08 & 4.45056605852354e-08 \tabularnewline
42 & 0.999999865481972 & 2.69036056203165e-07 & 1.34518028101583e-07 \tabularnewline
43 & 0.999999647030413 & 7.05939174139923e-07 & 3.52969587069961e-07 \tabularnewline
44 & 0.999999286882236 & 1.42623552745598e-06 & 7.13117763727992e-07 \tabularnewline
45 & 0.999997673319522 & 4.65336095611723e-06 & 2.32668047805862e-06 \tabularnewline
46 & 0.9999906847504 & 1.86304991985127e-05 & 9.31524959925635e-06 \tabularnewline
47 & 0.999966955854387 & 6.6088291226802e-05 & 3.3044145613401e-05 \tabularnewline
48 & 0.999902523125526 & 0.000194953748947289 & 9.74768744736445e-05 \tabularnewline
49 & 0.999875226148606 & 0.000249547702788523 & 0.000124773851394262 \tabularnewline
50 & 0.99997630334149 & 4.73933170194155e-05 & 2.36966585097078e-05 \tabularnewline
51 & 0.999986881937834 & 2.62361243313835e-05 & 1.31180621656918e-05 \tabularnewline
52 & 0.999998811299283 & 2.37740143354248e-06 & 1.18870071677124e-06 \tabularnewline
53 & 0.999988964854605 & 2.20702907890516e-05 & 1.10351453945258e-05 \tabularnewline
54 & 0.999866851765607 & 0.000266296468786153 & 0.000133148234393076 \tabularnewline
55 & 0.998576033479415 & 0.00284793304117074 & 0.00142396652058537 \tabularnewline
\hline
\end{tabular}
%Source: https://freestatistics.org/blog/index.php?pk=57221&T=5

[TABLE]
[ROW][C]Goldfeld-Quandt test for Heteroskedasticity[/C][/ROW]
[ROW][C]p-values[/C][C]Alternative Hypothesis[/C][/ROW]
[ROW][C]breakpoint index[/C][C]greater[/C][C]2-sided[/C][C]less[/C][/ROW]
[ROW][C]5[/C][C]0.00353190085278627[/C][C]0.00706380170557254[/C][C]0.996468099147214[/C][/ROW]
[ROW][C]6[/C][C]0.000475962731378316[/C][C]0.000951925462756633[/C][C]0.999524037268622[/C][/ROW]
[ROW][C]7[/C][C]9.76489486426595e-05[/C][C]0.000195297897285319[/C][C]0.999902351051357[/C][/ROW]
[ROW][C]8[/C][C]2.54017830116207e-05[/C][C]5.08035660232414e-05[/C][C]0.999974598216988[/C][/ROW]
[ROW][C]9[/C][C]5.45945213473123e-06[/C][C]1.09189042694625e-05[/C][C]0.999994540547865[/C][/ROW]
[ROW][C]10[/C][C]1.30048312140784e-05[/C][C]2.60096624281569e-05[/C][C]0.999986995168786[/C][/ROW]
[ROW][C]11[/C][C]4.60562124556479e-05[/C][C]9.21124249112957e-05[/C][C]0.999953943787544[/C][/ROW]
[ROW][C]12[/C][C]5.60890404279288e-05[/C][C]0.000112178080855858[/C][C]0.999943910959572[/C][/ROW]
[ROW][C]13[/C][C]7.94211420511616e-05[/C][C]0.000158842284102323[/C][C]0.99992057885795[/C][/ROW]
[ROW][C]14[/C][C]0.000193200648112691[/C][C]0.000386401296225381[/C][C]0.999806799351887[/C][/ROW]
[ROW][C]15[/C][C]0.00879090788830782[/C][C]0.0175818157766156[/C][C]0.991209092111692[/C][/ROW]
[ROW][C]16[/C][C]0.0722700636989494[/C][C]0.144540127397899[/C][C]0.92772993630105[/C][/ROW]
[ROW][C]17[/C][C]0.249870783920006[/C][C]0.499741567840012[/C][C]0.750129216079994[/C][/ROW]
[ROW][C]18[/C][C]0.583718929259909[/C][C]0.832562141480181[/C][C]0.416281070740091[/C][/ROW]
[ROW][C]19[/C][C]0.851361926118107[/C][C]0.297276147763785[/C][C]0.148638073881893[/C][/ROW]
[ROW][C]20[/C][C]0.961234187388[/C][C]0.0775316252239987[/C][C]0.0387658126119994[/C][/ROW]
[ROW][C]21[/C][C]0.995343661158418[/C][C]0.00931267768316422[/C][C]0.00465633884158211[/C][/ROW]
[ROW][C]22[/C][C]0.999690000979959[/C][C]0.000619998040082617[/C][C]0.000309999020041309[/C][/ROW]
[ROW][C]23[/C][C]0.9999811208615[/C][C]3.77582770001261e-05[/C][C]1.88791385000630e-05[/C][/ROW]
[ROW][C]24[/C][C]0.999997977969165[/C][C]4.0440616693207e-06[/C][C]2.02203083466035e-06[/C][/ROW]
[ROW][C]25[/C][C]0.999999776791037[/C][C]4.46417926142944e-07[/C][C]2.23208963071472e-07[/C][/ROW]
[ROW][C]26[/C][C]0.99999997630481[/C][C]4.73903783442113e-08[/C][C]2.36951891721056e-08[/C][/ROW]
[ROW][C]27[/C][C]0.999999995941818[/C][C]8.11636350331531e-09[/C][C]4.05818175165766e-09[/C][/ROW]
[ROW][C]28[/C][C]0.999999998185024[/C][C]3.62995130718905e-09[/C][C]1.81497565359452e-09[/C][/ROW]
[ROW][C]29[/C][C]0.99999999898168[/C][C]2.03664028809581e-09[/C][C]1.01832014404791e-09[/C][/ROW]
[ROW][C]30[/C][C]0.999999999451629[/C][C]1.09674264922134e-09[/C][C]5.48371324610669e-10[/C][/ROW]
[ROW][C]31[/C][C]0.999999999832665[/C][C]3.34670152761284e-10[/C][C]1.67335076380642e-10[/C][/ROW]
[ROW][C]32[/C][C]0.999999999990368[/C][C]1.92645708574254e-11[/C][C]9.6322854287127e-12[/C][/ROW]
[ROW][C]33[/C][C]0.999999999998263[/C][C]3.47488330103234e-12[/C][C]1.73744165051617e-12[/C][/ROW]
[ROW][C]34[/C][C]0.999999999996886[/C][C]6.22712989073223e-12[/C][C]3.11356494536612e-12[/C][/ROW]
[ROW][C]35[/C][C]0.999999999985738[/C][C]2.85249216238025e-11[/C][C]1.42624608119012e-11[/C][/ROW]
[ROW][C]36[/C][C]0.999999999929737[/C][C]1.4052575431908e-10[/C][C]7.026287715954e-11[/C][/ROW]
[ROW][C]37[/C][C]0.999999999688492[/C][C]6.23016730731018e-10[/C][C]3.11508365365509e-10[/C][/ROW]
[ROW][C]38[/C][C]0.999999998842634[/C][C]2.31473134142511e-09[/C][C]1.15736567071256e-09[/C][/ROW]
[ROW][C]39[/C][C]0.999999996815978[/C][C]6.36804440198637e-09[/C][C]3.18402220099319e-09[/C][/ROW]
[ROW][C]40[/C][C]0.999999987084253[/C][C]2.58314938390459e-08[/C][C]1.29157469195230e-08[/C][/ROW]
[ROW][C]41[/C][C]0.99999995549434[/C][C]8.90113211704709e-08[/C][C]4.45056605852354e-08[/C][/ROW]
[ROW][C]42[/C][C]0.999999865481972[/C][C]2.69036056203165e-07[/C][C]1.34518028101583e-07[/C][/ROW]
[ROW][C]43[/C][C]0.999999647030413[/C][C]7.05939174139923e-07[/C][C]3.52969587069961e-07[/C][/ROW]
[ROW][C]44[/C][C]0.999999286882236[/C][C]1.42623552745598e-06[/C][C]7.13117763727992e-07[/C][/ROW]
[ROW][C]45[/C][C]0.999997673319522[/C][C]4.65336095611723e-06[/C][C]2.32668047805862e-06[/C][/ROW]
[ROW][C]46[/C][C]0.9999906847504[/C][C]1.86304991985127e-05[/C][C]9.31524959925635e-06[/C][/ROW]
[ROW][C]47[/C][C]0.999966955854387[/C][C]6.6088291226802e-05[/C][C]3.3044145613401e-05[/C][/ROW]
[ROW][C]48[/C][C]0.999902523125526[/C][C]0.000194953748947289[/C][C]9.74768744736445e-05[/C][/ROW]
[ROW][C]49[/C][C]0.999875226148606[/C][C]0.000249547702788523[/C][C]0.000124773851394262[/C][/ROW]
[ROW][C]50[/C][C]0.99997630334149[/C][C]4.73933170194155e-05[/C][C]2.36966585097078e-05[/C][/ROW]
[ROW][C]51[/C][C]0.999986881937834[/C][C]2.62361243313835e-05[/C][C]1.31180621656918e-05[/C][/ROW]
[ROW][C]52[/C][C]0.999998811299283[/C][C]2.37740143354248e-06[/C][C]1.18870071677124e-06[/C][/ROW]
[ROW][C]53[/C][C]0.999988964854605[/C][C]2.20702907890516e-05[/C][C]1.10351453945258e-05[/C][/ROW]
[ROW][C]54[/C][C]0.999866851765607[/C][C]0.000266296468786153[/C][C]0.000133148234393076[/C][/ROW]
[ROW][C]55[/C][C]0.998576033479415[/C][C]0.00284793304117074[/C][C]0.00142396652058537[/C][/ROW]
[/TABLE]
Source: https://freestatistics.org/blog/index.php?pk=57221&T=5

Globally Unique Identifier (entire table): ba.freestatistics.org/blog/index.php?pk=57221&T=5

As an alternative you can also use a QR Code:  

The GUIDs for individual cells are displayed in the table below:

Goldfeld-Quandt test for Heteroskedasticity
p-valuesAlternative Hypothesis
breakpoint indexgreater2-sidedless
50.003531900852786270.007063801705572540.996468099147214
60.0004759627313783160.0009519254627566330.999524037268622
79.76489486426595e-050.0001952978972853190.999902351051357
82.54017830116207e-055.08035660232414e-050.999974598216988
95.45945213473123e-061.09189042694625e-050.999994540547865
101.30048312140784e-052.60096624281569e-050.999986995168786
114.60562124556479e-059.21124249112957e-050.999953943787544
125.60890404279288e-050.0001121780808558580.999943910959572
137.94211420511616e-050.0001588422841023230.99992057885795
140.0001932006481126910.0003864012962253810.999806799351887
150.008790907888307820.01758181577661560.991209092111692
160.07227006369894940.1445401273978990.92772993630105
170.2498707839200060.4997415678400120.750129216079994
180.5837189292599090.8325621414801810.416281070740091
190.8513619261181070.2972761477637850.148638073881893
200.9612341873880.07753162522399870.0387658126119994
210.9953436611584180.009312677683164220.00465633884158211
220.9996900009799590.0006199980400826170.000309999020041309
230.99998112086153.77582770001261e-051.88791385000630e-05
240.9999979779691654.0440616693207e-062.02203083466035e-06
250.9999997767910374.46417926142944e-072.23208963071472e-07
260.999999976304814.73903783442113e-082.36951891721056e-08
270.9999999959418188.11636350331531e-094.05818175165766e-09
280.9999999981850243.62995130718905e-091.81497565359452e-09
290.999999998981682.03664028809581e-091.01832014404791e-09
300.9999999994516291.09674264922134e-095.48371324610669e-10
310.9999999998326653.34670152761284e-101.67335076380642e-10
320.9999999999903681.92645708574254e-119.6322854287127e-12
330.9999999999982633.47488330103234e-121.73744165051617e-12
340.9999999999968866.22712989073223e-123.11356494536612e-12
350.9999999999857382.85249216238025e-111.42624608119012e-11
360.9999999999297371.4052575431908e-107.026287715954e-11
370.9999999996884926.23016730731018e-103.11508365365509e-10
380.9999999988426342.31473134142511e-091.15736567071256e-09
390.9999999968159786.36804440198637e-093.18402220099319e-09
400.9999999870842532.58314938390459e-081.29157469195230e-08
410.999999955494348.90113211704709e-084.45056605852354e-08
420.9999998654819722.69036056203165e-071.34518028101583e-07
430.9999996470304137.05939174139923e-073.52969587069961e-07
440.9999992868822361.42623552745598e-067.13117763727992e-07
450.9999976733195224.65336095611723e-062.32668047805862e-06
460.99999068475041.86304991985127e-059.31524959925635e-06
470.9999669558543876.6088291226802e-053.3044145613401e-05
480.9999025231255260.0001949537489472899.74768744736445e-05
490.9998752261486060.0002495477027885230.000124773851394262
500.999976303341494.73933170194155e-052.36966585097078e-05
510.9999868819378342.62361243313835e-051.31180621656918e-05
520.9999988112992832.37740143354248e-061.18870071677124e-06
530.9999889648546052.20702907890516e-051.10351453945258e-05
540.9998668517656070.0002662964687861530.000133148234393076
550.9985760334794150.002847933041170740.00142396652058537


Meta Analysis of Goldfeld-Quandt test for Heteroskedasticity
Description# significant tests% significant testsOK/NOK
1% type I error level450.88235294117647NOK
5% type I error level460.901960784313726NOK
10% type I error level470.92156862745098NOK

\begin{tabular}{lllllllll}
\hline
Meta Analysis of Goldfeld-Quandt test for Heteroskedasticity \tabularnewline
Description & # significant tests & % significant tests & OK/NOK \tabularnewline
1% type I error level & 45 & 0.88235294117647 & NOK \tabularnewline
5% type I error level & 46 & 0.901960784313726 & NOK \tabularnewline
10% type I error level & 47 & 0.92156862745098 & NOK \tabularnewline
\hline
\end{tabular}
%Source: https://freestatistics.org/blog/index.php?pk=57221&T=6

[TABLE]
[ROW][C]Meta Analysis of Goldfeld-Quandt test for Heteroskedasticity[/C][/ROW]
[ROW][C]Description[/C][C]# significant tests[/C][C]% significant tests[/C][C]OK/NOK[/C][/ROW]
[ROW][C]1% type I error level[/C][C]45[/C][C]0.88235294117647[/C][C]NOK[/C][/ROW]
[ROW][C]5% type I error level[/C][C]46[/C][C]0.901960784313726[/C][C]NOK[/C][/ROW]
[ROW][C]10% type I error level[/C][C]47[/C][C]0.92156862745098[/C][C]NOK[/C][/ROW]
[/TABLE]
Source: https://freestatistics.org/blog/index.php?pk=57221&T=6

Globally Unique Identifier (entire table): ba.freestatistics.org/blog/index.php?pk=57221&T=6

As an alternative you can also use a QR Code:  

The GUIDs for individual cells are displayed in the table below:

Meta Analysis of Goldfeld-Quandt test for Heteroskedasticity
Description# significant tests% significant testsOK/NOK
1% type I error level450.88235294117647NOK
5% type I error level460.901960784313726NOK
10% type I error level470.92156862745098NOK


Parameters (Session):
par1 = 1 ; par2 = Do not include Seasonal Dummies ; par3 = No Linear Trend ;
Parameters (R input):
par1 = 1 ; par2 = Do not include Seasonal Dummies ; par3 = No Linear Trend ;
R code (references can be found in the software module):
library(lattice)
library(lmtest)
n25 <- 25 #minimum number of obs. for Goldfeld-Quandt test
par1 <- as.numeric(par1)
x <- t(y)
k <- length(x[1,])
n <- length(x[,1])
x1 <- cbind(x[,par1], x[,1:k!=par1])
mycolnames <- c(colnames(x)[par1], colnames(x)[1:k!=par1])
colnames(x1) <- mycolnames #colnames(x)[par1]
x <- x1
if (par3 == 'First Differences'){
x2 <- array(0, dim=c(n-1,k), dimnames=list(1:(n-1), paste('(1-B)',colnames(x),sep='')))
for (i in 1:n-1) {
for (j in 1:k) {
x2[i,j] <- x[i+1,j] - x[i,j]
}
}
x <- x2
}
if (par2 == 'Include Monthly Dummies'){
x2 <- array(0, dim=c(n,11), dimnames=list(1:n, paste('M', seq(1:11), sep ='')))
for (i in 1:11){
x2[seq(i,n,12),i] <- 1
}
x <- cbind(x, x2)
}
if (par2 == 'Include Quarterly Dummies'){
x2 <- array(0, dim=c(n,3), dimnames=list(1:n, paste('Q', seq(1:3), sep ='')))
for (i in 1:3){
x2[seq(i,n,4),i] <- 1
}
x <- cbind(x, x2)
}
k <- length(x[1,])
if (par3 == 'Linear Trend'){
x <- cbind(x, c(1:n))
colnames(x)[k+1] <- 't'
}
x
k <- length(x[1,])
df <- as.data.frame(x)
(mylm <- lm(df))
(mysum <- summary(mylm))
if (n > n25) {
kp3 <- k + 3
nmkm3 <- n - k - 3
gqarr <- array(NA, dim=c(nmkm3-kp3+1,3))
numgqtests <- 0
numsignificant1 <- 0
numsignificant5 <- 0
numsignificant10 <- 0
for (mypoint in kp3:nmkm3) {
j <- 0
numgqtests <- numgqtests + 1
for (myalt in c('greater', 'two.sided', 'less')) {
j <- j + 1
gqarr[mypoint-kp3+1,j] <- gqtest(mylm, point=mypoint, alternative=myalt)$p.value
}
if (gqarr[mypoint-kp3+1,2] < 0.01) numsignificant1 <- numsignificant1 + 1
if (gqarr[mypoint-kp3+1,2] < 0.05) numsignificant5 <- numsignificant5 + 1
if (gqarr[mypoint-kp3+1,2] < 0.10) numsignificant10 <- numsignificant10 + 1
}
gqarr
}
bitmap(file='test0.png')
plot(x[,1], type='l', main='Actuals and Interpolation', ylab='value of Actuals and Interpolation (dots)', xlab='time or index')
points(x[,1]-mysum$resid)
grid()
dev.off()
bitmap(file='test1.png')
plot(mysum$resid, type='b', pch=19, main='Residuals', ylab='value of Residuals', xlab='time or index')
grid()
dev.off()
bitmap(file='test2.png')
hist(mysum$resid, main='Residual Histogram', xlab='values of Residuals')
grid()
dev.off()
bitmap(file='test3.png')
densityplot(~mysum$resid,col='black',main='Residual Density Plot', xlab='values of Residuals')
dev.off()
bitmap(file='test4.png')
qqnorm(mysum$resid, main='Residual Normal Q-Q Plot')
qqline(mysum$resid)
grid()
dev.off()
(myerror <- as.ts(mysum$resid))
bitmap(file='test5.png')
dum <- cbind(lag(myerror,k=1),myerror)
dum
dum1 <- dum[2:length(myerror),]
dum1
z <- as.data.frame(dum1)
z
plot(z,main=paste('Residual Lag plot, lowess, and regression line'), ylab='values of Residuals', xlab='lagged values of Residuals')
lines(lowess(z))
abline(lm(z))
grid()
dev.off()
bitmap(file='test6.png')
acf(mysum$resid, lag.max=length(mysum$resid)/2, main='Residual Autocorrelation Function')
grid()
dev.off()
bitmap(file='test7.png')
pacf(mysum$resid, lag.max=length(mysum$resid)/2, main='Residual Partial Autocorrelation Function')
grid()
dev.off()
bitmap(file='test8.png')
opar <- par(mfrow = c(2,2), oma = c(0, 0, 1.1, 0))
plot(mylm, las = 1, sub='Residual Diagnostics')
par(opar)
dev.off()
if (n > n25) {
bitmap(file='test9.png')
plot(kp3:nmkm3,gqarr[,2], main='Goldfeld-Quandt test',ylab='2-sided p-value',xlab='breakpoint')
grid()
dev.off()
}
load(file='createtable')
a<-table.start()
a<-table.row.start(a)
a<-table.element(a, 'Multiple Linear Regression - Estimated Regression Equation', 1, TRUE)
a<-table.row.end(a)
myeq <- colnames(x)[1]
myeq <- paste(myeq, '[t] = ', sep='')
for (i in 1:k){
if (mysum$coefficients[i,1] > 0) myeq <- paste(myeq, '+', '')
myeq <- paste(myeq, mysum$coefficients[i,1], sep=' ')
if (rownames(mysum$coefficients)[i] != '(Intercept)') {
myeq <- paste(myeq, rownames(mysum$coefficients)[i], sep='')
if (rownames(mysum$coefficients)[i] != 't') myeq <- paste(myeq, '[t]', sep='')
}
}
myeq <- paste(myeq, ' + e[t]')
a<-table.row.start(a)
a<-table.element(a, myeq)
a<-table.row.end(a)
a<-table.end(a)
table.save(a,file='mytable1.tab')
a<-table.start()
a<-table.row.start(a)
a<-table.element(a,hyperlink('ols1.htm','Multiple Linear Regression - Ordinary Least Squares',''), 6, TRUE)
a<-table.row.end(a)
a<-table.row.start(a)
a<-table.element(a,'Variable',header=TRUE)
a<-table.element(a,'Parameter',header=TRUE)
a<-table.element(a,'S.D.',header=TRUE)
a<-table.element(a,'T-STAT
H0: parameter = 0',header=TRUE)
a<-table.element(a,'2-tail p-value',header=TRUE)
a<-table.element(a,'1-tail p-value',header=TRUE)
a<-table.row.end(a)
for (i in 1:k){
a<-table.row.start(a)
a<-table.element(a,rownames(mysum$coefficients)[i],header=TRUE)
a<-table.element(a,mysum$coefficients[i,1])
a<-table.element(a, round(mysum$coefficients[i,2],6))
a<-table.element(a, round(mysum$coefficients[i,3],4))
a<-table.element(a, round(mysum$coefficients[i,4],6))
a<-table.element(a, round(mysum$coefficients[i,4]/2,6))
a<-table.row.end(a)
}
a<-table.end(a)
table.save(a,file='mytable2.tab')
a<-table.start()
a<-table.row.start(a)
a<-table.element(a, 'Multiple Linear Regression - Regression Statistics', 2, TRUE)
a<-table.row.end(a)
a<-table.row.start(a)
a<-table.element(a, 'Multiple R',1,TRUE)
a<-table.element(a, sqrt(mysum$r.squared))
a<-table.row.end(a)
a<-table.row.start(a)
a<-table.element(a, 'R-squared',1,TRUE)
a<-table.element(a, mysum$r.squared)
a<-table.row.end(a)
a<-table.row.start(a)
a<-table.element(a, 'Adjusted R-squared',1,TRUE)
a<-table.element(a, mysum$adj.r.squared)
a<-table.row.end(a)
a<-table.row.start(a)
a<-table.element(a, 'F-TEST (value)',1,TRUE)
a<-table.element(a, mysum$fstatistic[1])
a<-table.row.end(a)
a<-table.row.start(a)
a<-table.element(a, 'F-TEST (DF numerator)',1,TRUE)
a<-table.element(a, mysum$fstatistic[2])
a<-table.row.end(a)
a<-table.row.start(a)
a<-table.element(a, 'F-TEST (DF denominator)',1,TRUE)
a<-table.element(a, mysum$fstatistic[3])
a<-table.row.end(a)
a<-table.row.start(a)
a<-table.element(a, 'p-value',1,TRUE)
a<-table.element(a, 1-pf(mysum$fstatistic[1],mysum$fstatistic[2],mysum$fstatistic[3]))
a<-table.row.end(a)
a<-table.row.start(a)
a<-table.element(a, 'Multiple Linear Regression - Residual Statistics', 2, TRUE)
a<-table.row.end(a)
a<-table.row.start(a)
a<-table.element(a, 'Residual Standard Deviation',1,TRUE)
a<-table.element(a, mysum$sigma)
a<-table.row.end(a)
a<-table.row.start(a)
a<-table.element(a, 'Sum Squared Residuals',1,TRUE)
a<-table.element(a, sum(myerror*myerror))
a<-table.row.end(a)
a<-table.end(a)
table.save(a,file='mytable3.tab')
a<-table.start()
a<-table.row.start(a)
a<-table.element(a, 'Multiple Linear Regression - Actuals, Interpolation, and Residuals', 4, TRUE)
a<-table.row.end(a)
a<-table.row.start(a)
a<-table.element(a, 'Time or Index', 1, TRUE)
a<-table.element(a, 'Actuals', 1, TRUE)
a<-table.element(a, 'Interpolation
Forecast', 1, TRUE)
a<-table.element(a, 'Residuals
Prediction Error', 1, TRUE)
a<-table.row.end(a)
for (i in 1:n) {
a<-table.row.start(a)
a<-table.element(a,i, 1, TRUE)
a<-table.element(a,x[i])
a<-table.element(a,x[i]-mysum$resid[i])
a<-table.element(a,mysum$resid[i])
a<-table.row.end(a)
}
a<-table.end(a)
table.save(a,file='mytable4.tab')
if (n > n25) {
a<-table.start()
a<-table.row.start(a)
a<-table.element(a,'Goldfeld-Quandt test for Heteroskedasticity',4,TRUE)
a<-table.row.end(a)
a<-table.row.start(a)
a<-table.element(a,'p-values',header=TRUE)
a<-table.element(a,'Alternative Hypothesis',3,header=TRUE)
a<-table.row.end(a)
a<-table.row.start(a)
a<-table.element(a,'breakpoint index',header=TRUE)
a<-table.element(a,'greater',header=TRUE)
a<-table.element(a,'2-sided',header=TRUE)
a<-table.element(a,'less',header=TRUE)
a<-table.row.end(a)
for (mypoint in kp3:nmkm3) {
a<-table.row.start(a)
a<-table.element(a,mypoint,header=TRUE)
a<-table.element(a,gqarr[mypoint-kp3+1,1])
a<-table.element(a,gqarr[mypoint-kp3+1,2])
a<-table.element(a,gqarr[mypoint-kp3+1,3])
a<-table.row.end(a)
}
a<-table.end(a)
table.save(a,file='mytable5.tab')
a<-table.start()
a<-table.row.start(a)
a<-table.element(a,'Meta Analysis of Goldfeld-Quandt test for Heteroskedasticity',4,TRUE)
a<-table.row.end(a)
a<-table.row.start(a)
a<-table.element(a,'Description',header=TRUE)
a<-table.element(a,'# significant tests',header=TRUE)
a<-table.element(a,'% significant tests',header=TRUE)
a<-table.element(a,'OK/NOK',header=TRUE)
a<-table.row.end(a)
a<-table.row.start(a)
a<-table.element(a,'1% type I error level',header=TRUE)
a<-table.element(a,numsignificant1)
a<-table.element(a,numsignificant1/numgqtests)
if (numsignificant1/numgqtests < 0.01) dum <- 'OK' else dum <- 'NOK'
a<-table.element(a,dum)
a<-table.row.end(a)
a<-table.row.start(a)
a<-table.element(a,'5% type I error level',header=TRUE)
a<-table.element(a,numsignificant5)
a<-table.element(a,numsignificant5/numgqtests)
if (numsignificant5/numgqtests < 0.05) dum <- 'OK' else dum <- 'NOK'
a<-table.element(a,dum)
a<-table.row.end(a)
a<-table.row.start(a)
a<-table.element(a,'10% type I error level',header=TRUE)
a<-table.element(a,numsignificant10)
a<-table.element(a,numsignificant10/numgqtests)
if (numsignificant10/numgqtests < 0.1) dum <- 'OK' else dum <- 'NOK'
a<-table.element(a,dum)
a<-table.row.end(a)
a<-table.end(a)
table.save(a,file='mytable6.tab')
}